HI5002 Project Report on Finance for Business - doc
Added on 2020-05-28
27 Pages7526 Words54 Views
Running Head: Finance For Business1Project Report: Finance for business
Finance For Business2ContentsIntroduction.......................................................................................................................31.Company description...............................................................................................32.Ownership governance structure.............................................................................33.Performance ratios...................................................................................................44.Changes in stock price.............................................................................................75.Significant factors....................................................................................................86.Calculation of CAPM and beta values.....................................................................87.WACC calculations.................................................................................................98.Debt ratios..............................................................................................................109.Dividend policy......................................................................................................1110.Recommendation and Conclusion.........................................................................11References.......................................................................................................................12Appendix.........................................................................................................................13
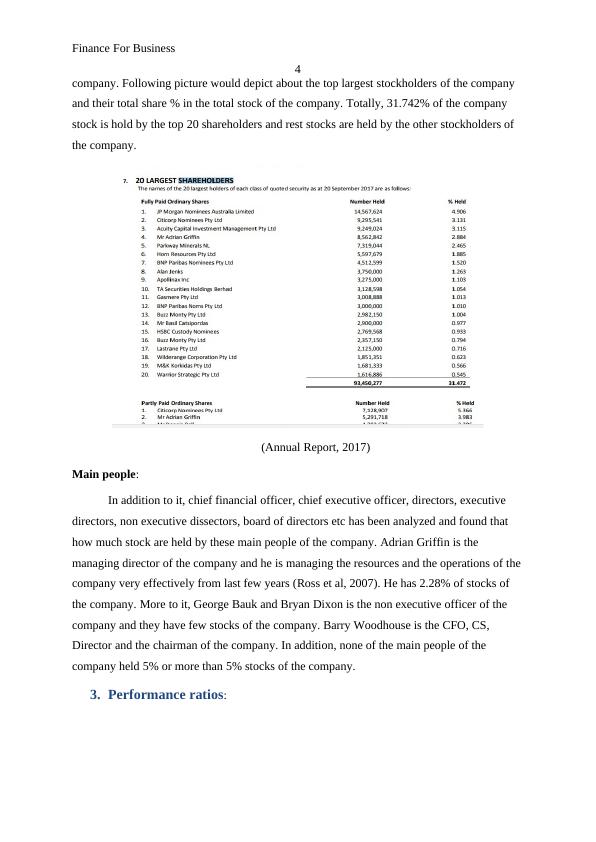
Finance For Business3Introduction: Financial evaluation brief the management, investor and financial analyst that how the company is managing its operations and the functions. An investor is always suggested bythe market analyst and financial analyst to identify and evaluate the financial position and performance of the company first and then make a decision about the investment in the company. Financial evaluation includes the process of evaluating the financial statements through conducting the study of ratio analysis, capital asset pricing method, vertical analysis method, horizontal analysis method, weighted average cost of capital etc. These methods assist the investors to evaluate the actual worth of the company so that a good decision could be made. 1.Company description:LITHIUM AUSTRALIA NL is an Australian company which is operating its business under Metals and Mining industry. The main function and operations of the company is acquiring, exploring, and developing the mineral properties. The company manufactures lithium carbonate for battery grade from lithium micas. The company is operating its business in international market. It supplies it product and services to worldwide. The main vision of the company is to cover the international market and serve its services and the products to overseas (Bloomberg, 2018). This company has put the energy storage, lithium batteries and electric car very quickly and efficiency in the global market. The company has manufactured the lithium batteries in cheaper price through adopting the new technology. Various financial analysts report express that this company is the best optionfor the purpose of investment as it would offer huge profit and return to the investors. 2.Ownership governance structure:Fir evaluating the worth of the company and the position of the company, study has been done over corporate governance of the company and the board directors and members ofthe company:Substantial stakeholders:Through the evaluation on annual report of LITHIUM AUSTRALIA NL, it has been found that the main shareholder of the company is JP Morgan Nominees Australia Limited. The company has the largest share of stock of the company which is around 4.906. Any of the shareholders of the company does not have 5% or more than 5% shareholdings in the
Finance For Business4company. Following picture would depict about the top largest stockholders of the company and their total share % in the total stock of the company. Totally, 31.742% of the company stock is hold by the top 20 shareholders and rest stocks are held by the other stockholders of the company. (Annual Report, 2017)Main people:In addition to it, chief financial officer, chief executive officer, directors, executive directors, non executive dissectors, board of directors etc has been analyzed and found that how much stock are held by these main people of the company. Adrian Griffin is the managing director of the company and he is managing the resources and the operations of thecompany very effectively from last few years (Ross et al, 2007). He has 2.28% of stocks of the company. More to it, George Bauk and Bryan Dixon is the non executive officer of the company and they have few stocks of the company. Barry Woodhouse is the CFO, CS, Director and the chairman of the company. In addition, none of the main people of the company held 5% or more than 5% stocks of the company. 3.Performance ratios:
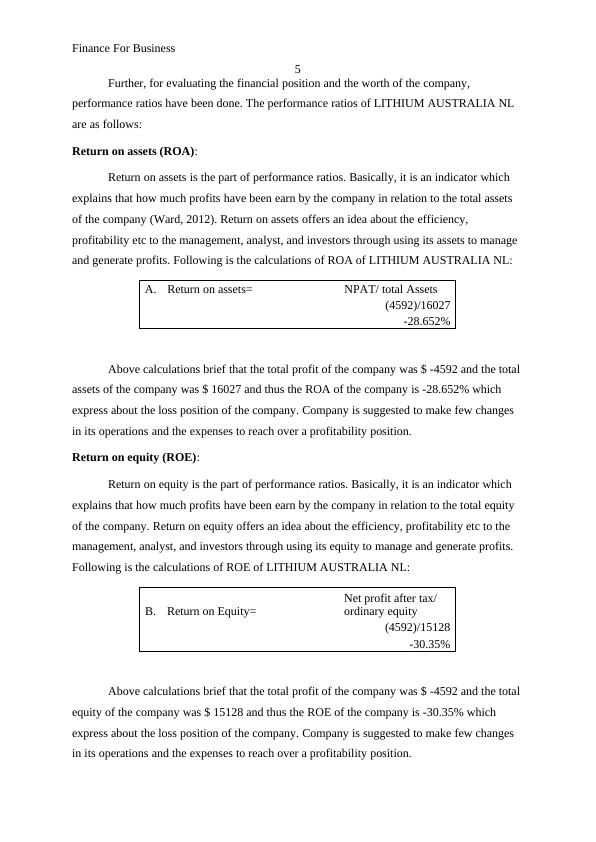
Finance For Business5Further, for evaluating the financial position and the worth of the company, performance ratios have been done. The performance ratios of LITHIUM AUSTRALIA NL are as follows: Return on assets (ROA):Return on assets is the part of performance ratios. Basically, it is an indicator which explains that how much profits have been earn by the company in relation to the total assets of the company (Ward, 2012). Return on assets offers an idea about the efficiency, profitability etc to the management, analyst, and investors through using its assets to manage and generate profits. Following is the calculations of ROA of LITHIUM AUSTRALIA NL:A.Return on assets=NPAT/ total Assets(4592)/16027-28.652%Above calculations brief that the total profit of the company was $ -4592 and the total assets of the company was $ 16027 and thus the ROA of the company is -28.652% which express about the loss position of the company. Company is suggested to make few changes in its operations and the expenses to reach over a profitability position. Return on equity (ROE):Return on equity is the part of performance ratios. Basically, it is an indicator which explains that how much profits have been earn by the company in relation to the total equity of the company. Return on equity offers an idea about the efficiency, profitability etc to the management, analyst, and investors through using its equity to manage and generate profits. Following is the calculations of ROE of LITHIUM AUSTRALIA NL:B.Return on Equity=Net profit after tax/ ordinary equity(4592)/15128-30.35%Above calculations brief that the total profit of the company was $ -4592 and the total equity of the company was $ 15128 and thus the ROE of the company is -30.35% which express about the loss position of the company. Company is suggested to make few changes in its operations and the expenses to reach over a profitability position.
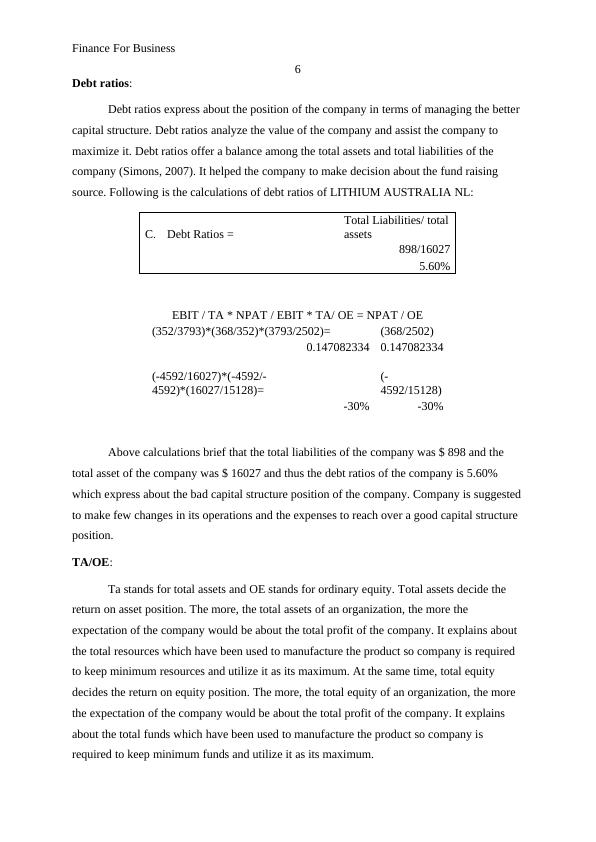
Finance For Business6Debt ratios:Debt ratios express about the position of the company in terms of managing the better capital structure. Debt ratios analyze the value of the company and assist the company to maximize it. Debt ratios offer a balance among the total assets and total liabilities of the company (Simons, 2007). It helped the company to make decision about the fund raising source. Following is the calculations of debt ratios of LITHIUM AUSTRALIA NL:C.Debt Ratios = Total Liabilities/ totalassets898/160275.60%EBIT / TA * NPAT / EBIT * TA/ OE = NPAT / OE(352/3793)*(368/352)*(3793/2502)=(368/2502)0.1470823340.147082334(-4592/16027)*(-4592/-4592)*(16027/15128)=(-4592/15128)-30%-30%Above calculations brief that the total liabilities of the company was $ 898 and the total asset of the company was $ 16027 and thus the debt ratios of the company is 5.60% which express about the bad capital structure position of the company. Company is suggestedto make few changes in its operations and the expenses to reach over a good capital structure position. TA/OE:Ta stands for total assets and OE stands for ordinary equity. Total assets decide the return on asset position. The more, the total assets of an organization, the more the expectation of the company would be about the total profit of the company. It explains about the total resources which have been used to manufacture the product so company is required to keep minimum resources and utilize it as its maximum. At the same time, total equity decides the return on equity position. The more, the total equity of an organization, the more the expectation of the company would be about the total profit of the company. It explains about the total funds which have been used to manufacture the product so company is required to keep minimum funds and utilize it as its maximum.
End of preview
Want to access all the pages? Upload your documents or become a member.
Related Documents
Finance for Business Analysis Reportlg...
|24
|3820
|413
FINANCE FOR BUSINESS Finance for Businesslg...
|9
|2135
|364
Project Report: Finance for Business Contentslg...
|34
|9920
|211
Financial Evaluation of Manhattan Corporation Limitedlg...
|27
|2686
|217
(Doc) Finance for Business : Assignmentlg...
|15
|3998
|22
Financial Management Process of Woolworths Assignmentlg...
|20
|5801
|183