Macroeconomics: Expenditure, Fiscal, and Monetary Policy Analysis
VerifiedAdded on 2023/01/12
|6
|1298
|93
Homework Assignment
AI Summary
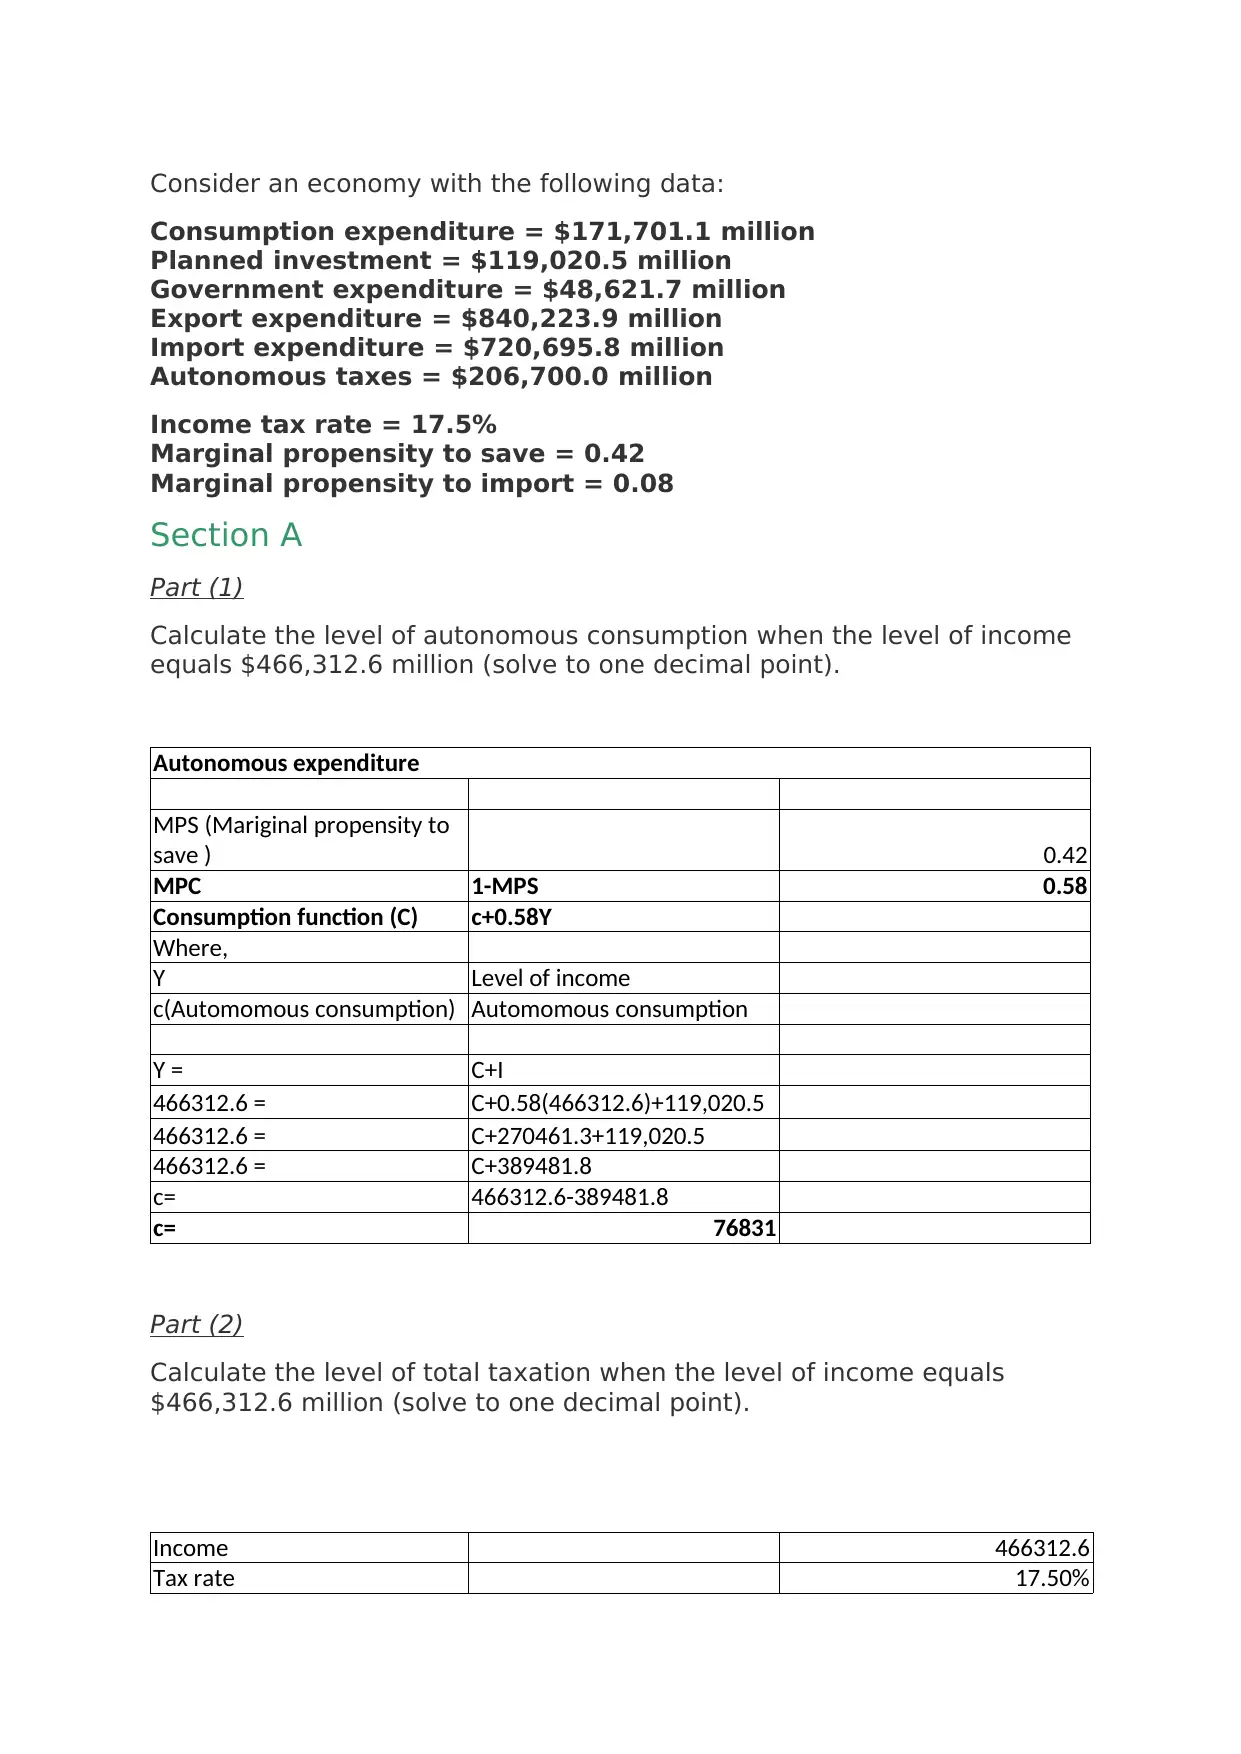
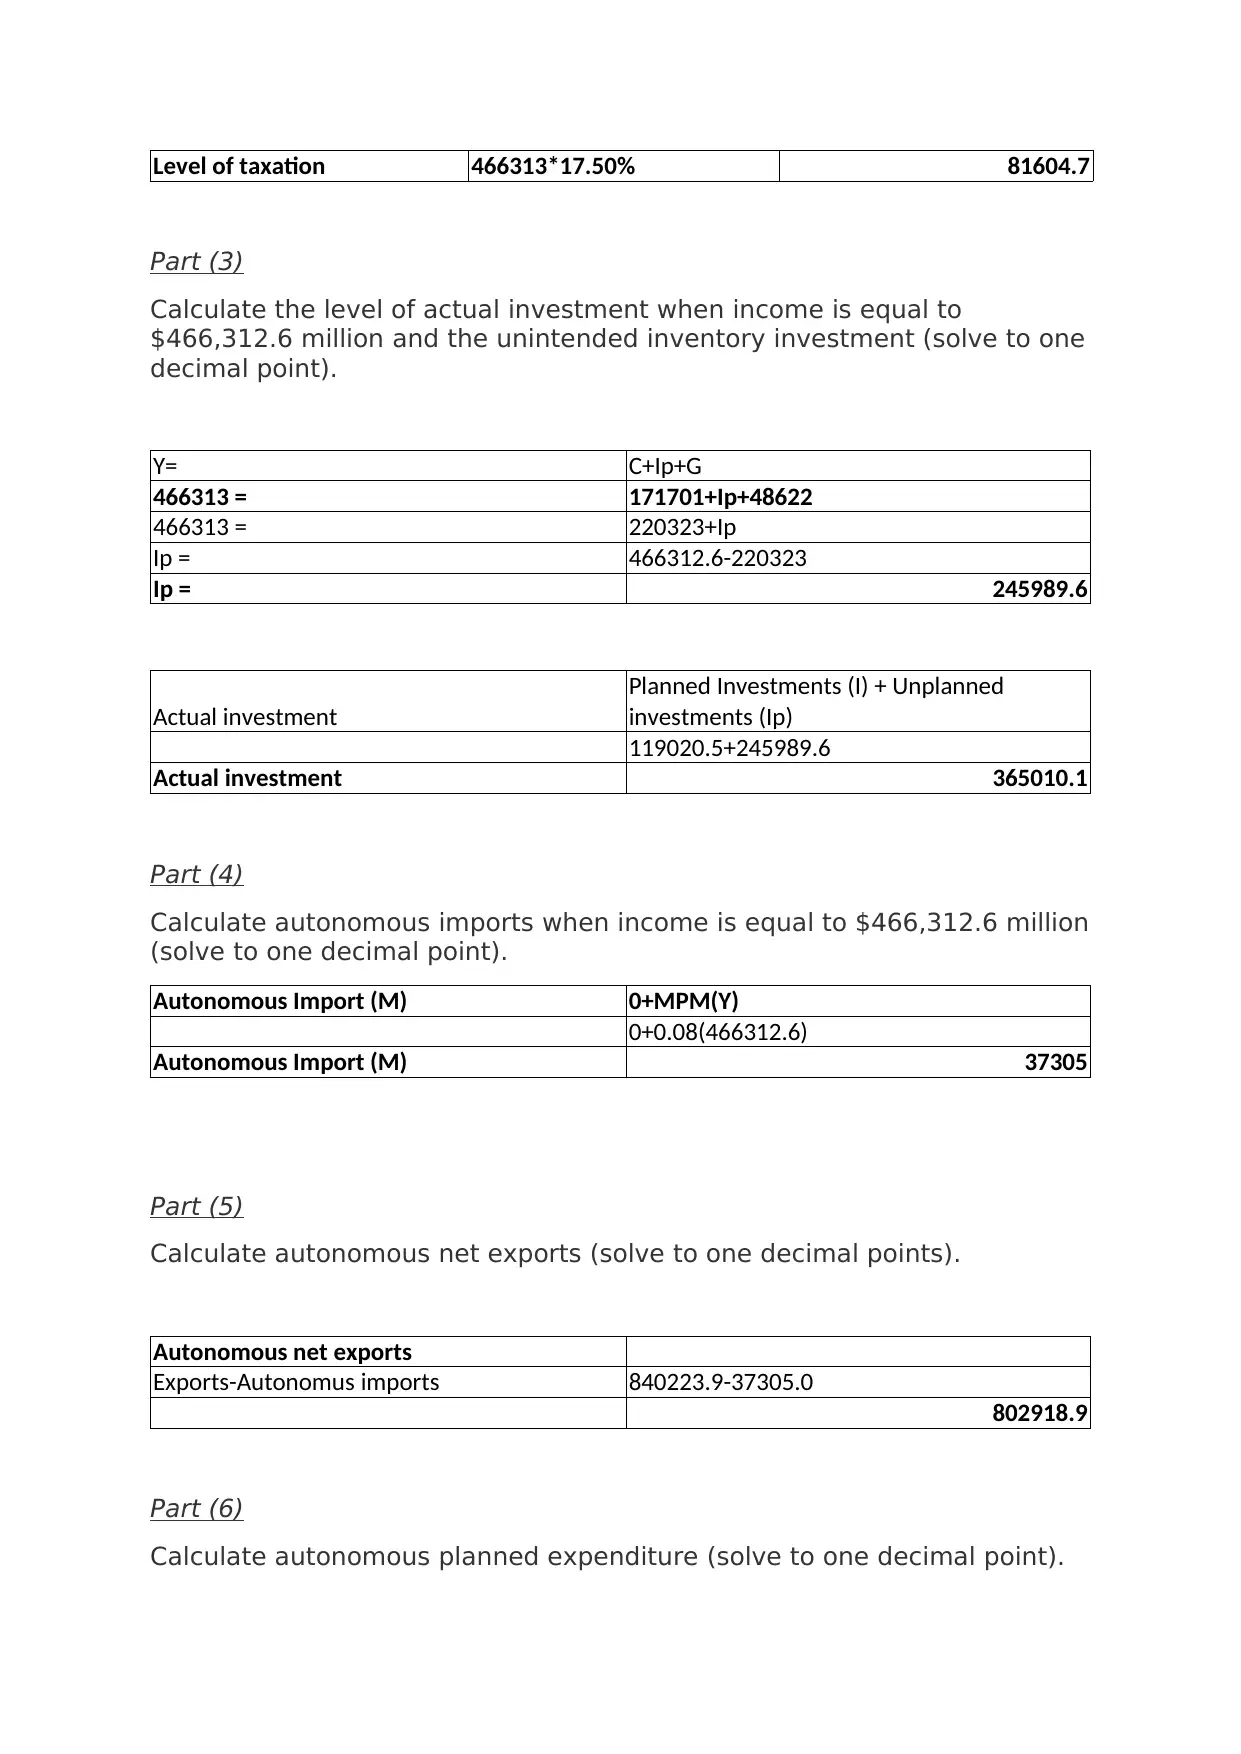
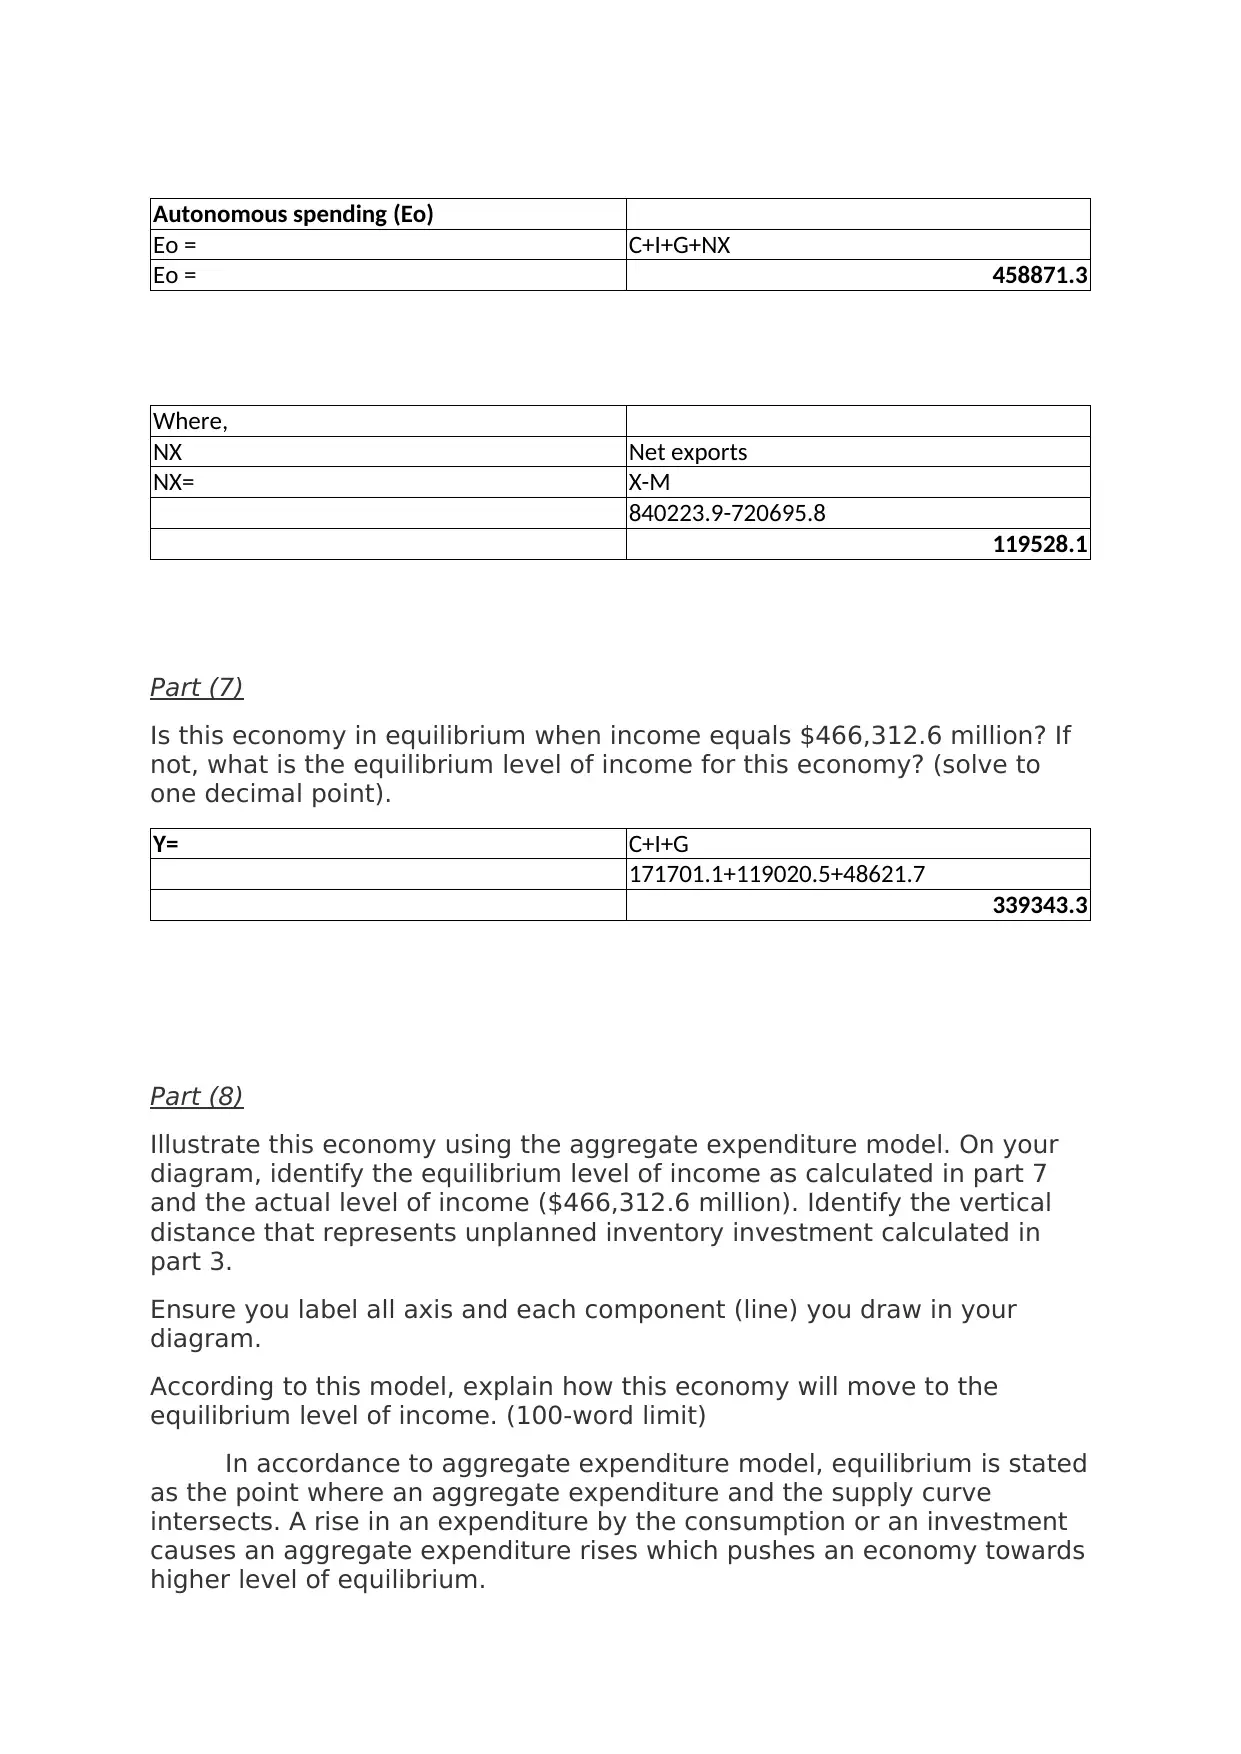
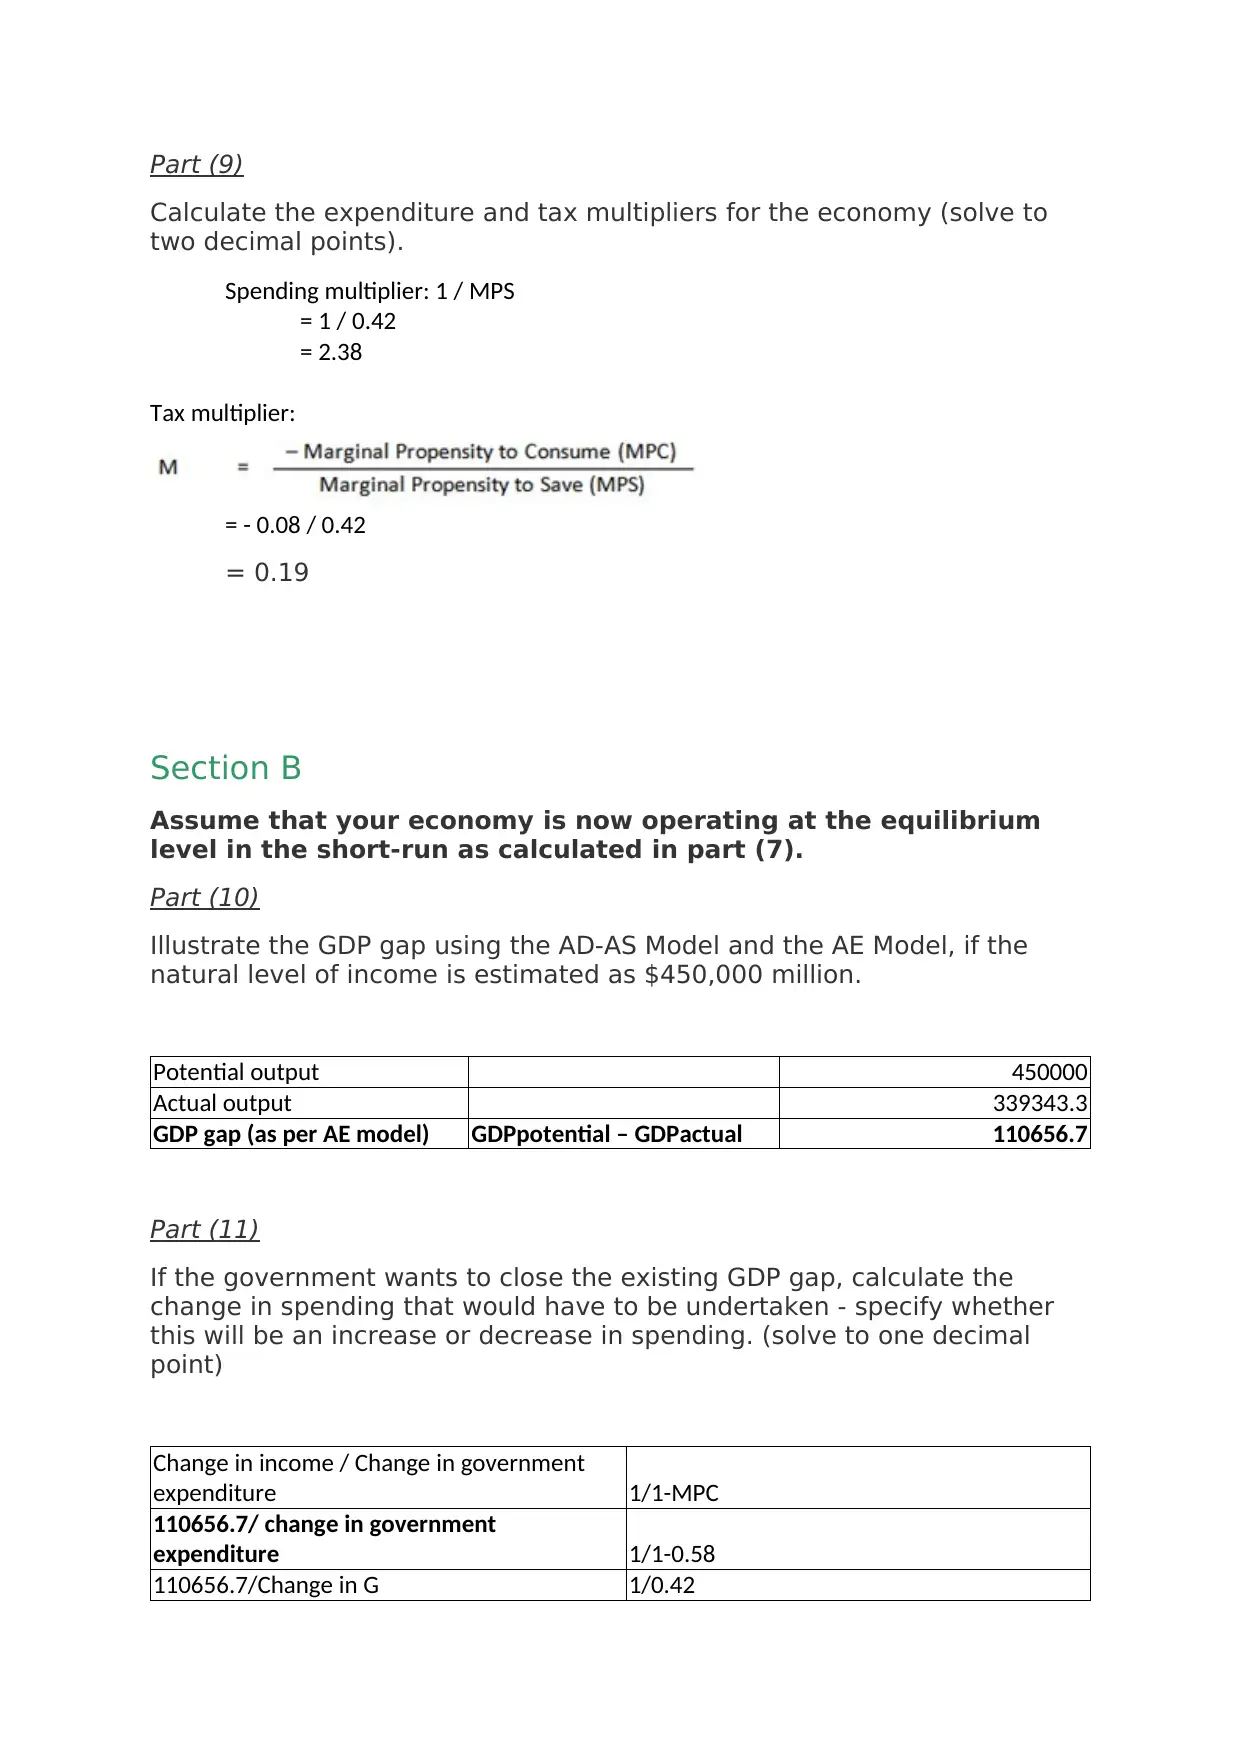
This economics assignment analyzes a macroeconomic model, calculating autonomous consumption, taxation, investment, and net exports. It determines equilibrium income and illustrates the economy using the aggregate expenditure model. The assignment further explores the GDP gap using the AD-AS and AE models, calculating changes in government spending and taxation needed to close the gap. It then examines the effects of monetary policy, including interest rate adjustments and open market operations, on exchange rates and the economy using the exchange rate market model and the IS-LM model, considering the impact on unemployment. The solution provides detailed calculations and explanations of key macroeconomic concepts and models.
1 out of 6
Related Documents


Your All-in-One AI-Powered Toolkit for Academic Success.
+13062052269
info@desklib.com
Available 24*7 on WhatsApp / Email
![[object Object]](/_next/static/media/star-bottom.7253800d.svg)
Copyright © 2020–2026 A2Z Services. All Rights Reserved. Developed and managed by ZUCOL.