Property Portfolio Management
VerifiedAdded on 2023/01/03
|16
|2529
|2
AI Summary
This study material provides an overview of property portfolio management, focusing on two specific vehicles: A-REIT and DPS/UPF. It covers details and current value of properties, diversity of property portfolios, risk management strategies, and recent performance and future outlook of the specified vehicles.
Contribute Materials
Your contribution can guide someone’s learning journey. Share your
documents today.
Running head: PROPERTY PORTFOLIO MANAGEMENT
Property Portfolio Management
Name of the Student:
Name of the University:
Author’s Note:
Property Portfolio Management
Name of the Student:
Name of the University:
Author’s Note:
Secure Best Marks with AI Grader
Need help grading? Try our AI Grader for instant feedback on your assignments.
1PROPERTY PORTFOLIO MANAGEMENT
Table of Contents
Section A: A-REIT..........................................................................................................................3
Overview of the Specific Vehicle................................................................................................3
Details and the Current Value of Property..................................................................................3
Diversity of Property Portfolio....................................................................................................3
Risk Management Strategy..........................................................................................................4
Recent Performance and Future Outlook of the Specified Vehicles...........................................7
Section B: DPS/UPF........................................................................................................................8
Overview of the Specific Vehicle................................................................................................8
Details and the Current Value of Property..................................................................................8
Diversity of Property Portfolio....................................................................................................9
Risk Management Strategy........................................................................................................10
Recent Performance and Future Outlook of the Specified Vehicles.........................................10
References......................................................................................................................................12
Appendix........................................................................................................................................14
1) Charter Hall Retail Property Portfolio Performance of NSW.........................................14
2) Charter Hall Retail Property Portfolio Performance of QLD, WA, NT.........................15
3) Portfolio Performance of SA,VIC...................................................................................16
2PROPERTY PORTFOLIO MANAGEMENT
Section A: A-REIT
Overview of the Specific Vehicle
The Australian REIT that has been selected for the purpose of analysis is the Charter Hall
Retail Fund that would be selected for the purpose of analysis. The Fund invests in Commercial
Australian Supermarket that are primarily located in various metro and non-metro areas. The
fund is highly diversified with the various kinds of investment that is done by the company in
various types of commercial properties including supermarket anchored and convenience-plus
shopping centres ("Charter Hall Retail REIT", 2019).
Details and the Current Value of Property
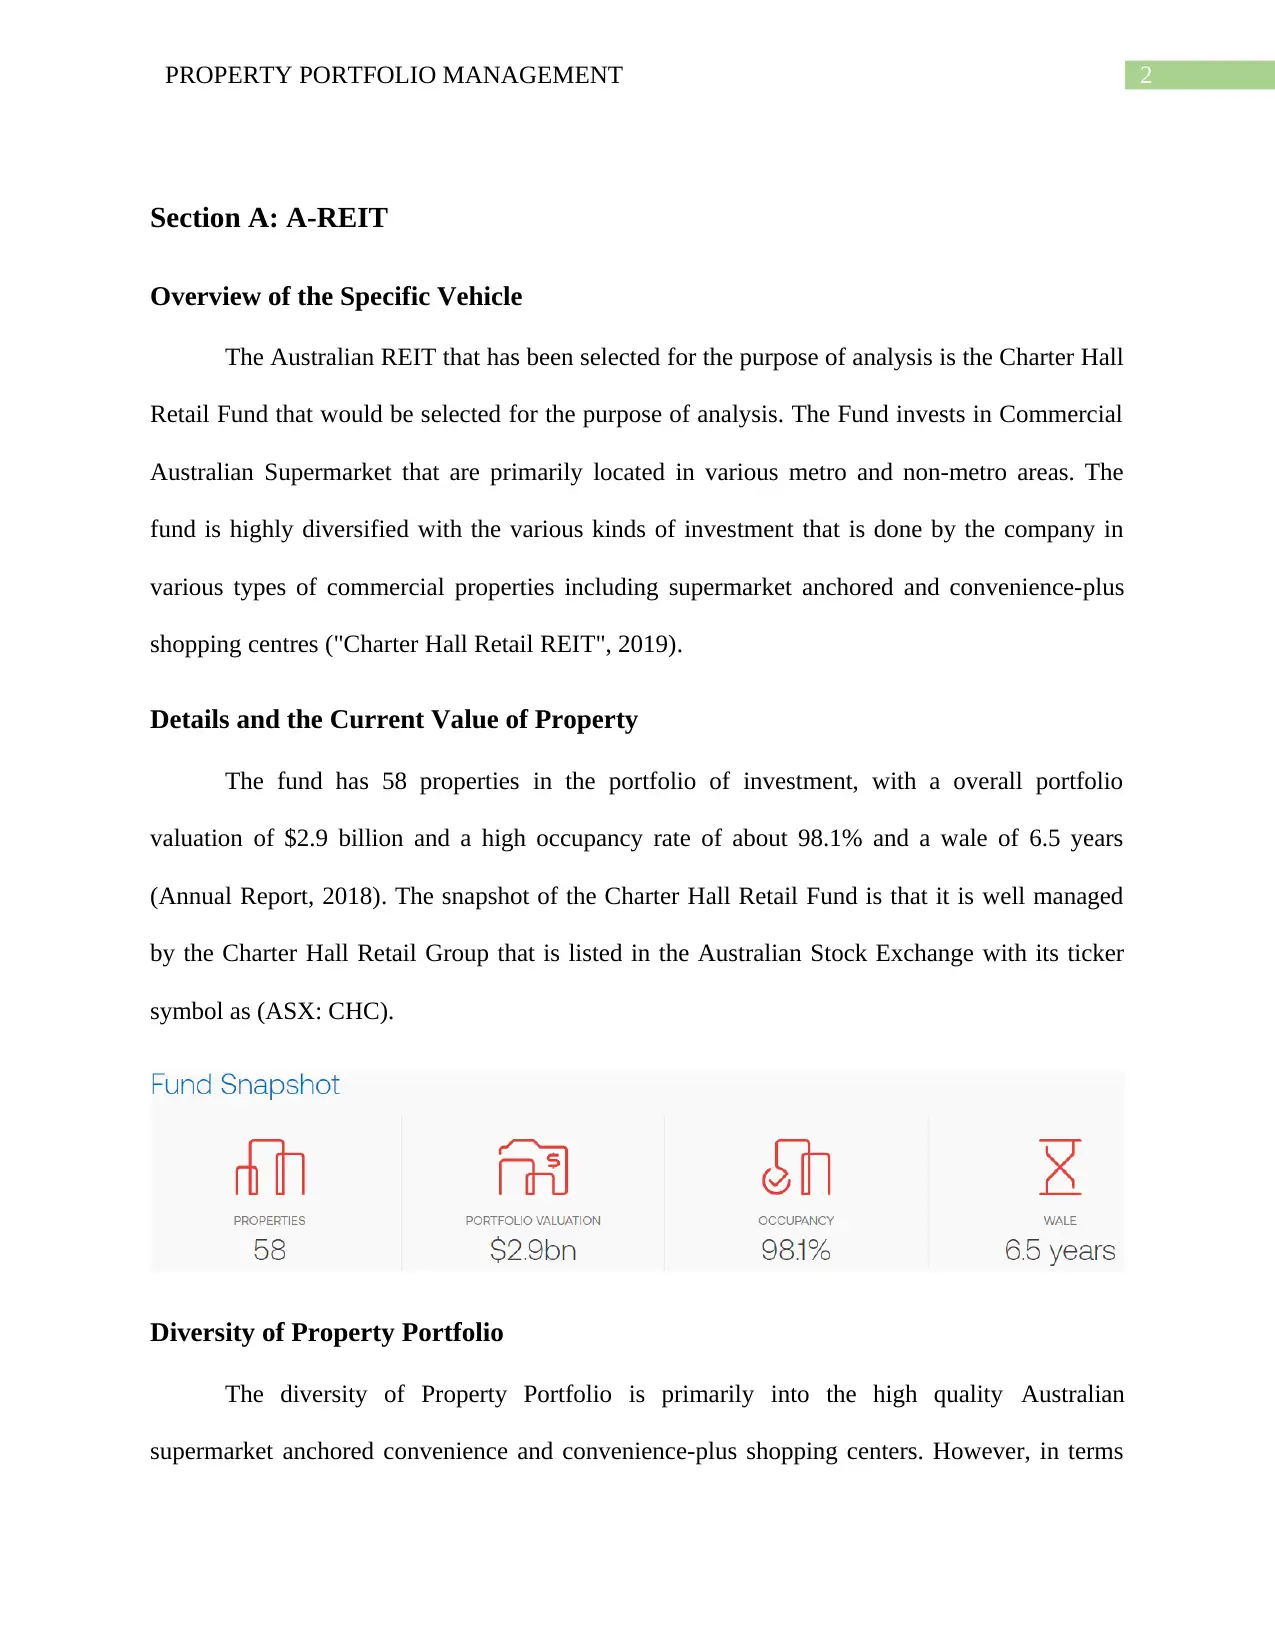
The fund has 58 properties in the portfolio of investment, with a overall portfolio
valuation of $2.9 billion and a high occupancy rate of about 98.1% and a wale of 6.5 years
(Annual Report, 2018). The snapshot of the Charter Hall Retail Fund is that it is well managed
by the Charter Hall Retail Group that is listed in the Australian Stock Exchange with its ticker
symbol as (ASX: CHC).
Diversity of Property Portfolio
The diversity of Property Portfolio is primarily into the high quality Australian
supermarket anchored convenience and convenience-plus shopping centers. However, in terms
Section A: A-REIT
Overview of the Specific Vehicle
The Australian REIT that has been selected for the purpose of analysis is the Charter Hall
Retail Fund that would be selected for the purpose of analysis. The Fund invests in Commercial
Australian Supermarket that are primarily located in various metro and non-metro areas. The
fund is highly diversified with the various kinds of investment that is done by the company in
various types of commercial properties including supermarket anchored and convenience-plus
shopping centres ("Charter Hall Retail REIT", 2019).
Details and the Current Value of Property
The fund has 58 properties in the portfolio of investment, with a overall portfolio
valuation of $2.9 billion and a high occupancy rate of about 98.1% and a wale of 6.5 years
(Annual Report, 2018). The snapshot of the Charter Hall Retail Fund is that it is well managed
by the Charter Hall Retail Group that is listed in the Australian Stock Exchange with its ticker
symbol as (ASX: CHC).
Diversity of Property Portfolio
The diversity of Property Portfolio is primarily into the high quality Australian
supermarket anchored convenience and convenience-plus shopping centers. However, in terms
3PROPERTY PORTFOLIO MANAGEMENT
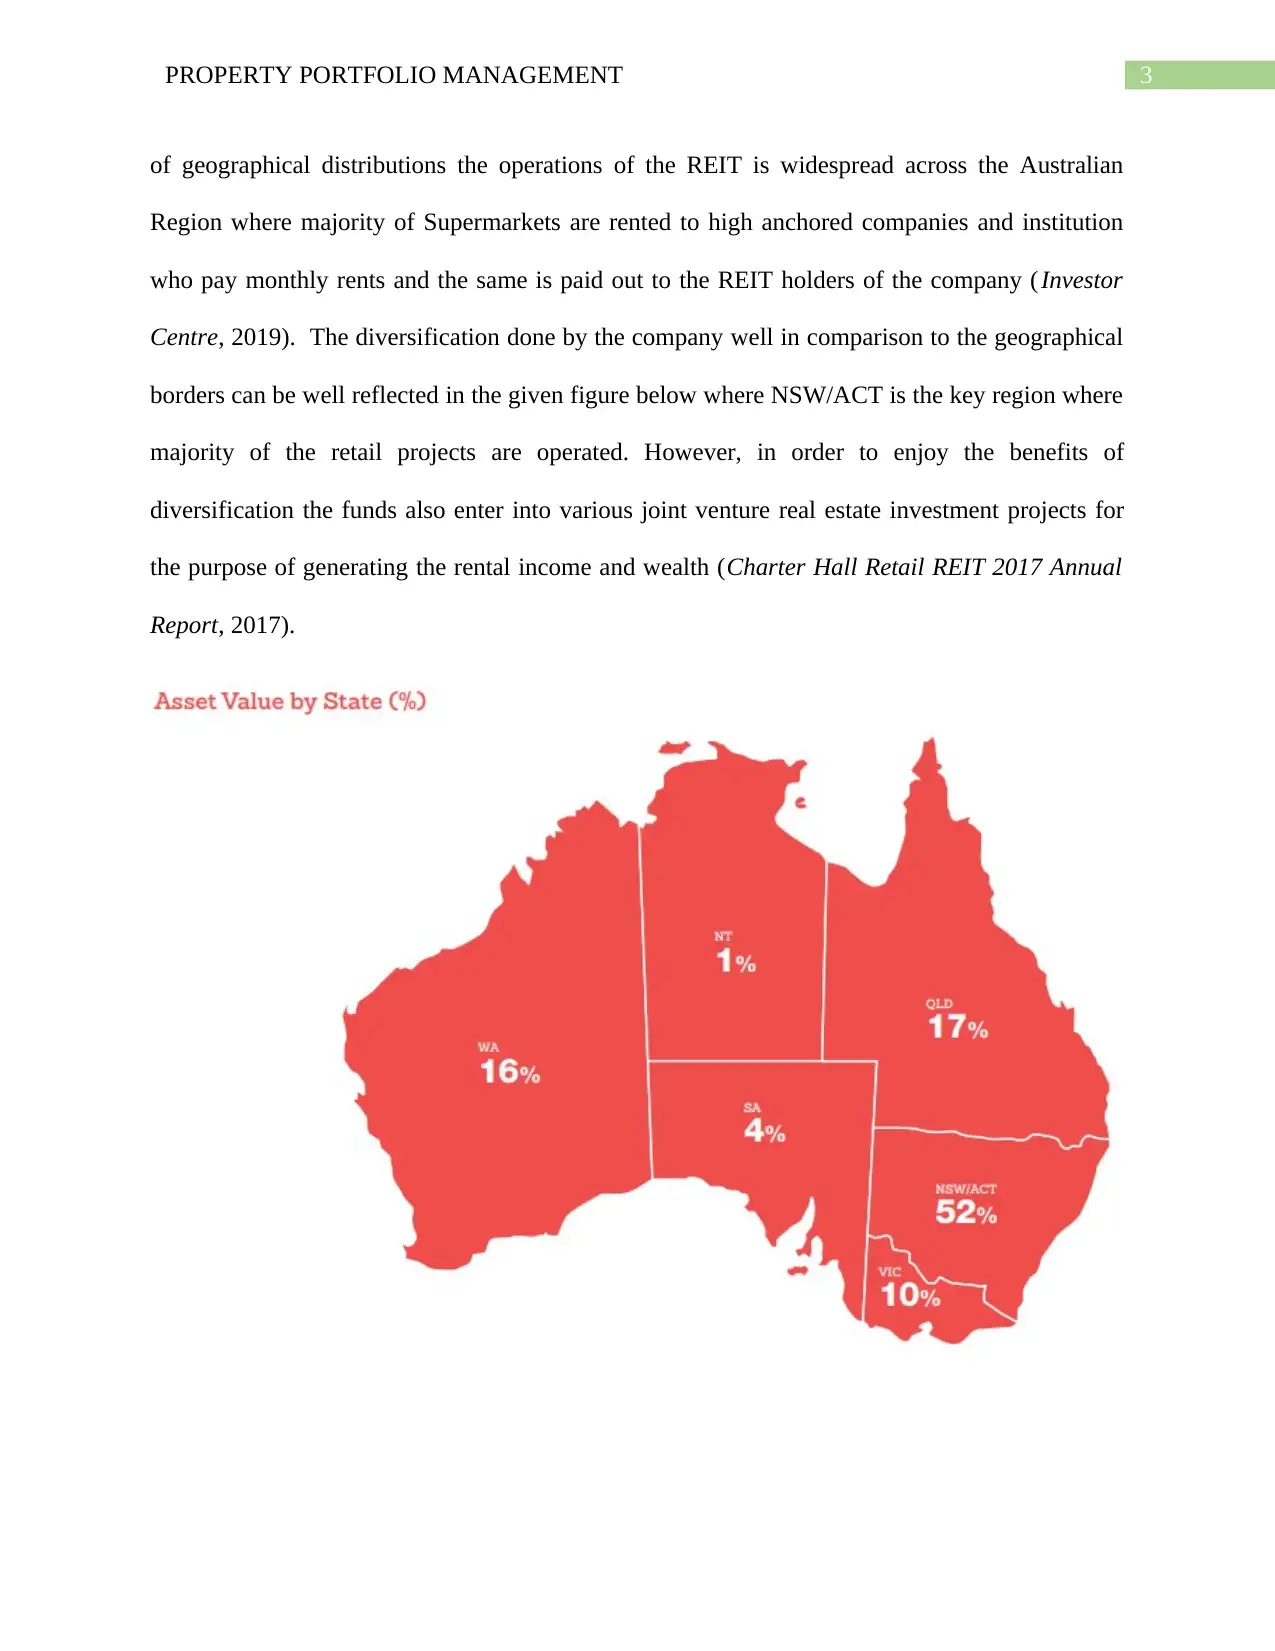
of geographical distributions the operations of the REIT is widespread across the Australian
Region where majority of Supermarkets are rented to high anchored companies and institution
who pay monthly rents and the same is paid out to the REIT holders of the company (Investor
Centre, 2019). The diversification done by the company well in comparison to the geographical
borders can be well reflected in the given figure below where NSW/ACT is the key region where
majority of the retail projects are operated. However, in order to enjoy the benefits of
diversification the funds also enter into various joint venture real estate investment projects for
the purpose of generating the rental income and wealth (Charter Hall Retail REIT 2017 Annual
Report, 2017).
Secure Best Marks with AI Grader
Need help grading? Try our AI Grader for instant feedback on your assignments.
4PROPERTY PORTFOLIO MANAGEMENT
Risk Management Strategy
The activities carried out by the REIT funds exposes the fund to numerous and various
types of risks particularly in the field of market risk, credit risk and liquidity risk. The risk
management plan drawn out by the fund well covers about the framework policy carried out by
the Fund for better management of risk and stabilized performance of investment returns.
Capital Risk Management: The capital risk management done by the com pany is done
prudently by the company whereby the REIT’s resilient portfolio is aligned with the
interest of the fund management done (Annual Report, 2017). The sourcing of the finance
is done by the REIT through debt financing from various International and Local Bond
Market along with the US Private Placement Bond Market and from the Equity Markets.
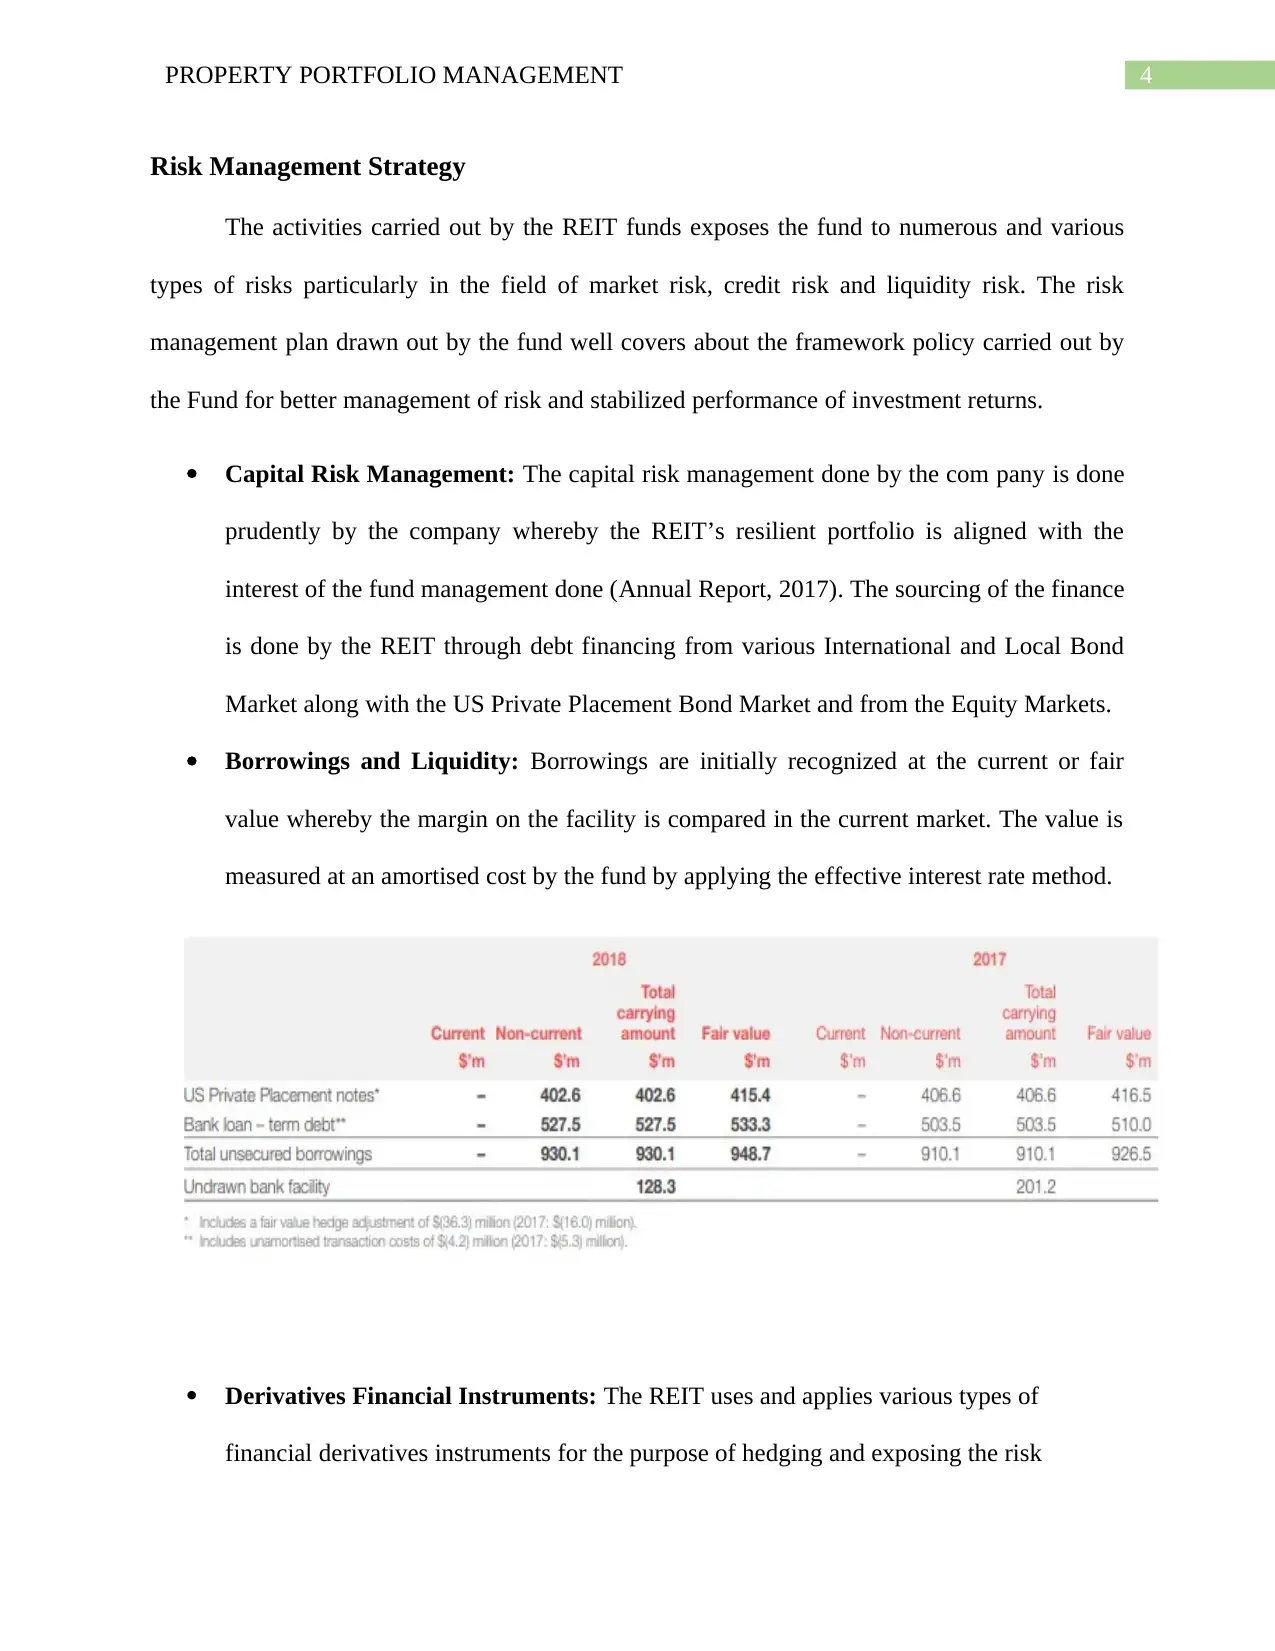
Borrowings and Liquidity: Borrowings are initially recognized at the current or fair
value whereby the margin on the facility is compared in the current market. The value is
measured at an amortised cost by the fund by applying the effective interest rate method.
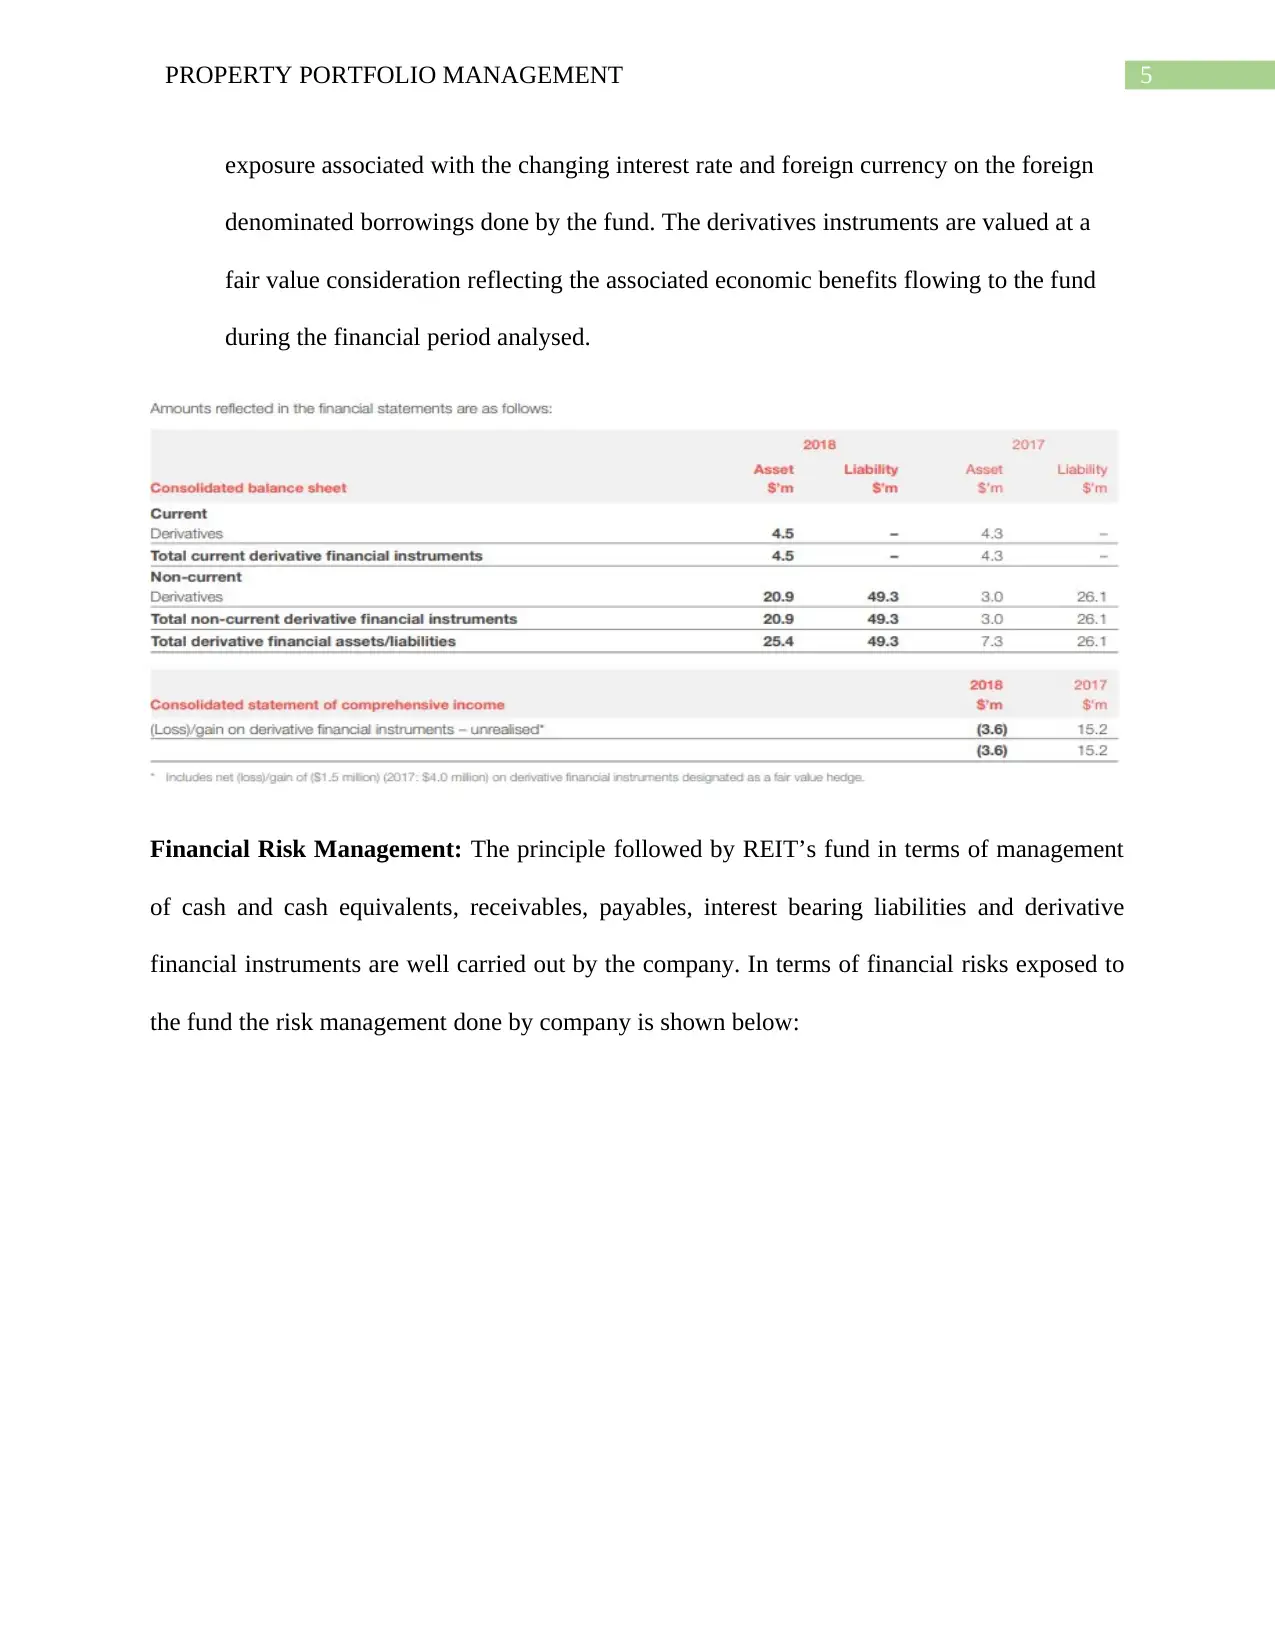
Derivatives Financial Instruments: The REIT uses and applies various types of
financial derivatives instruments for the purpose of hedging and exposing the risk
Risk Management Strategy
The activities carried out by the REIT funds exposes the fund to numerous and various
types of risks particularly in the field of market risk, credit risk and liquidity risk. The risk
management plan drawn out by the fund well covers about the framework policy carried out by
the Fund for better management of risk and stabilized performance of investment returns.
Capital Risk Management: The capital risk management done by the com pany is done
prudently by the company whereby the REIT’s resilient portfolio is aligned with the
interest of the fund management done (Annual Report, 2017). The sourcing of the finance
is done by the REIT through debt financing from various International and Local Bond
Market along with the US Private Placement Bond Market and from the Equity Markets.
Borrowings and Liquidity: Borrowings are initially recognized at the current or fair
value whereby the margin on the facility is compared in the current market. The value is
measured at an amortised cost by the fund by applying the effective interest rate method.
Derivatives Financial Instruments: The REIT uses and applies various types of
financial derivatives instruments for the purpose of hedging and exposing the risk
5PROPERTY PORTFOLIO MANAGEMENT
exposure associated with the changing interest rate and foreign currency on the foreign
denominated borrowings done by the fund. The derivatives instruments are valued at a
fair value consideration reflecting the associated economic benefits flowing to the fund
during the financial period analysed.
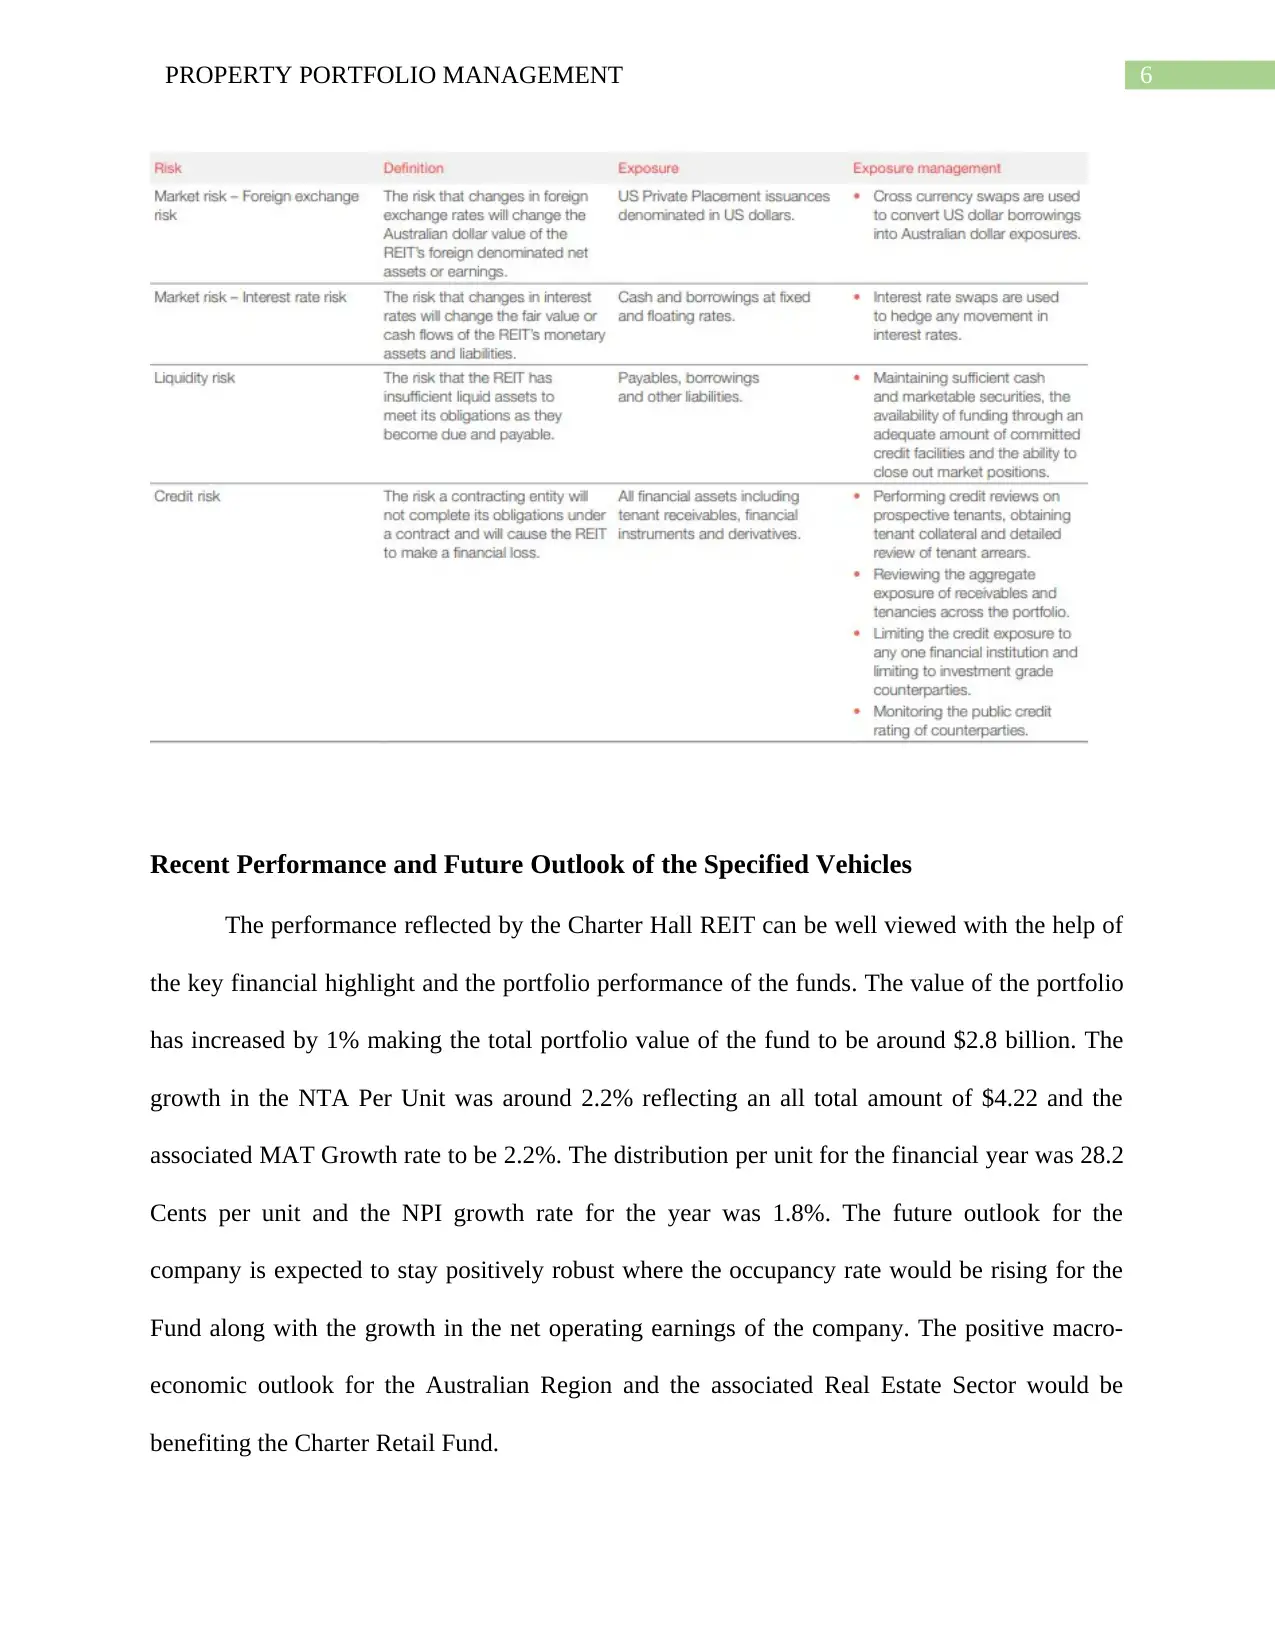
Financial Risk Management: The principle followed by REIT’s fund in terms of management
of cash and cash equivalents, receivables, payables, interest bearing liabilities and derivative
financial instruments are well carried out by the company. In terms of financial risks exposed to
the fund the risk management done by company is shown below:
exposure associated with the changing interest rate and foreign currency on the foreign
denominated borrowings done by the fund. The derivatives instruments are valued at a
fair value consideration reflecting the associated economic benefits flowing to the fund
during the financial period analysed.
Financial Risk Management: The principle followed by REIT’s fund in terms of management
of cash and cash equivalents, receivables, payables, interest bearing liabilities and derivative
financial instruments are well carried out by the company. In terms of financial risks exposed to
the fund the risk management done by company is shown below:
6PROPERTY PORTFOLIO MANAGEMENT
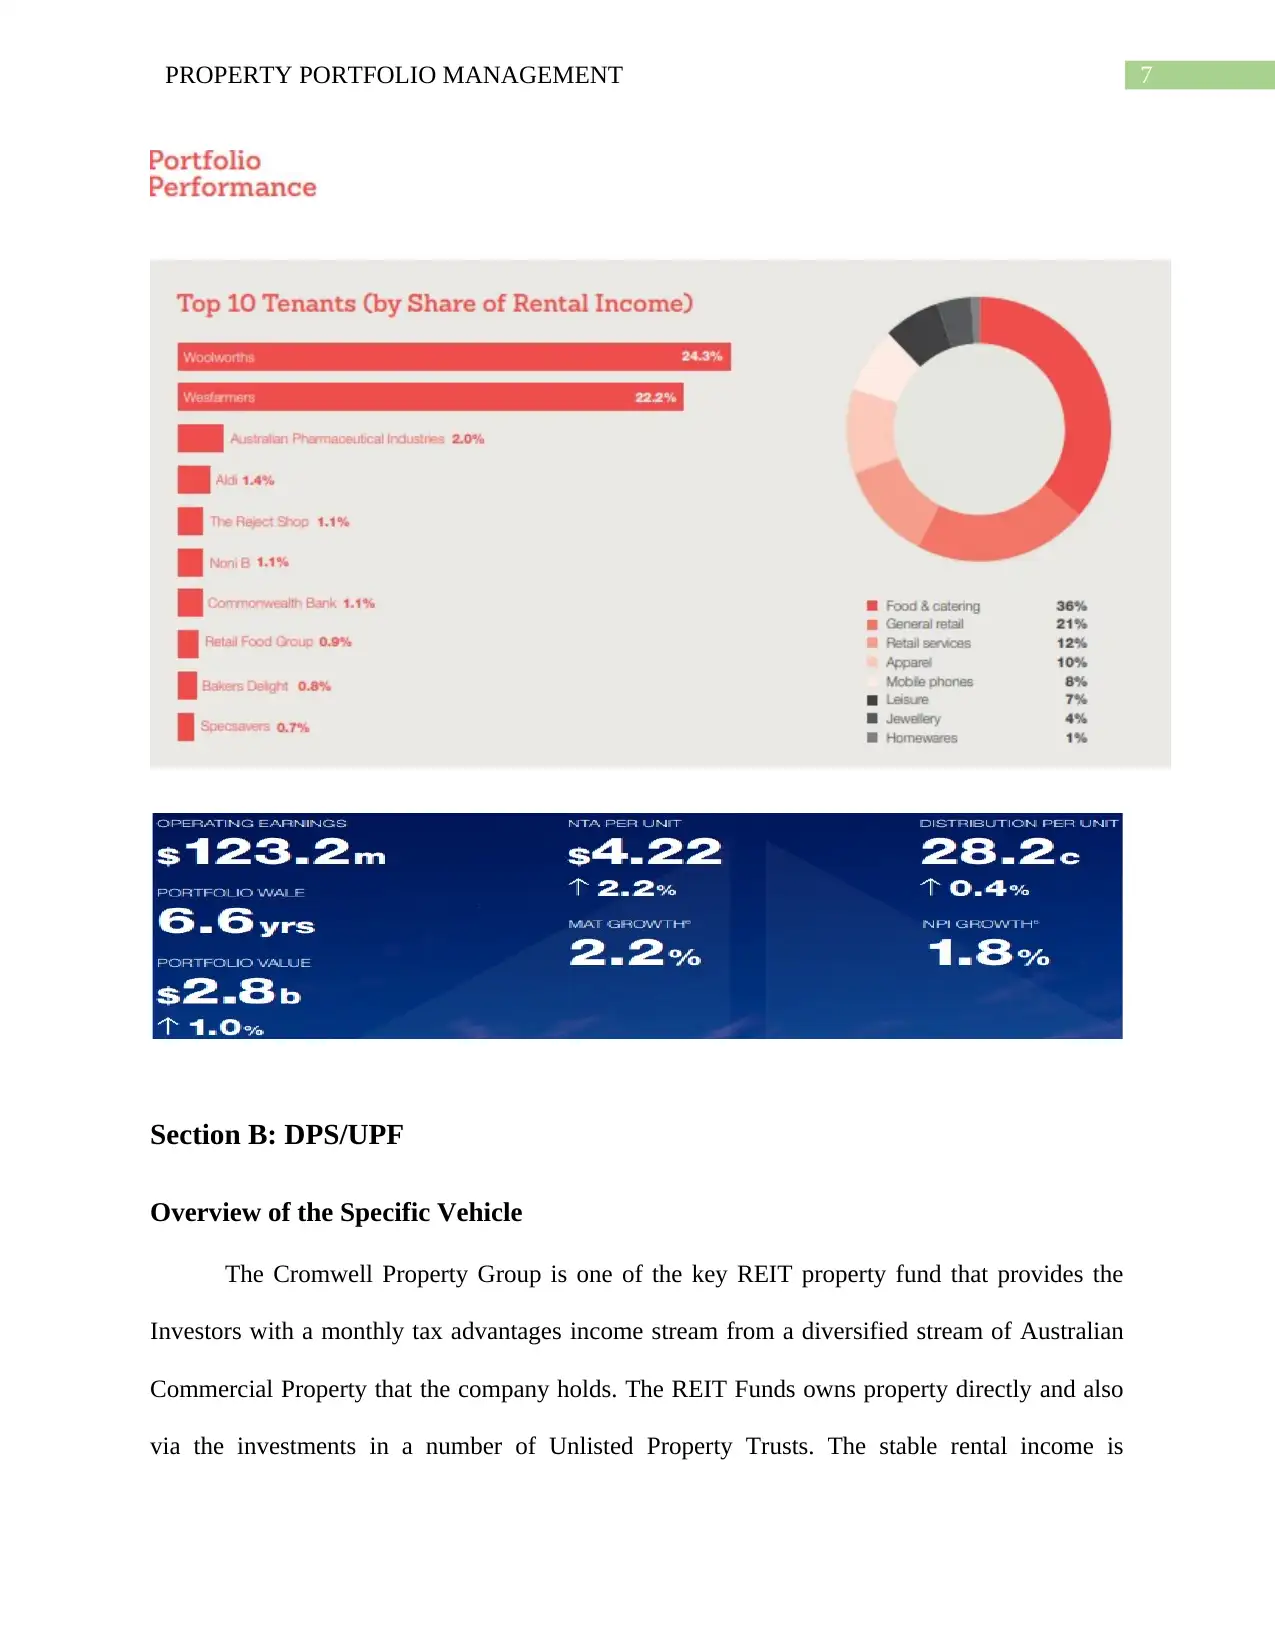
Recent Performance and Future Outlook of the Specified Vehicles
The performance reflected by the Charter Hall REIT can be well viewed with the help of
the key financial highlight and the portfolio performance of the funds. The value of the portfolio
has increased by 1% making the total portfolio value of the fund to be around $2.8 billion. The
growth in the NTA Per Unit was around 2.2% reflecting an all total amount of $4.22 and the
associated MAT Growth rate to be 2.2%. The distribution per unit for the financial year was 28.2
Cents per unit and the NPI growth rate for the year was 1.8%. The future outlook for the
company is expected to stay positively robust where the occupancy rate would be rising for the
Fund along with the growth in the net operating earnings of the company. The positive macro-
economic outlook for the Australian Region and the associated Real Estate Sector would be
benefiting the Charter Retail Fund.
Paraphrase This Document
Need a fresh take? Get an instant paraphrase of this document with our AI Paraphraser
7PROPERTY PORTFOLIO MANAGEMENT
Section B: DPS/UPF
Overview of the Specific Vehicle
The Cromwell Property Group is one of the key REIT property fund that provides the
Investors with a monthly tax advantages income stream from a diversified stream of Australian
Commercial Property that the company holds. The REIT Funds owns property directly and also
via the investments in a number of Unlisted Property Trusts. The stable rental income is
8PROPERTY PORTFOLIO MANAGEMENT
predominantly generated from the Blue-Chip and Government Tenants (Cromwell Direct
Property Fund - Cromwell Australia, 2019).
Details and the Current Value of Property
The fund currently delivers diversification across the various ten properties that are
located throughout the Queensland, Victoria, South Australia and Australian Capital Territory.
The current value of the property is around $1.26 million (Investment Centre, 2019). The fund
helps the REIT investors in providing exposures to the property throughout Australia either
directly or through the investments in many unlisted property funds. The distributed amount that
has been paid by the Fund will be around 7.25 Cents per Unit and the Unit Price is around 1.255.
Diversity of Property Portfolio
The REIT Funds owns property directly and also via the investments in a number of
Unlisted Property Trusts. The fund currently delivers diversification across the various ten
properties that are located throughout the Queensland, Victoria, South Australia and Australian
Capital Territory. Diversification is well insured by the Fund with the help of the Direct Property
and Property Trusts that the fund currently has in the portfolio (Annual Report, 2018). Of the
Total 100% the fund currently has 51% of the total net asset value invested in Direct property
and Property Trust having 36% of the total invested capital and Cash Containing a total of 13%
who bifurcation is as below:
Direct Property Fund (51%)
a) 64 Allara Street, Canberra – 12%
(b) Parafield Retail Complex, Adelaide – 19%
(c) Bunnings Munno Para West, South Australia - 20%
9PROPERTY PORTFOLIO MANAGEMENT
Property Trust (36%)
(a) Cromwell Riverpark Trust – 23%
(b) Cromwell Ipswich City Heart Trust – 4%
(c) Cromwell Property Trust 12 – 9%
Cash and Cash Equivalents (13%)
Risk Management Strategy
The Cromwell Direct Property Fund aims to manage a set of risk with the help of risk
management framework that is well carried out by the company in response to the property fund
it currently is invested. Some of the key risks that the fund will be looking for is the
Diversification Risk where smaller amount of investments are invested in order to reduce the
overall risk due to changes in market conditions. Property Risks and Fund Risk on the other
hand, are well carried out by the companied well effectively by the Fund with the help of various
management policies developed. The REIT uses and applies various types of financial
derivatives instruments for the purpose of hedging and exposing the risk exposure associated
with the changing interest rate and foreign currency on the foreign denominated borrowings done
by the fund. The derivatives instruments are valued at a fair value consideration reflecting the
associated economic benefits flowing to the fund during the financial period analysed.
Recent Performance and Future Outlook of the Specified Vehicles
Secure Best Marks with AI Grader
Need help grading? Try our AI Grader for instant feedback on your assignments.
10PROPERTY PORTFOLIO MANAGEMENT
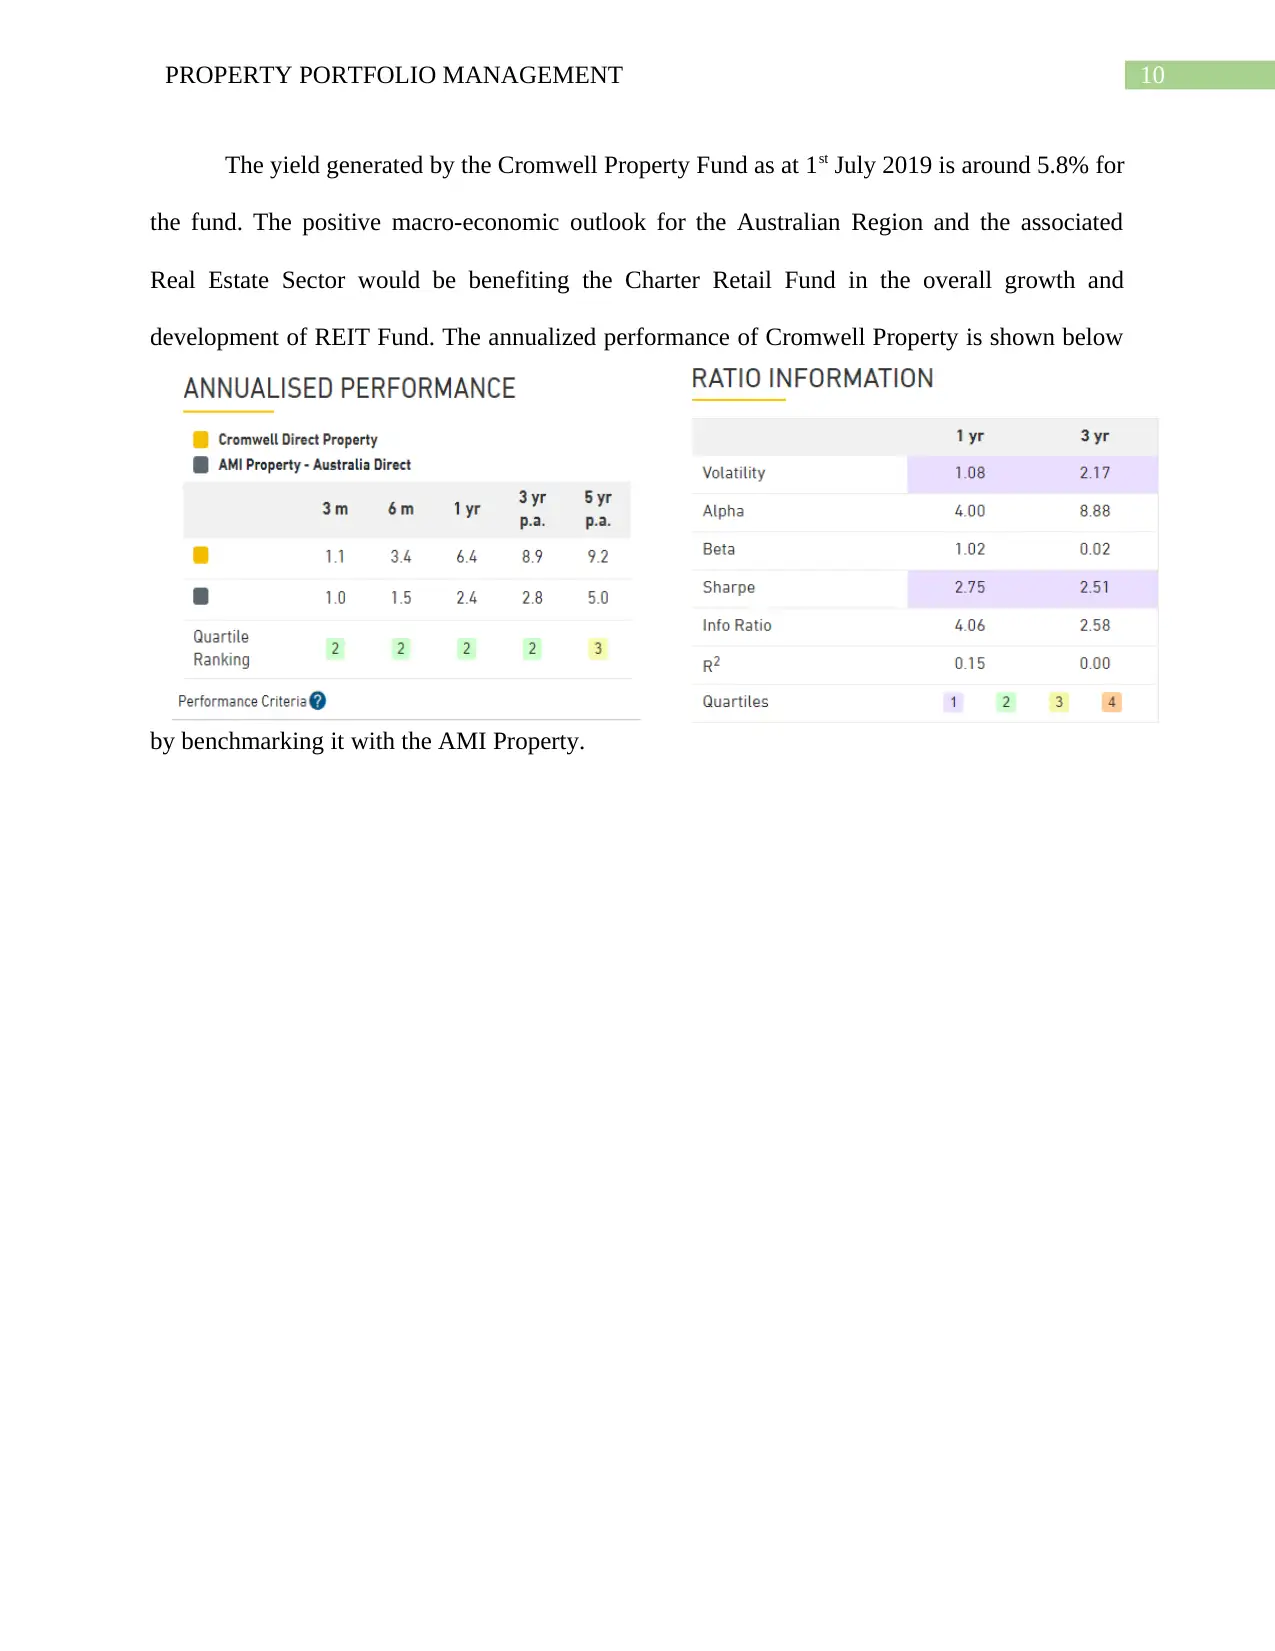
The yield generated by the Cromwell Property Fund as at 1st July 2019 is around 5.8% for
the fund. The positive macro-economic outlook for the Australian Region and the associated
Real Estate Sector would be benefiting the Charter Retail Fund in the overall growth and
development of REIT Fund. The annualized performance of Cromwell Property is shown below
by benchmarking it with the AMI Property.
11PROPERTY PORTFOLIO MANAGEMENT
References
"Charter Hall Retail REIT". 2019. Corporate. Accessed August 28 2019.
https://www.charterhall.com.au/investments/funds/charter-hall-retail-reit.
Annual Report (2018). Nrfinancial.com.au. Retrieved 28 August 2019, from
http://nrfinancial.com.au/document.php?id=479
Annual Report (2017). Charterhall.com.au. Retrieved 28 August 2019, from
https://www.charterhall.com.au/docs/librariesprovider2/fund-documents/results/cqr-
results/cqr-2017/cqr-2017-annual-report.pdf?sfvrsn=4de11e31_6
Annual Report (2018). Charterhall.com.au. Retrieved 28 August 2019, from
https://www.charterhall.com.au/docs/librariesprovider2/fund-documents/results/cqr-
results/cqr-2018/cqr-2018-annual-report.pdf?sfvrsn=db949d55_7
Charter Hall Retail REIT 2017 Annual Report. (2017). Corporate. Retrieved 28 August 2019,
from https://www.charterhall.com.au/News/news-article/2018/12/19/charter-hall-retail-
reit-annual-report-2017
Cromwell Direct Property Fund - Cromwell Australia. (2019). Cromwell.com.au. Retrieved 28
August 2019, from https://www.cromwell.com.au/investment-options/cromwell-direct-
property-fund
Investment Centre (2019). Investmentcentre.moneymanagement.com.au. Retrieved 28 August
2019, from https://investmentcentre.moneymanagement.com.au/factsheets/mi/kw2m/
cromwell-direct-property

12PROPERTY PORTFOLIO MANAGEMENT
Investor Centre. (2019). Corporate. Retrieved 28 August 2019, from
https://www.charterhall.com.au/investments/funds/charter-hall-retail-reit/investor-
centre#Analyst_Information
Investor Centre. (2019). Corporate. Retrieved 28 August 2019, from
https://www.charterhall.com.au/investments/funds/charter-hall-retail-reit/investor-
centre#Analyst_Information
Paraphrase This Document
Need a fresh take? Get an instant paraphrase of this document with our AI Paraphraser
13PROPERTY PORTFOLIO MANAGEMENT
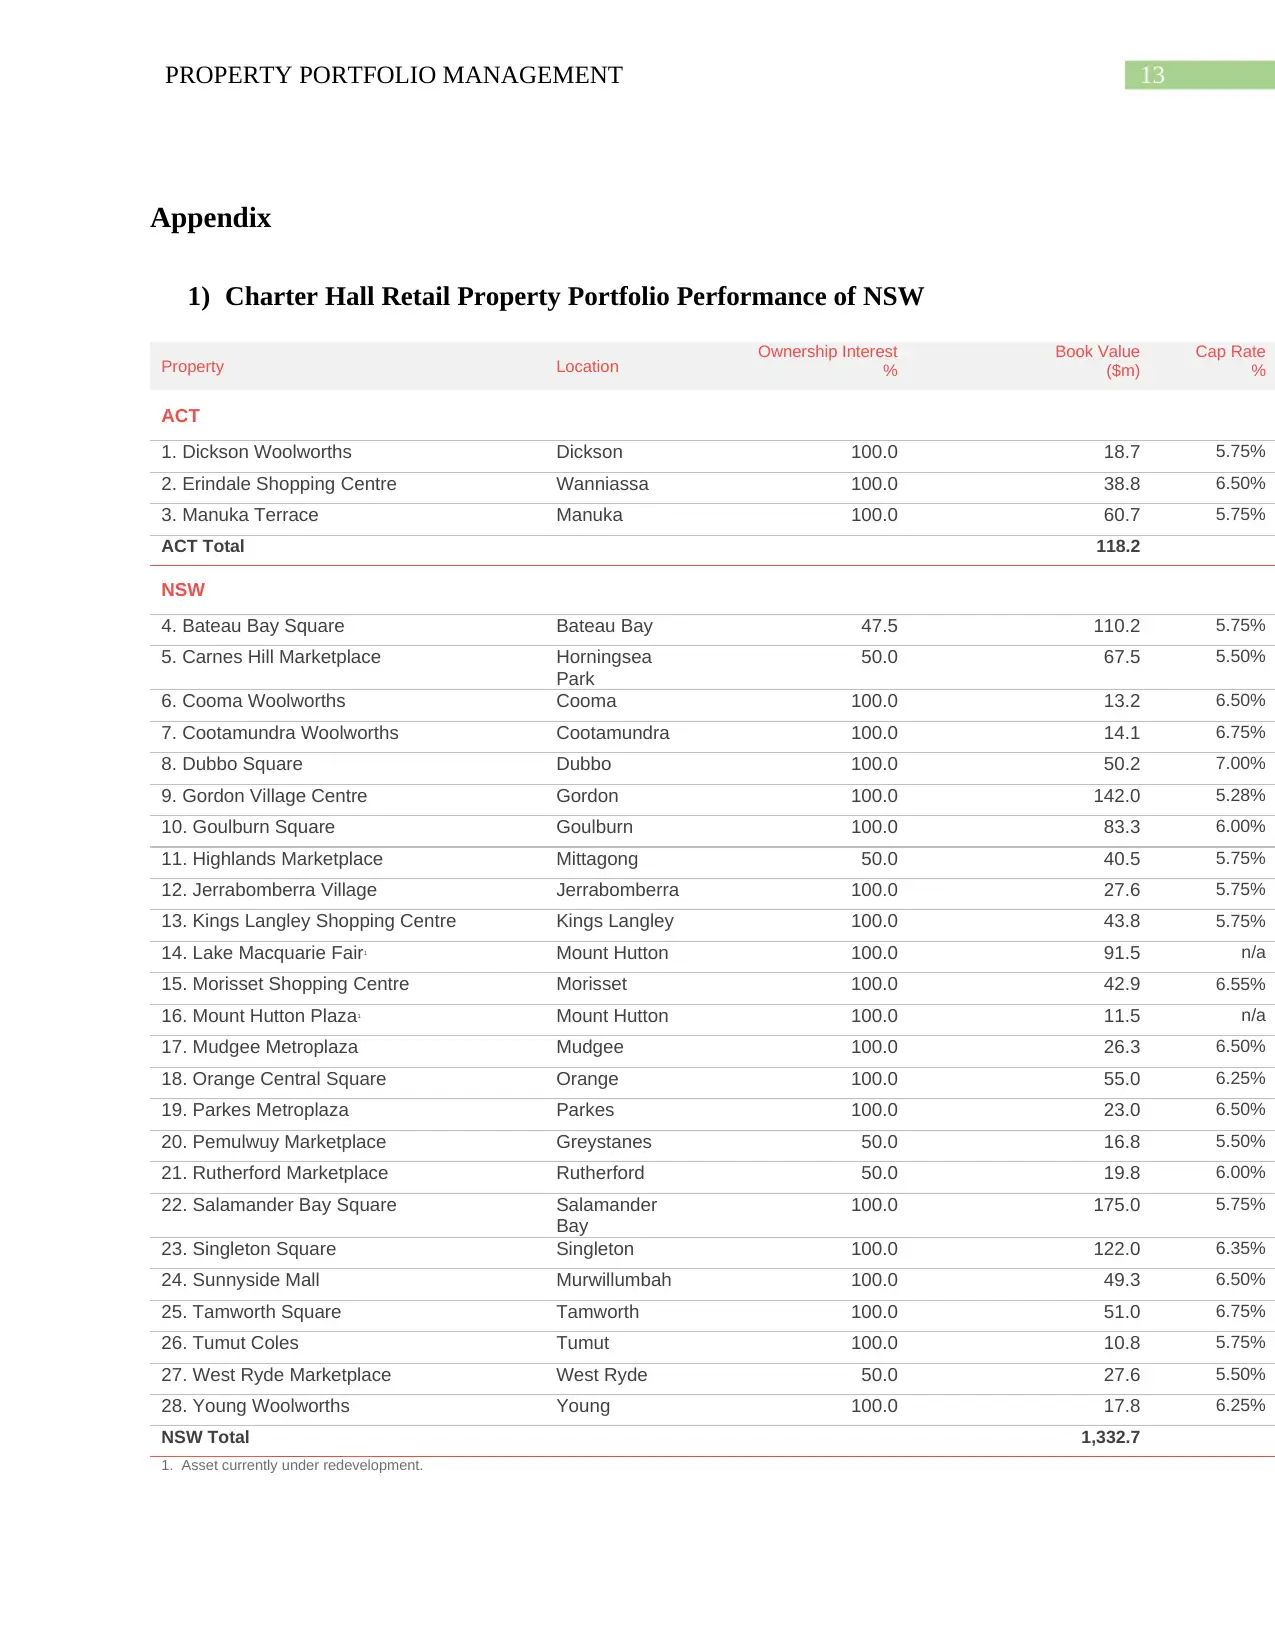
Appendix
1) Charter Hall Retail Property Portfolio Performance of NSW
Property Location Ownership Interest
%
Book Value
($m)
Cap Rate
%
ACT
1. Dickson Woolworths Dickson 100.0 18.7 5.75%
2. Erindale Shopping Centre Wanniassa 100.0 38.8 6.50%
3. Manuka Terrace Manuka 100.0 60.7 5.75%
ACT Total 118.2
NSW
4. Bateau Bay Square Bateau Bay 47.5 110.2 5.75%
5. Carnes Hill Marketplace Horningsea
Park
50.0 67.5 5.50%
6. Cooma Woolworths Cooma 100.0 13.2 6.50%
7. Cootamundra Woolworths Cootamundra 100.0 14.1 6.75%
8. Dubbo Square Dubbo 100.0 50.2 7.00%
9. Gordon Village Centre Gordon 100.0 142.0 5.28%
10. Goulburn Square Goulburn 100.0 83.3 6.00%
11. Highlands Marketplace Mittagong 50.0 40.5 5.75%
12. Jerrabomberra Village Jerrabomberra 100.0 27.6 5.75%
13. Kings Langley Shopping Centre Kings Langley 100.0 43.8 5.75%
14. Lake Macquarie Fair1 Mount Hutton 100.0 91.5 n/a
15. Morisset Shopping Centre Morisset 100.0 42.9 6.55%
16. Mount Hutton Plaza1 Mount Hutton 100.0 11.5 n/a
17. Mudgee Metroplaza Mudgee 100.0 26.3 6.50%
18. Orange Central Square Orange 100.0 55.0 6.25%
19. Parkes Metroplaza Parkes 100.0 23.0 6.50%
20. Pemulwuy Marketplace Greystanes 50.0 16.8 5.50%
21. Rutherford Marketplace Rutherford 50.0 19.8 6.00%
22. Salamander Bay Square Salamander
Bay
100.0 175.0 5.75%
23. Singleton Square Singleton 100.0 122.0 6.35%
24. Sunnyside Mall Murwillumbah 100.0 49.3 6.50%
25. Tamworth Square Tamworth 100.0 51.0 6.75%
26. Tumut Coles Tumut 100.0 10.8 5.75%
27. West Ryde Marketplace West Ryde 50.0 27.6 5.50%
28. Young Woolworths Young 100.0 17.8 6.25%
NSW Total 1,332.7
1. Asset currently under redevelopment.
14PROPERTY PORTFOLIO MANAGEMENT
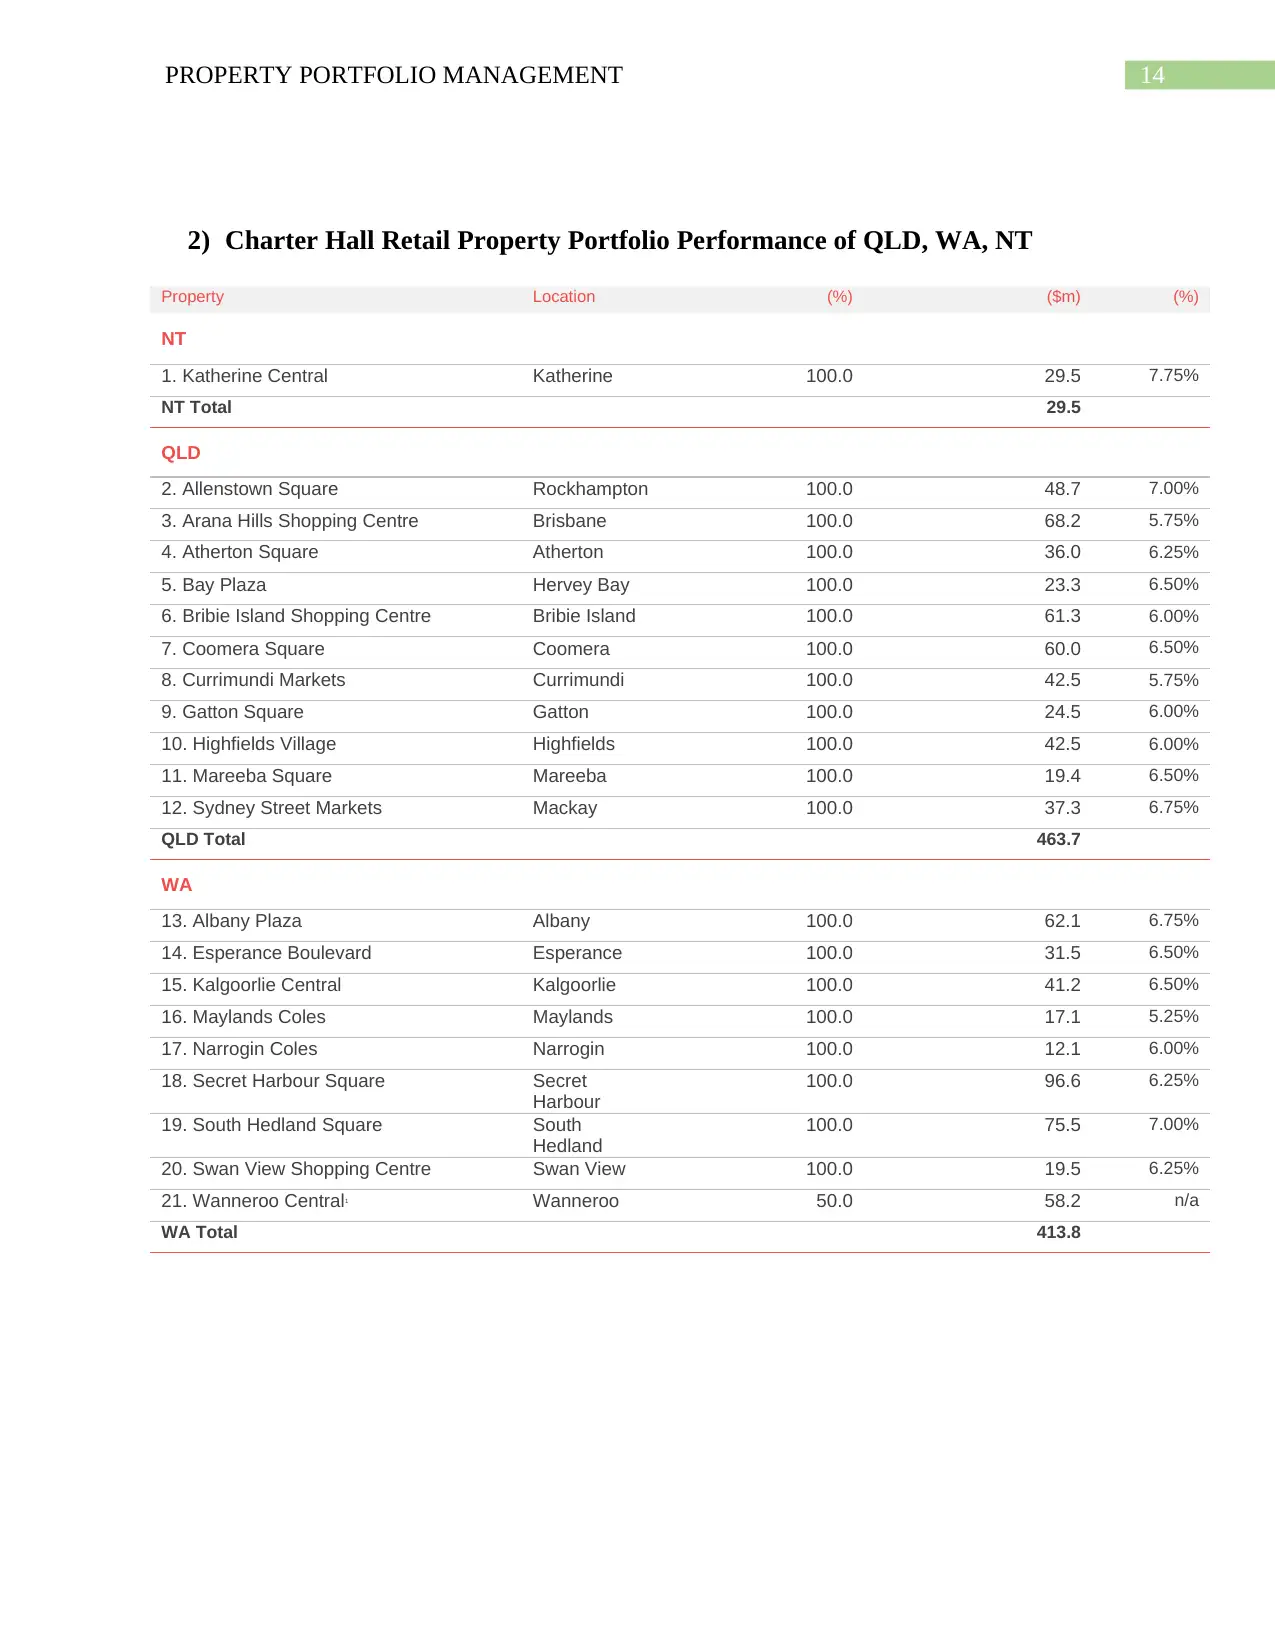
2) Charter Hall Retail Property Portfolio Performance of QLD, WA, NT
Property Location (%) ($m) (%)
NT
1. Katherine Central Katherine 100.0 29.5 7.75%
NT Total 29.5
QLD
2. Allenstown Square Rockhampton 100.0 48.7 7.00%
3. Arana Hills Shopping Centre Brisbane 100.0 68.2 5.75%
4. Atherton Square Atherton 100.0 36.0 6.25%
5. Bay Plaza Hervey Bay 100.0 23.3 6.50%
6. Bribie Island Shopping Centre Bribie Island 100.0 61.3 6.00%
7. Coomera Square Coomera 100.0 60.0 6.50%
8. Currimundi Markets Currimundi 100.0 42.5 5.75%
9. Gatton Square Gatton 100.0 24.5 6.00%
10. Highfields Village Highfields 100.0 42.5 6.00%
11. Mareeba Square Mareeba 100.0 19.4 6.50%
12. Sydney Street Markets Mackay 100.0 37.3 6.75%
QLD Total 463.7
WA
13. Albany Plaza Albany 100.0 62.1 6.75%
14. Esperance Boulevard Esperance 100.0 31.5 6.50%
15. Kalgoorlie Central Kalgoorlie 100.0 41.2 6.50%
16. Maylands Coles Maylands 100.0 17.1 5.25%
17. Narrogin Coles Narrogin 100.0 12.1 6.00%
18. Secret Harbour Square Secret
Harbour
100.0 96.6 6.25%
19. South Hedland Square South
Hedland
100.0 75.5 7.00%
20. Swan View Shopping Centre Swan View 100.0 19.5 6.25%
21. Wanneroo Central1 Wanneroo 50.0 58.2 n/a
WA Total 413.8
15PROPERTY PORTFOLIO MANAGEMENT
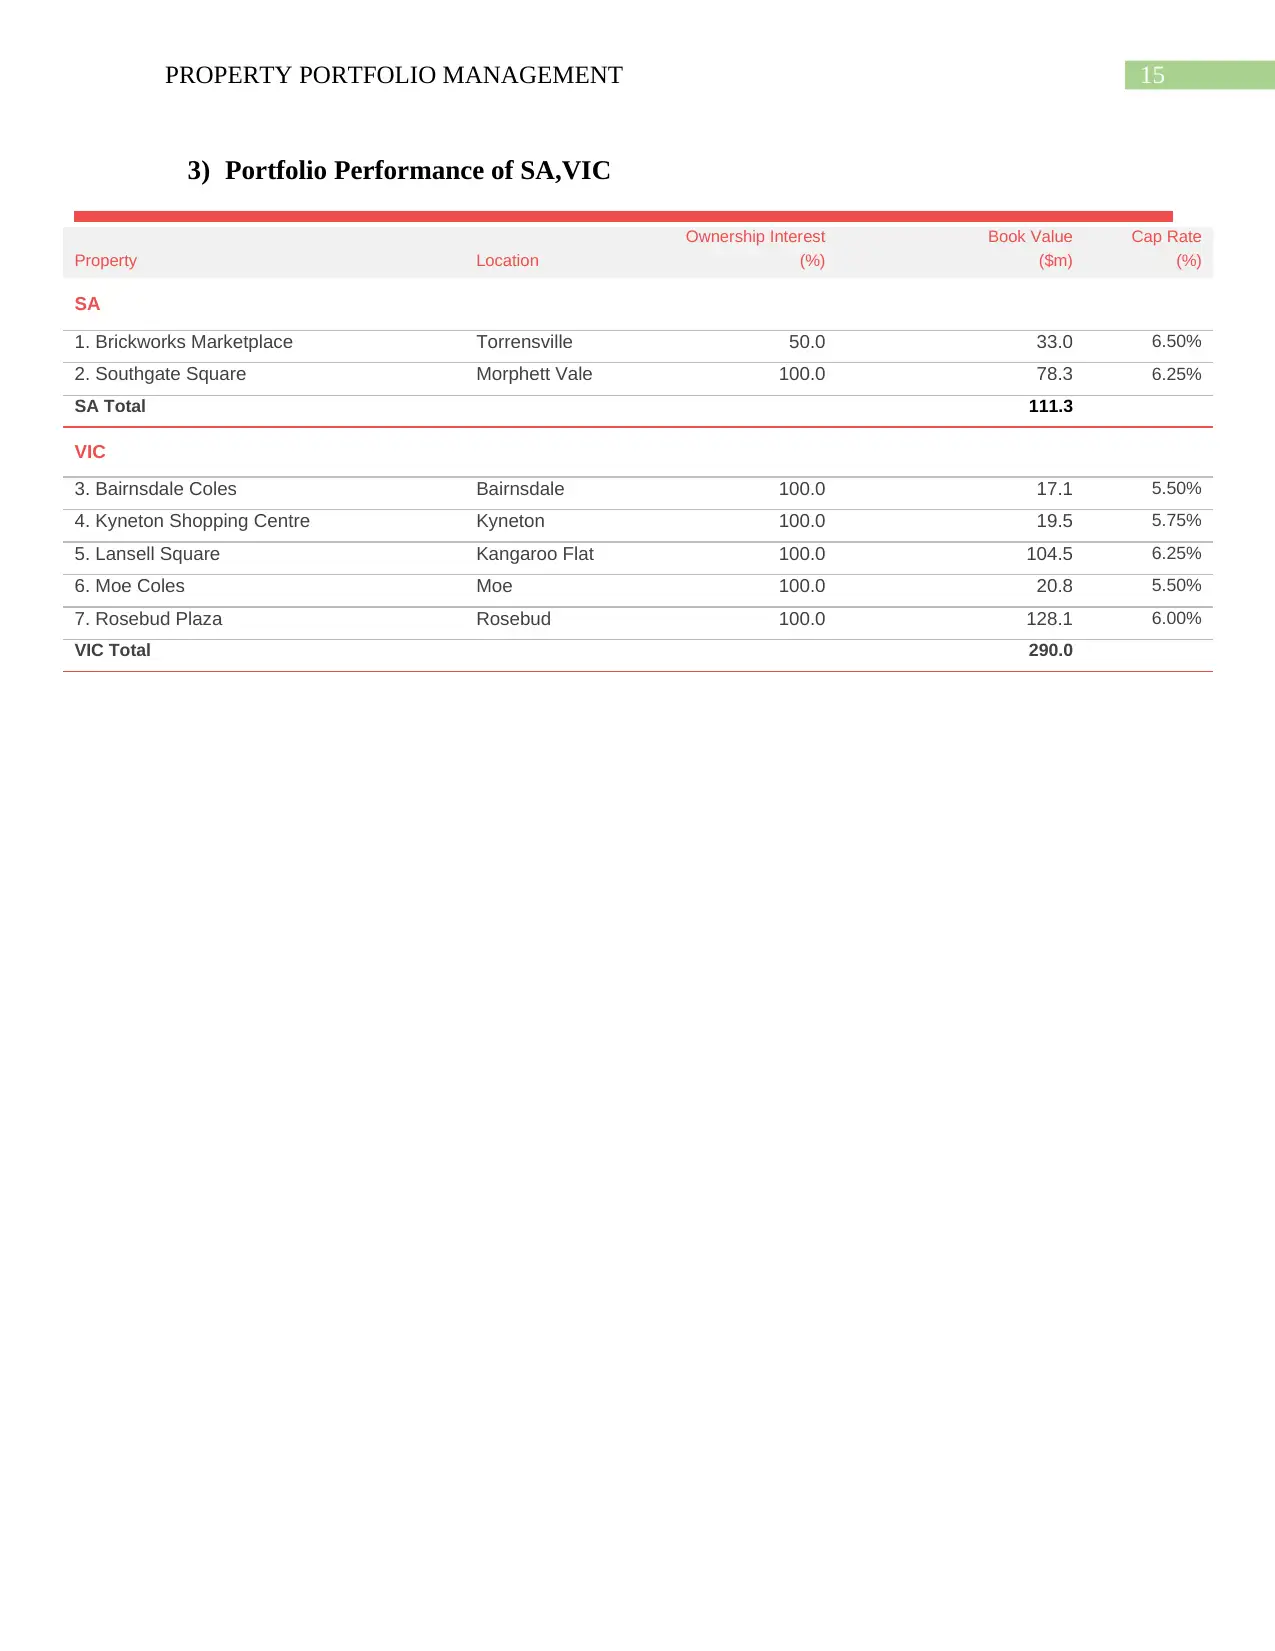
3) Portfolio Performance of SA,VIC
Ownership Interest Book Value Cap Rate
Property Location (%) ($m) (%)
SA
1. Brickworks Marketplace Torrensville 50.0 33.0 6.50%
2. Southgate Square Morphett Vale 100.0 78.3 6.25%
SA Total 111.3
VIC
3. Bairnsdale Coles Bairnsdale 100.0 17.1 5.50%
4. Kyneton Shopping Centre Kyneton 100.0 19.5 5.75%
5. Lansell Square Kangaroo Flat 100.0 104.5 6.25%
6. Moe Coles Moe 100.0 20.8 5.50%
7. Rosebud Plaza Rosebud 100.0 128.1 6.00%
VIC Total 290.0
1 out of 16


Your All-in-One AI-Powered Toolkit for Academic Success.
+13062052269
info@desklib.com
Available 24*7 on WhatsApp / Email
![[object Object]](/_next/static/media/star-bottom.7253800d.svg)
Unlock your academic potential
© 2024 | Zucol Services PVT LTD | All rights reserved.