Data Analytics and Visualisation Project Report - PRT564
VerifiedAdded on 2021/09/10
|5
|2023
|220
Project
AI Summary
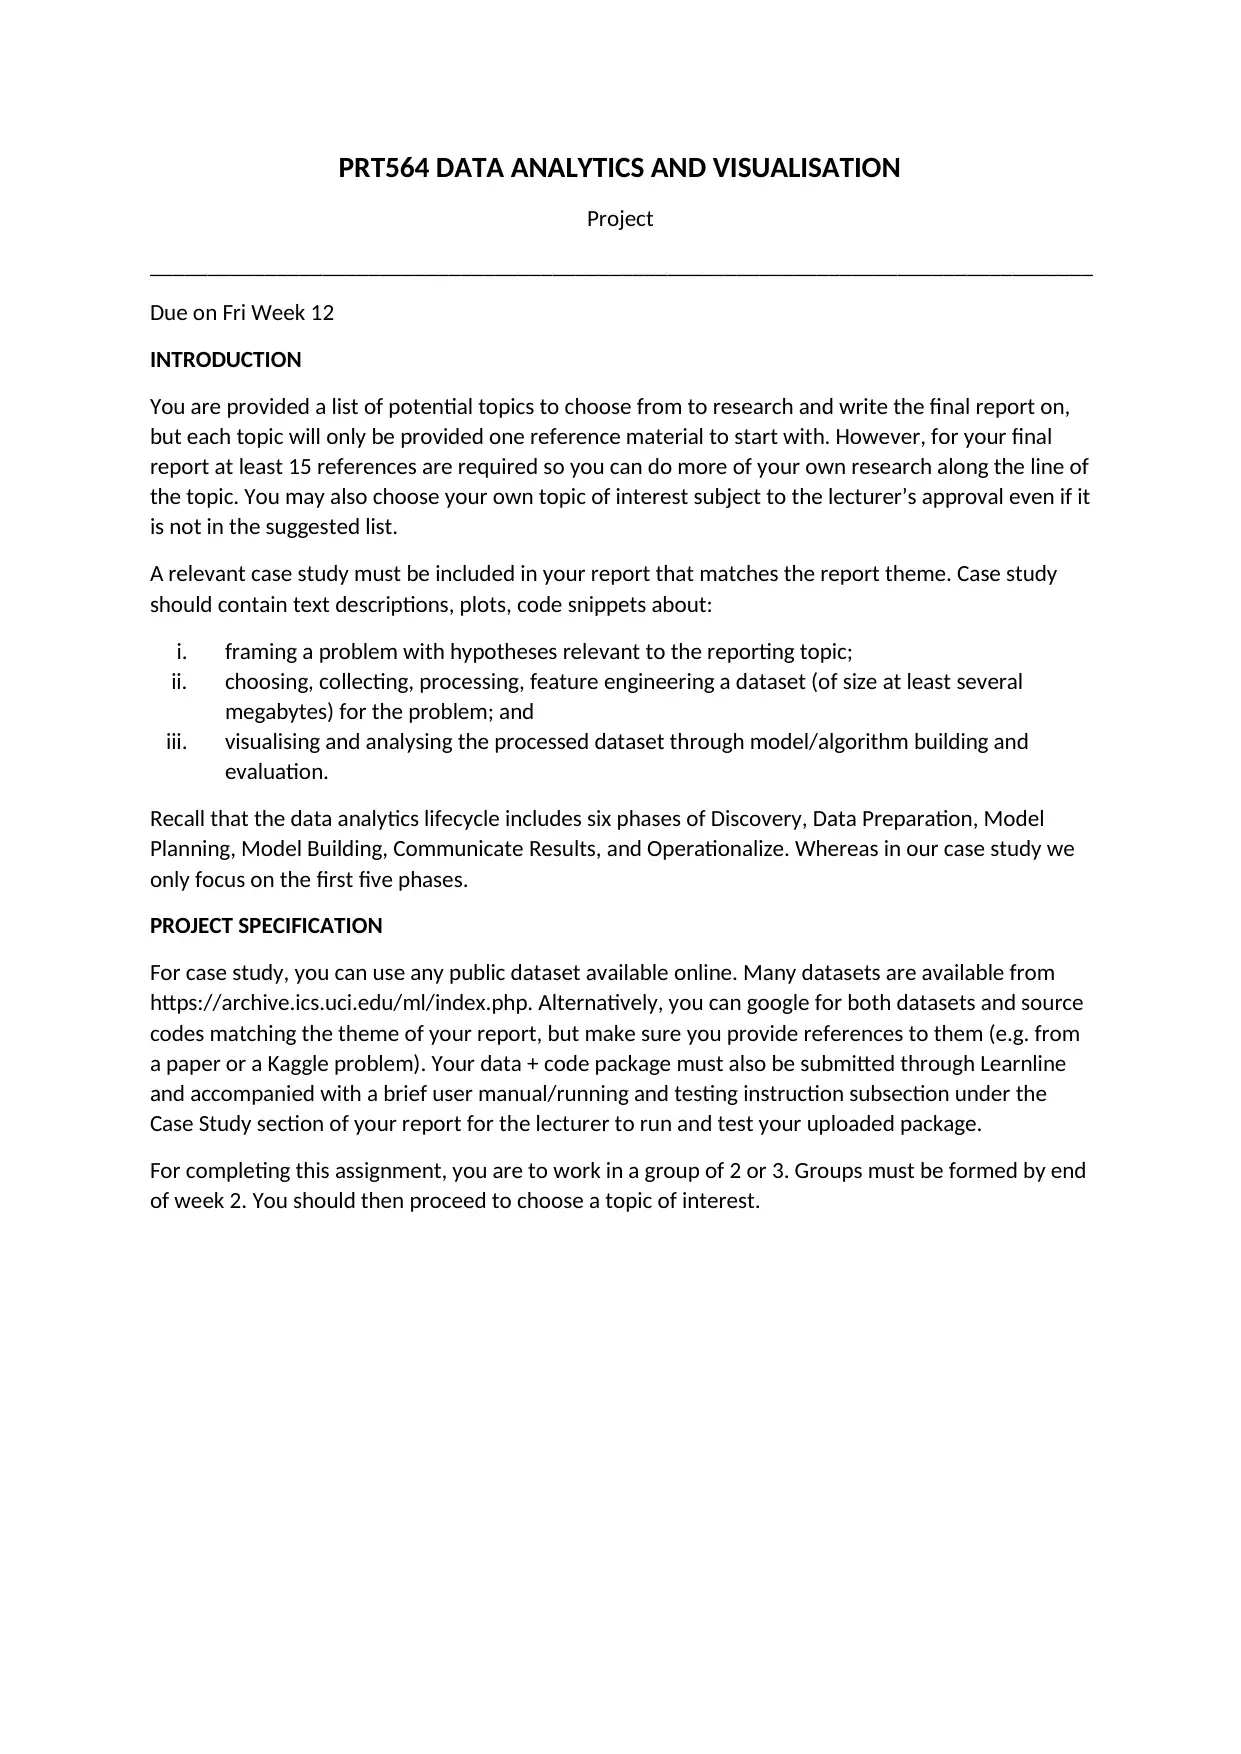
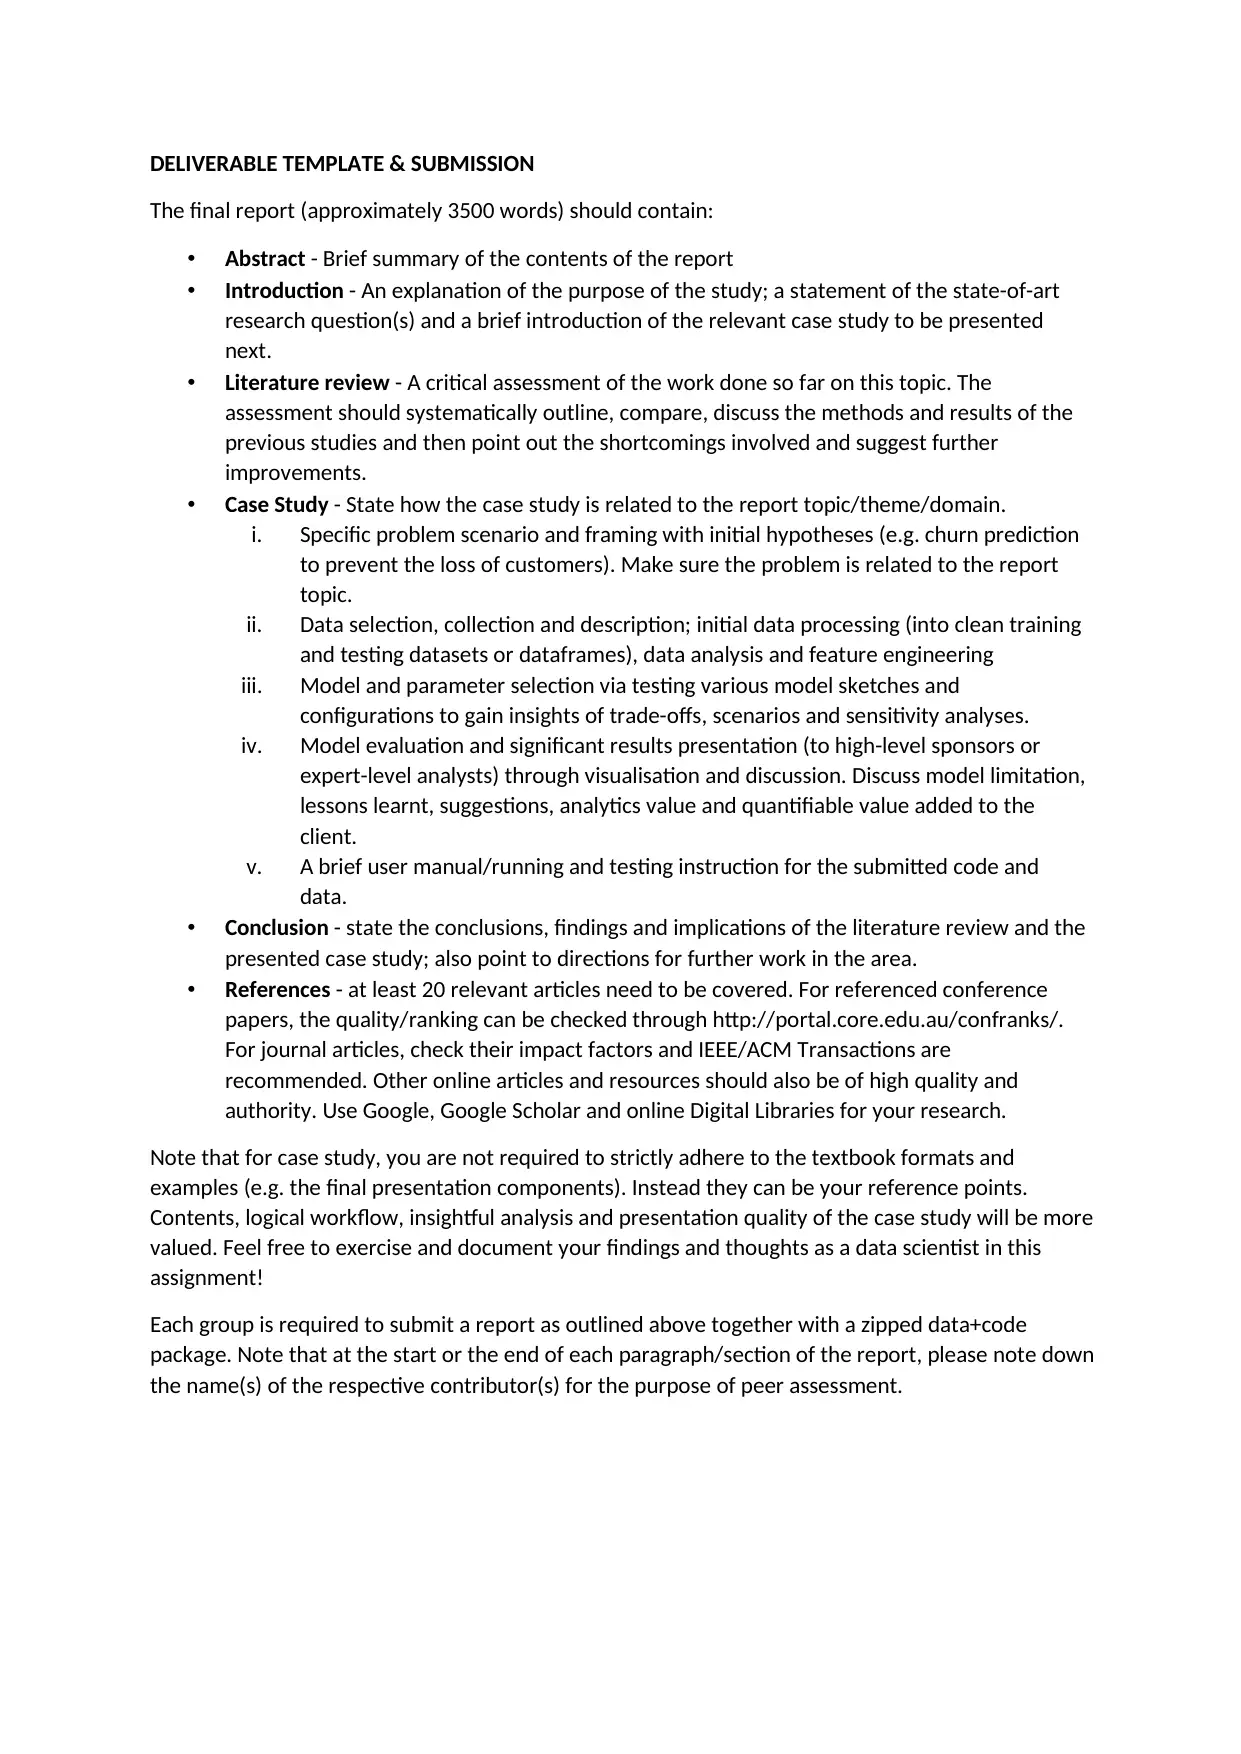
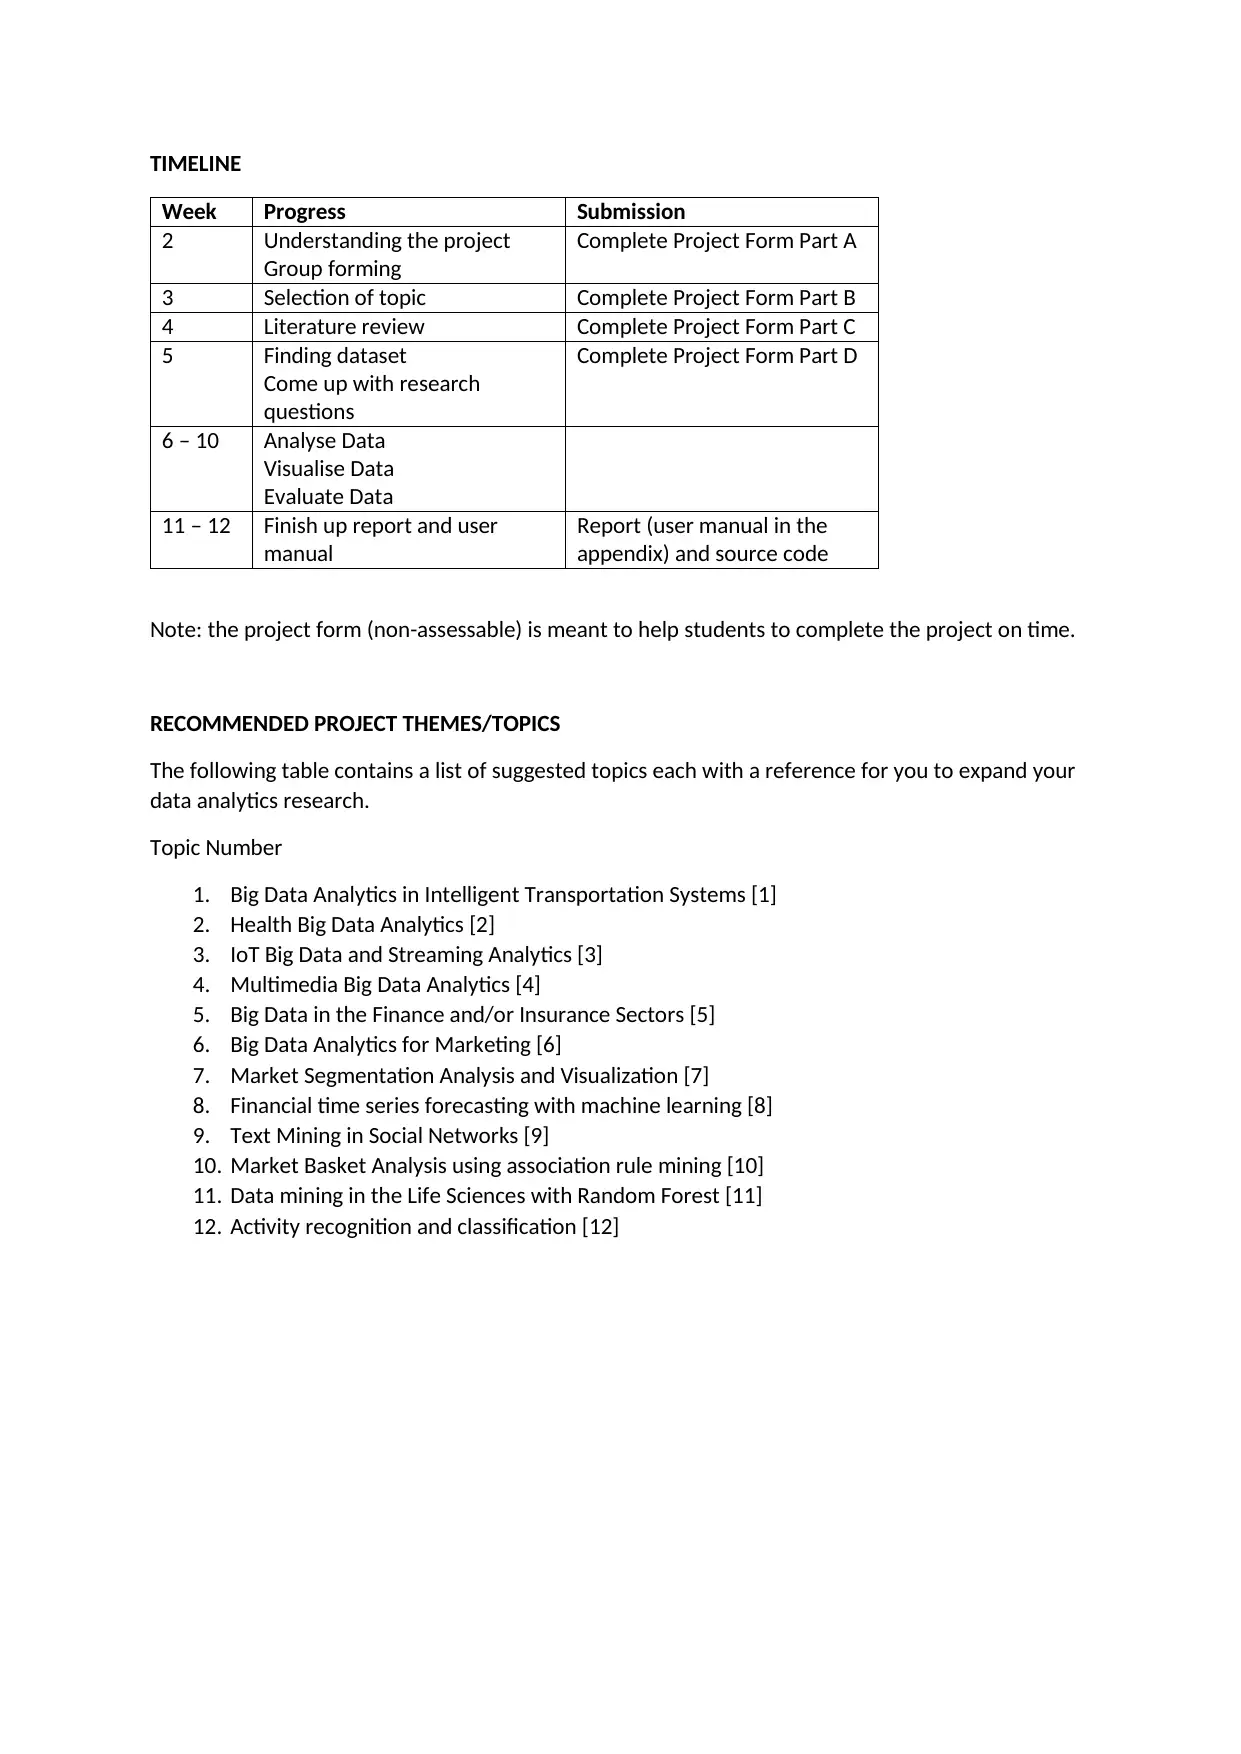
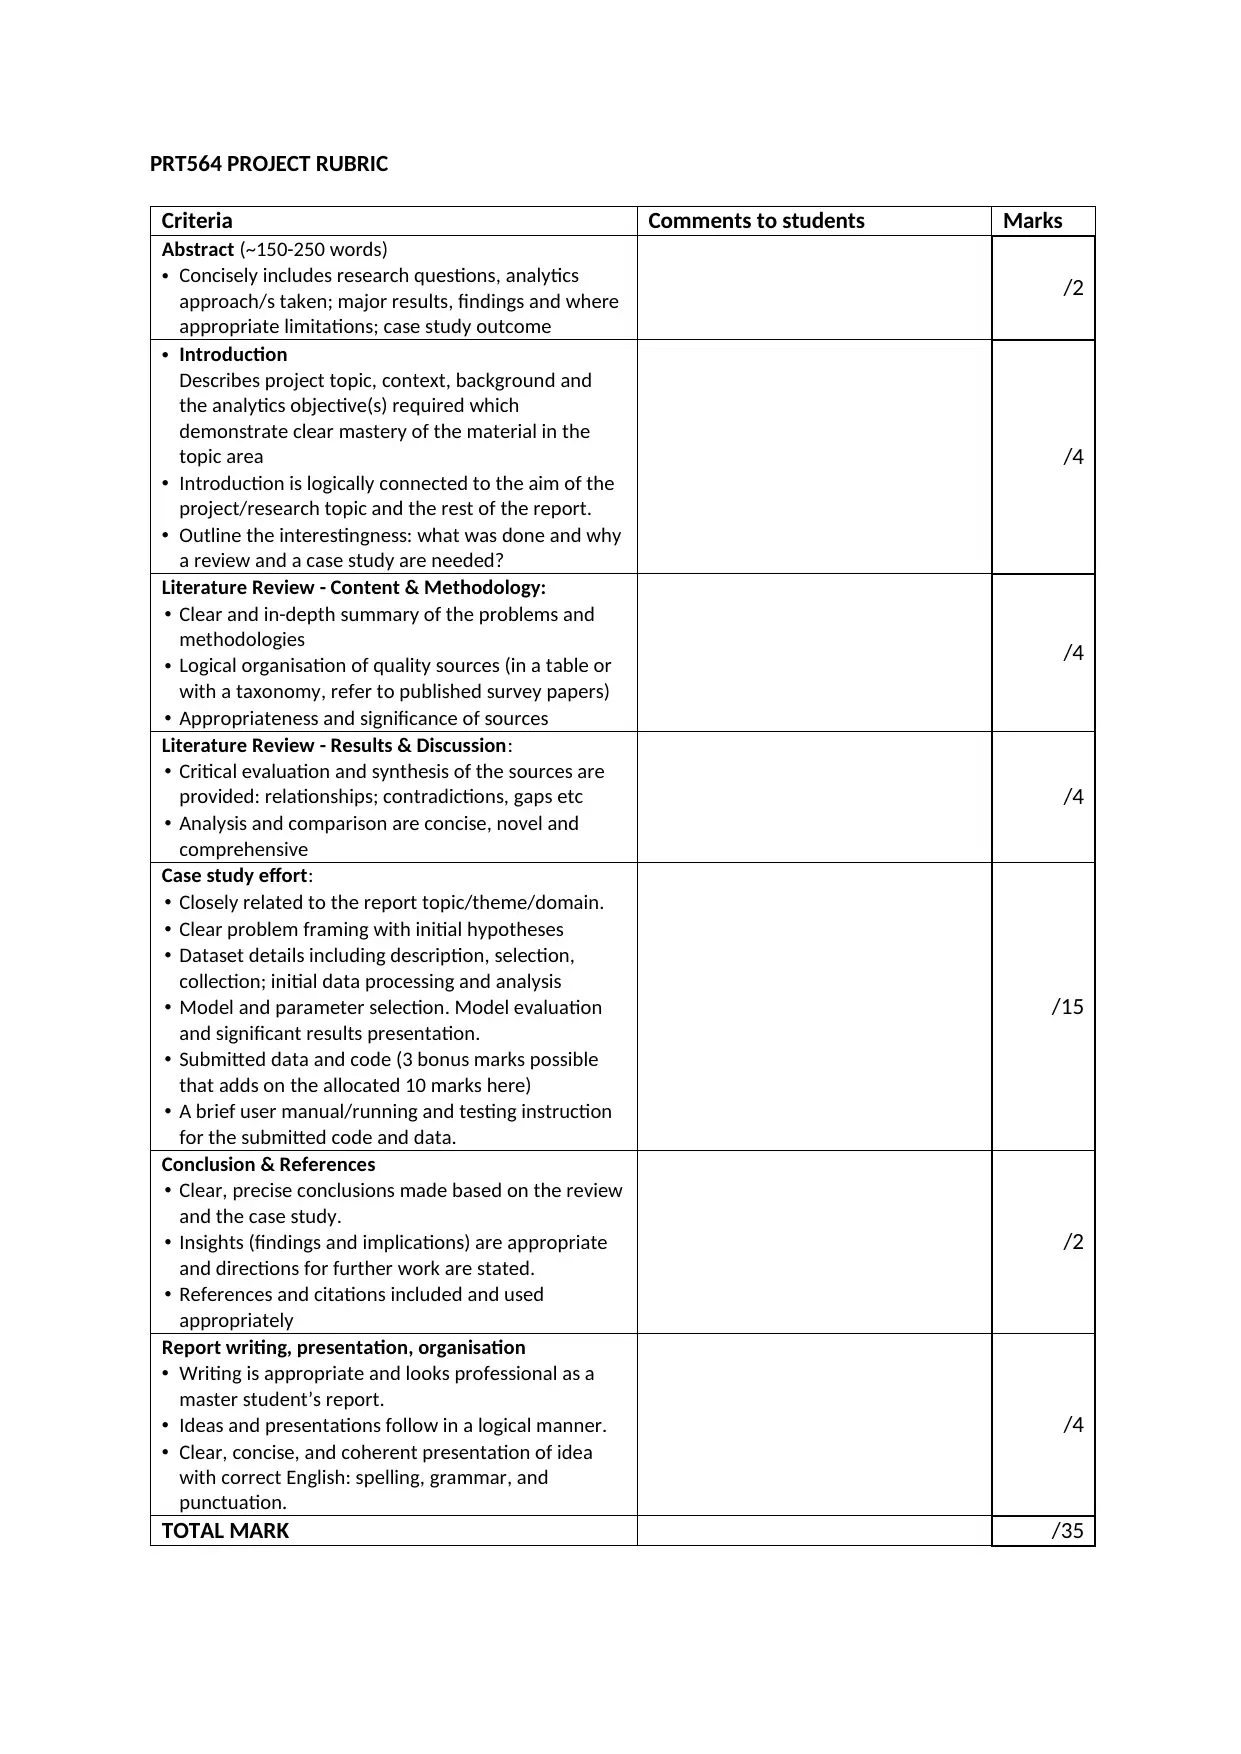
This project report for PRT564 focuses on data analytics and visualisation, requiring students to select a topic from a provided list or propose their own, with lecturer approval. The project necessitates a comprehensive literature review, a relevant case study, and the development of a data analysis lifecycle. The case study must include problem framing, data selection, processing, feature engineering, model building, evaluation, and visualisation, using a dataset of at least several megabytes. Students are expected to work in groups, submit a report of approximately 3500 words, and include a zipped data and code package with a user manual. The report should contain an abstract, introduction, literature review, case study, conclusion, and references. The project emphasizes the application of data science principles, insightful analysis, and presentation quality. A detailed rubric is provided to guide the students through the project's different components and evaluation criteria. The report should demonstrate critical thinking and a strong understanding of data analytics concepts.

PRT564 DATA ANALYTICS AND VISUALISATION
Project
__________________________________________________________________________________
Due on Fri Week 12
INTRODUCTION
You are provided a list of potential topics to choose from to research and write the final report on,
but each topic will only be provided one reference material to start with. However, for your final
report at least 15 references are required so you can do more of your own research along the line of
the topic. You may also choose your own topic of interest subject to the lecturer’s approval even if it
is not in the suggested list.
A relevant case study must be included in your report that matches the report theme. Case study
should contain text descriptions, plots, code snippets about:
i. framing a problem with hypotheses relevant to the reporting topic;
ii. choosing, collecting, processing, feature engineering a dataset (of size at least several
megabytes) for the problem; and
iii. visualising and analysing the processed dataset through model/algorithm building and
evaluation.
Recall that the data analytics lifecycle includes six phases of Discovery, Data Preparation, Model
Planning, Model Building, Communicate Results, and Operationalize. Whereas in our case study we
only focus on the first five phases.
PROJECT SPECIFICATION
For case study, you can use any public dataset available online. Many datasets are available from
https://archive.ics.uci.edu/ml/index.php. Alternatively, you can google for both datasets and source
codes matching the theme of your report, but make sure you provide references to them (e.g. from
a paper or a Kaggle problem). Your data + code package must also be submitted through Learnline
and accompanied with a brief user manual/running and testing instruction subsection under the
Case Study section of your report for the lecturer to run and test your uploaded package.
For completing this assignment, you are to work in a group of 2 or 3. Groups must be formed by end
of week 2. You should then proceed to choose a topic of interest.
Paraphrase This Document
Need a fresh take? Get an instant paraphrase of this document with our AI Paraphraser

DELIVERABLE TEMPLATE & SUBMISSION
The final report (approximately 3500 words) should contain:
• Abstract - Brief summary of the contents of the report
• Introduction - An explanation of the purpose of the study; a statement of the state-of-art
research question(s) and a brief introduction of the relevant case study to be presented
next.
• Literature review - A critical assessment of the work done so far on this topic. The
assessment should systematically outline, compare, discuss the methods and results of the
previous studies and then point out the shortcomings involved and suggest further
improvements.
• Case Study - State how the case study is related to the report topic/theme/domain.
i. Specific problem scenario and framing with initial hypotheses (e.g. churn prediction
to prevent the loss of customers). Make sure the problem is related to the report
topic.
ii. Data selection, collection and description; initial data processing (into clean training
and testing datasets or dataframes), data analysis and feature engineering
iii. Model and parameter selection via testing various model sketches and
configurations to gain insights of trade-offs, scenarios and sensitivity analyses.
iv. Model evaluation and significant results presentation (to high-level sponsors or
expert-level analysts) through visualisation and discussion. Discuss model limitation,
lessons learnt, suggestions, analytics value and quantifiable value added to the
client.
v. A brief user manual/running and testing instruction for the submitted code and
data.
• Conclusion - state the conclusions, findings and implications of the literature review and the
presented case study; also point to directions for further work in the area.
• References - at least 20 relevant articles need to be covered. For referenced conference
papers, the quality/ranking can be checked through http://portal.core.edu.au/confranks/.
For journal articles, check their impact factors and IEEE/ACM Transactions are
recommended. Other online articles and resources should also be of high quality and
authority. Use Google, Google Scholar and online Digital Libraries for your research.
Note that for case study, you are not required to strictly adhere to the textbook formats and
examples (e.g. the final presentation components). Instead they can be your reference points.
Contents, logical workflow, insightful analysis and presentation quality of the case study will be more
valued. Feel free to exercise and document your findings and thoughts as a data scientist in this
assignment!
Each group is required to submit a report as outlined above together with a zipped data+code
package. Note that at the start or the end of each paragraph/section of the report, please note down
the name(s) of the respective contributor(s) for the purpose of peer assessment.

TIMELINE
Week Progress Submission
2 Understanding the project
Group forming
Complete Project Form Part A
3 Selection of topic Complete Project Form Part B
4 Literature review Complete Project Form Part C
5 Finding dataset
Come up with research
questions
Complete Project Form Part D
6 – 10 Analyse Data
Visualise Data
Evaluate Data
11 – 12 Finish up report and user
manual
Report (user manual in the
appendix) and source code
Note: the project form (non-assessable) is meant to help students to complete the project on time.
RECOMMENDED PROJECT THEMES/TOPICS
The following table contains a list of suggested topics each with a reference for you to expand your
data analytics research.
Topic Number
1. Big Data Analytics in Intelligent Transportation Systems [1]
2. Health Big Data Analytics [2]
3. IoT Big Data and Streaming Analytics [3]
4. Multimedia Big Data Analytics [4]
5. Big Data in the Finance and/or Insurance Sectors [5]
6. Big Data Analytics for Marketing [6]
7. Market Segmentation Analysis and Visualization [7]
8. Financial time series forecasting with machine learning [8]
9. Text Mining in Social Networks [9]
10. Market Basket Analysis using association rule mining [10]
11. Data mining in the Life Sciences with Random Forest [11]
12. Activity recognition and classification [12]
⊘ This is a preview!⊘
Do you want full access?
Subscribe today to unlock all pages.

Trusted by 1+ million students worldwide

REFERENCES
[1] Li Zhu, Fei Richard Yu, Yige Wang, Bin Ning and Tao Tang, “Big Data Analytics in Intelligent
Transportation Systems: A Survey”, IEEE Trans. Intelligent Transportation Systems, Vol. 20, No. 1,
2019, 383-398.
[2] G. Harerimana, B. Jang, J. W. Kim and H. K. Park, “Health Big Data Analytics: A Technology
Survey”, in IEEE Access, vol. 6, pp. 65661-65678, 2018.
[3] M. Mohammadi, A. Al-Fuqaha, S. Sorour and M. Guizani, “Deep Learning for IoT Big Data and
Streaming Analytics: A Survey," in IEEE Communications Surveys & Tutorials, vol. 20, no. 4, pp. 2923-
2960, Fourthquarter 2018.
[4] Samira Pouyanfar, Yimin Yang, Shu-Ching Chen, Mei-Ling Shyu, and S. S. Iyengar. “Multimedia Big
Data Analytics: A Survey”. ACM Comput. Surv. 51, 1, Article 10 (January 2018), 34 pages.
[5] Hussain K., Prieto E. (2016), “Big Data in the Finance and Insurance Sectors” In: Cavanillas J.,
Curry E., Wahlster W. (eds) New Horizons for a Data-Driven Economy. Springer, Cham.
[6] Ducange, P., Pecori, R. & Mezzina, P., “A glimpse on big data analytics in the framework of
marketing strategies”, Soft Comput (2018) 22: 325.
[7] Deepali Kamthania, Ashish Pahwa and Srijit S. Madhavan, “Market Segmentation Analysis and
Visualization Using K-Mode Clustering Algorithm for E-Commerce Business”, Journal of Computing
and Information Technology 26(1):57-68, 2018.
[8] Bjoern Krollne, Bruce J. Vanstone and Gavin R. Finnie, Financial time series forecasting with
machine learning techniques: a survey, Journal of Computing and Information Technology, Vol. 26,
No. 1, March 2018, 57–68.
[9] Aggarwal C.C., Wang H. (2011) “Text Mining in Social Networks”. In: Aggarwal C. (eds) Social
Network Data Analytics. Springer, Boston, MA
[10] Manpreet Kaur and Shivani Kang, “Market Basket Analysis: Identify the Changing Trends of
Market Data Using Association Rule Mining”, Procedia Computer Science, Volume 85, 2016, Pages
78-85.
[11] Wouter G. Touw, Jumamurat R. Bayjanov, Lex Overmars, Lennart Backus, Jos Boekhorst, Michiel
Wels, Sacha A. F. T. van Hijum, “Data mining in the Life Sciences with Random Forest: a walk in the
park or lost in the jungle?”, Briefings in Bioinformatics, Volume 14, Issue 3, May 2013, Pages 315–
326.
[12] Jindong Wang, Yiqiang Chen, Shuji Hao, Xiaohui Peng, Lisha Hu, “Deep Learning for Sensor-
based Activity Recognition: A Survey”, 2018, https://arxiv.org/abs/1707.03502.
Paraphrase This Document
Need a fresh take? Get an instant paraphrase of this document with our AI Paraphraser

PRT564 PROJECT RUBRIC
Criteria Comments to students Marks
Abstract (~150-250 words)
• Concisely includes research questions, analytics
approach/s taken; major results, findings and where
appropriate limitations; case study outcome
/2
• Introduction
Describes project topic, context, background and
the analytics objective(s) required which
demonstrate clear mastery of the material in the
topic area
• Introduction is logically connected to the aim of the
project/research topic and the rest of the report.
• Outline the interestingness: what was done and why
a review and a case study are needed?
/4
Literature Review - Content & Methodology:
• Clear and in-depth summary of the problems and
methodologies
• Logical organisation of quality sources (in a table or
with a taxonomy, refer to published survey papers)
• Appropriateness and significance of sources
/4
Literature Review - Results & Discussion:
• Critical evaluation and synthesis of the sources are
provided: relationships; contradictions, gaps etc
• Analysis and comparison are concise, novel and
comprehensive
/4
Case study effort:
• Closely related to the report topic/theme/domain.
• Clear problem framing with initial hypotheses
• Dataset details including description, selection,
collection; initial data processing and analysis
• Model and parameter selection. Model evaluation
and significant results presentation.
• Submitted data and code (3 bonus marks possible
that adds on the allocated 10 marks here)
• A brief user manual/running and testing instruction
for the submitted code and data.
/15
Conclusion & References
• Clear, precise conclusions made based on the review
and the case study.
• Insights (findings and implications) are appropriate
and directions for further work are stated.
• References and citations included and used
appropriately
/2
Report writing, presentation, organisation
• Writing is appropriate and looks professional as a
master student’s report.
• Ideas and presentations follow in a logical manner.
• Clear, concise, and coherent presentation of idea
with correct English: spelling, grammar, and
punctuation.
/4
TOTAL MARK /35
1 out of 5
Related Documents
Your All-in-One AI-Powered Toolkit for Academic Success.
+13062052269
info@desklib.com
Available 24*7 on WhatsApp / Email
Unlock your academic potential
Copyright © 2020–2025 A2Z Services. All Rights Reserved. Developed and managed by ZUCOL.


