Data Analytics and Visualisation Project Report for PRT564: Semester 1
VerifiedAdded on 2021/09/10
|5
|2023
|35
Project
AI Summary
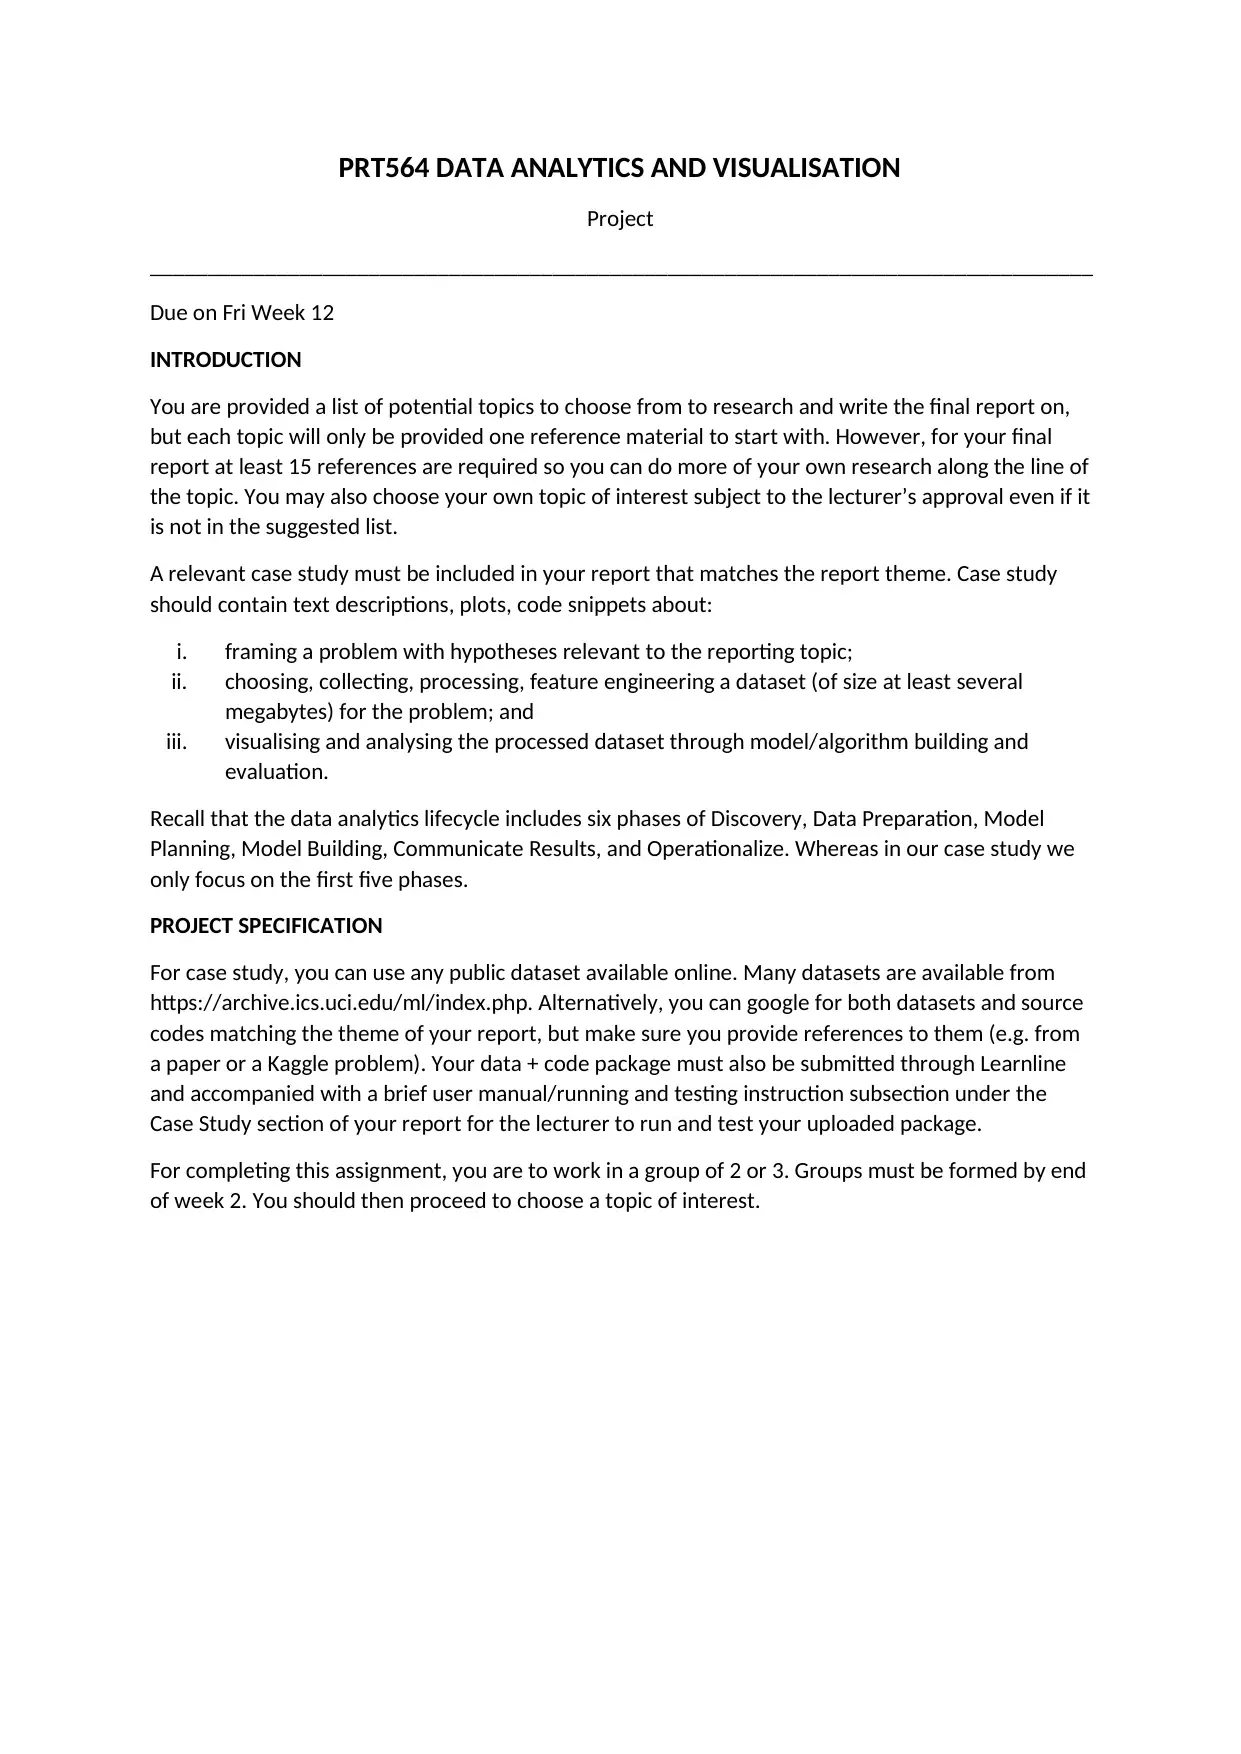
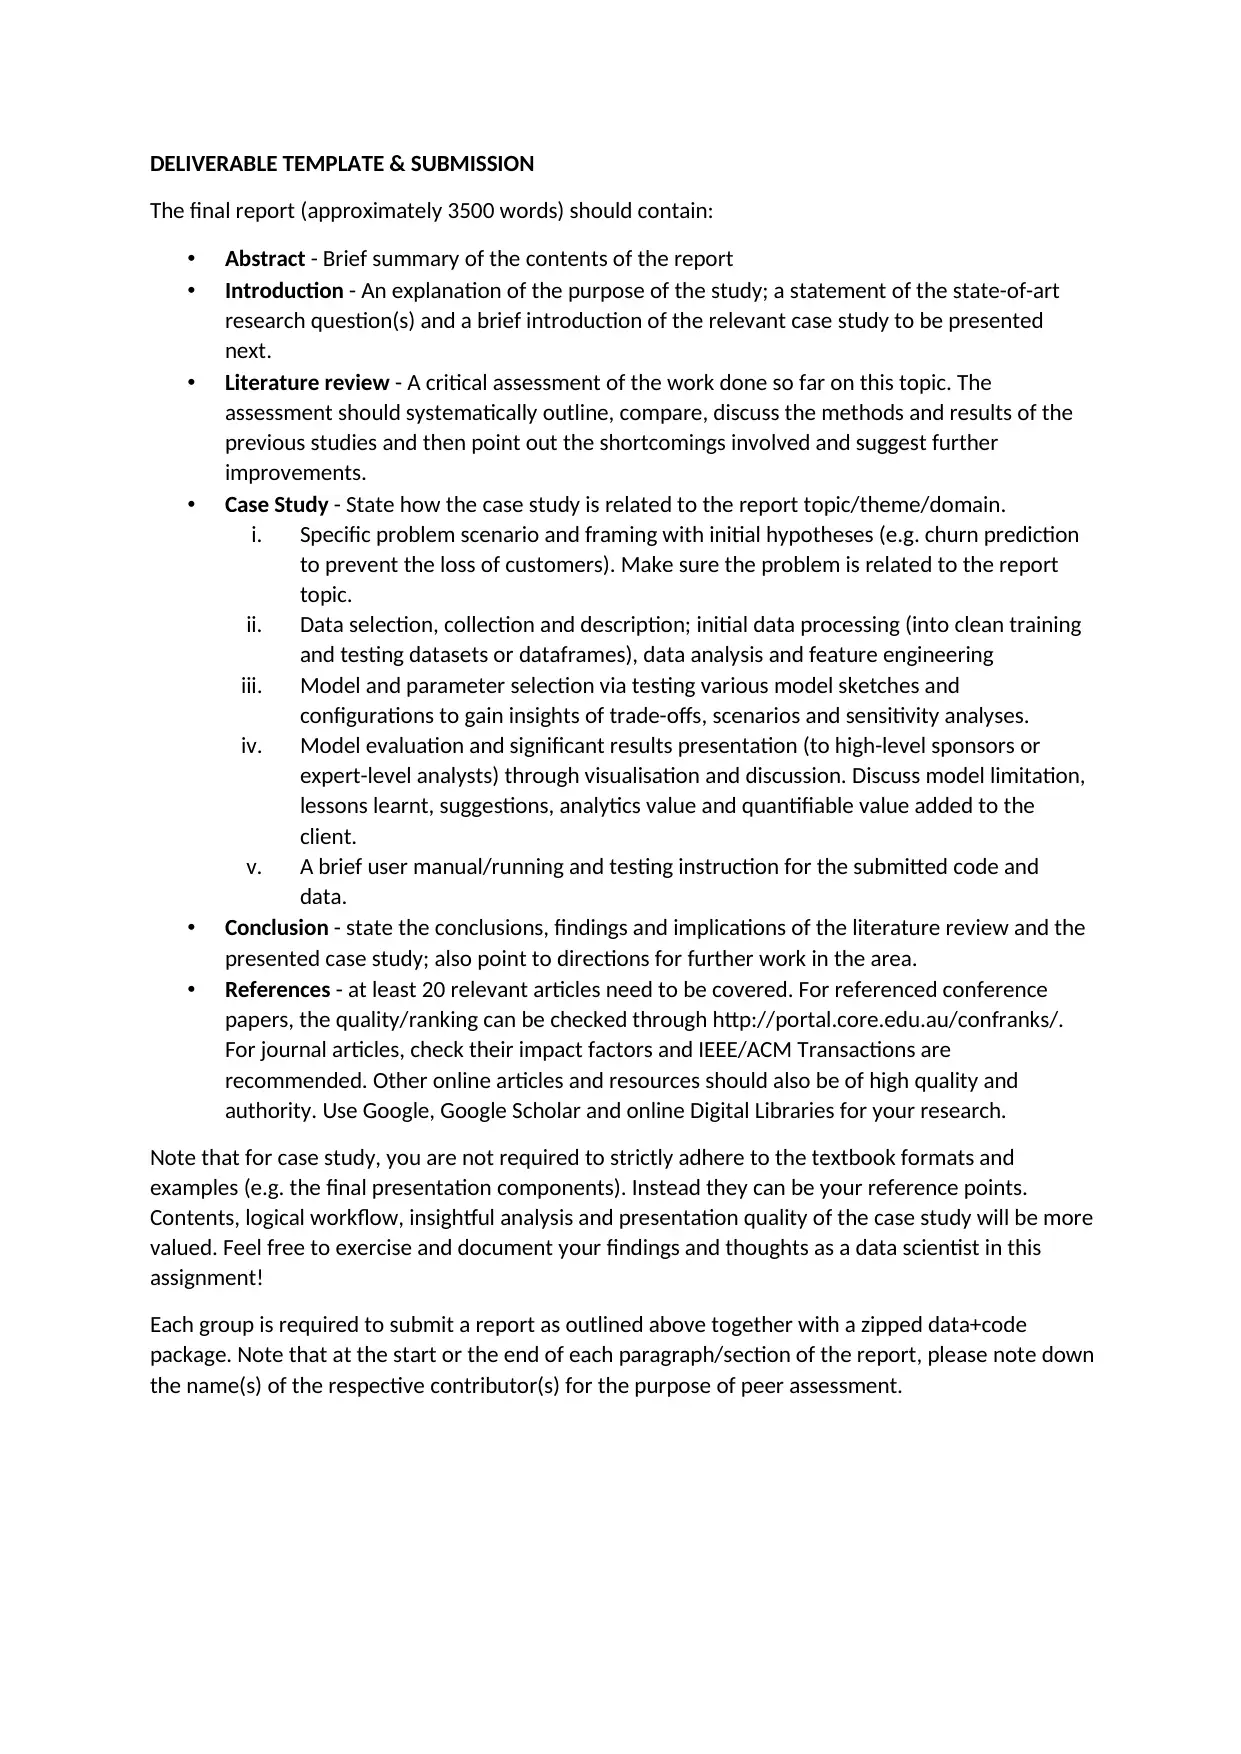
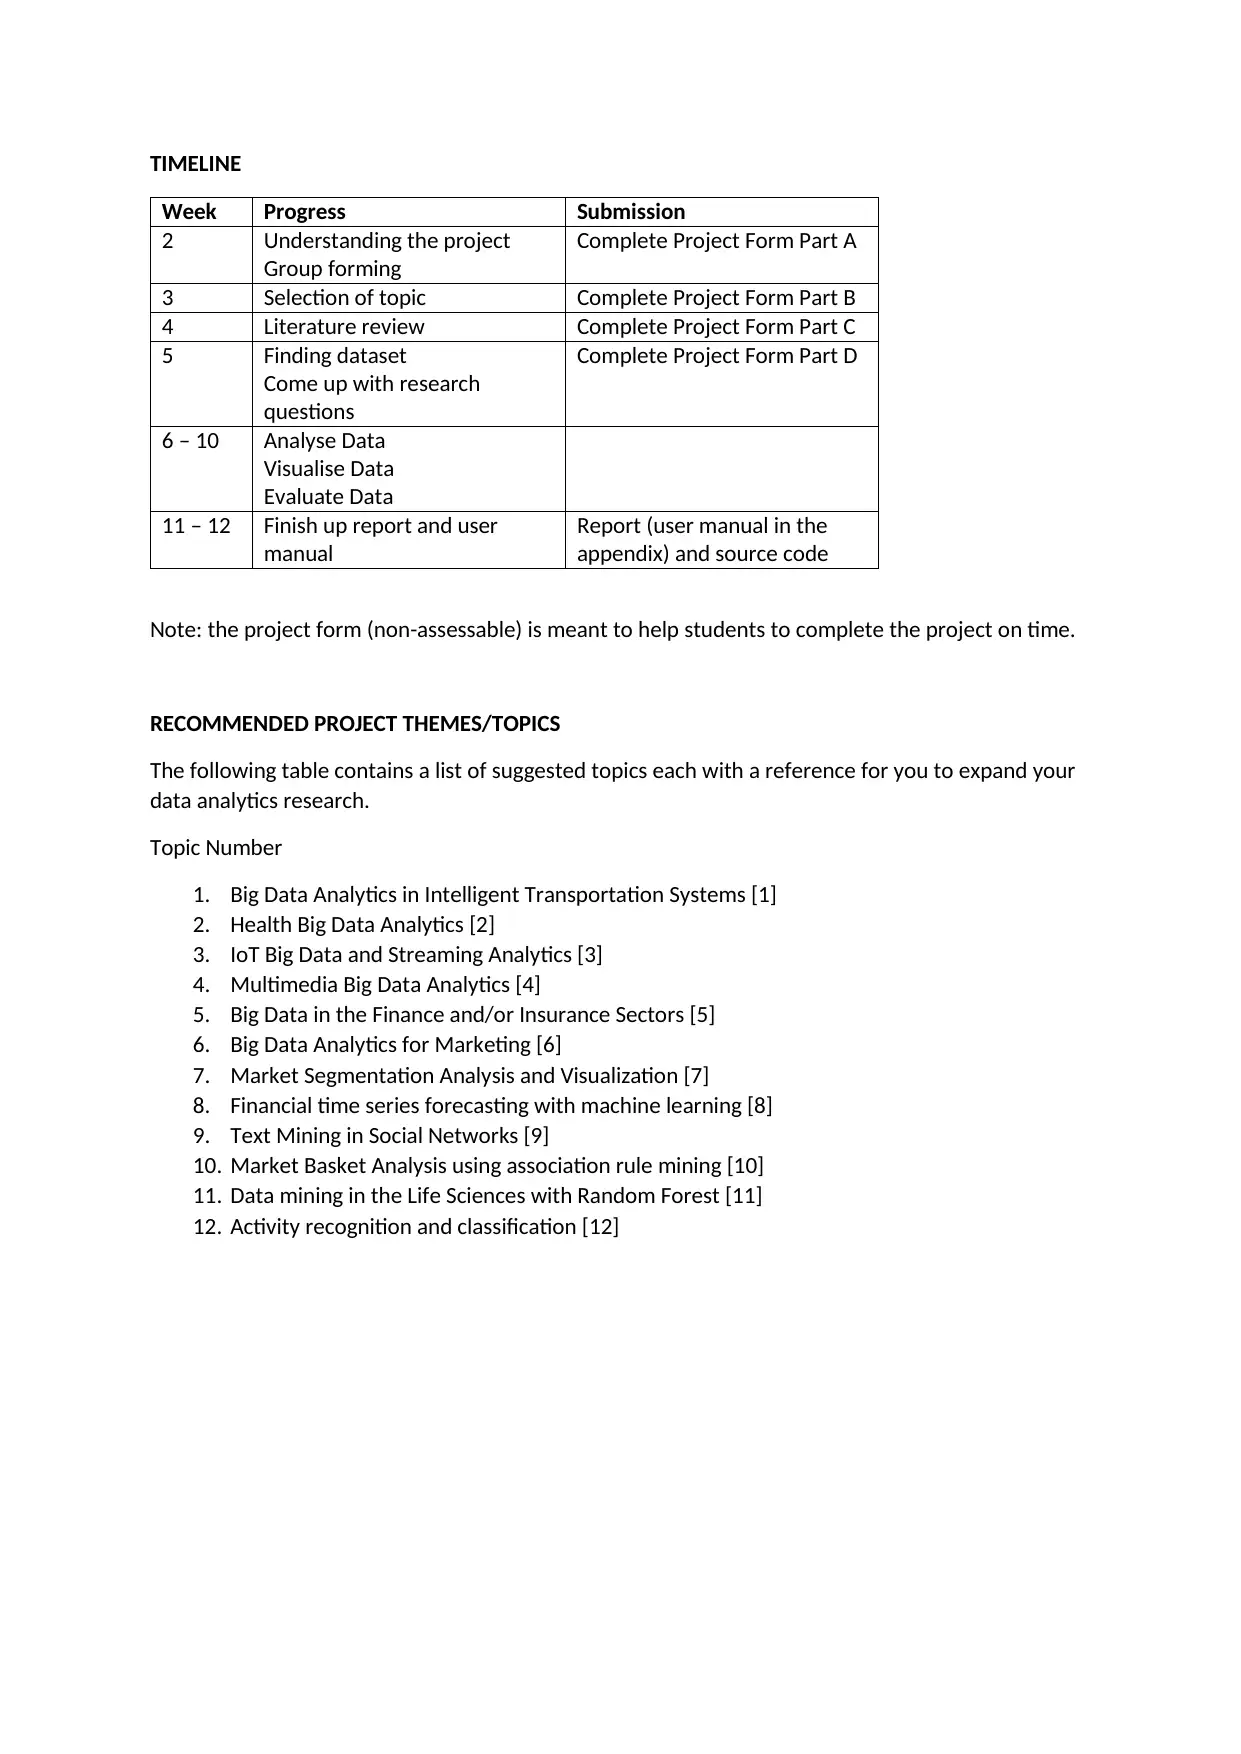
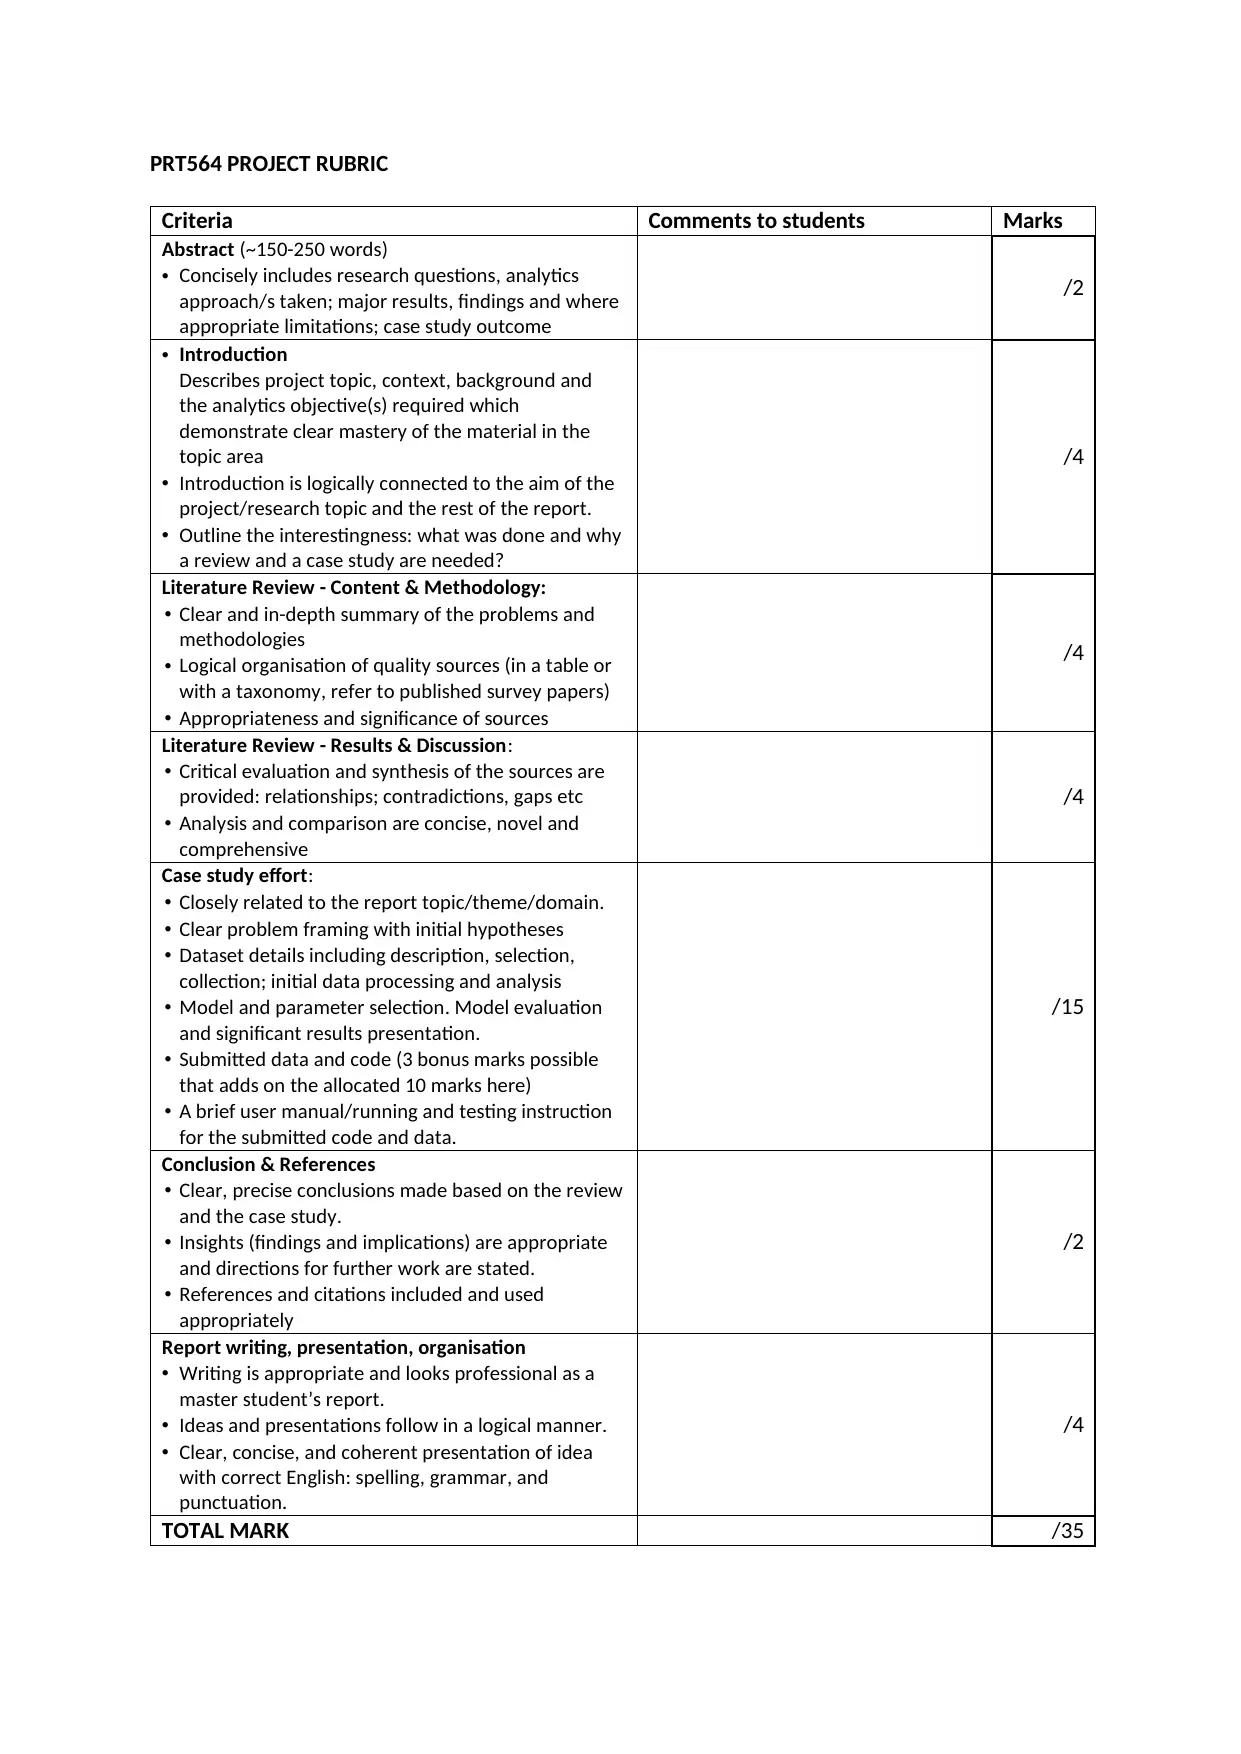
This project report for the PRT564 Data Analytics and Visualisation course requires students to conduct research, write a comprehensive report, and complete a case study. The project involves selecting a topic from a provided list or choosing a topic with lecturer approval. The report must include an abstract, introduction, literature review, case study, conclusion, and references. The case study must encompass problem framing, data selection and processing, model building and evaluation, and results presentation. Students work in groups and submit a report along with a zipped data+code package, including a user manual. The project emphasizes the data analytics lifecycle, with a focus on the first five phases: discovery, data preparation, model planning, model building, and communication of results. The project also includes a timeline for completion and a detailed rubric for assessment, covering various aspects of the report, from the abstract to the references and writing quality. The report aims to provide insights and practical experience in data analytics and visualization.
1 out of 5
Related Documents


Your All-in-One AI-Powered Toolkit for Academic Success.
+13062052269
info@desklib.com
Available 24*7 on WhatsApp / Email
![[object Object]](/_next/static/media/star-bottom.7253800d.svg)
Copyright © 2020–2026 A2Z Services. All Rights Reserved. Developed and managed by ZUCOL.