Statistical Analysis Assignment 4: PS390, Ashworth College, Psychology
VerifiedAdded on 2023/06/08
|11
|1783
|196
Homework Assignment
AI Summary
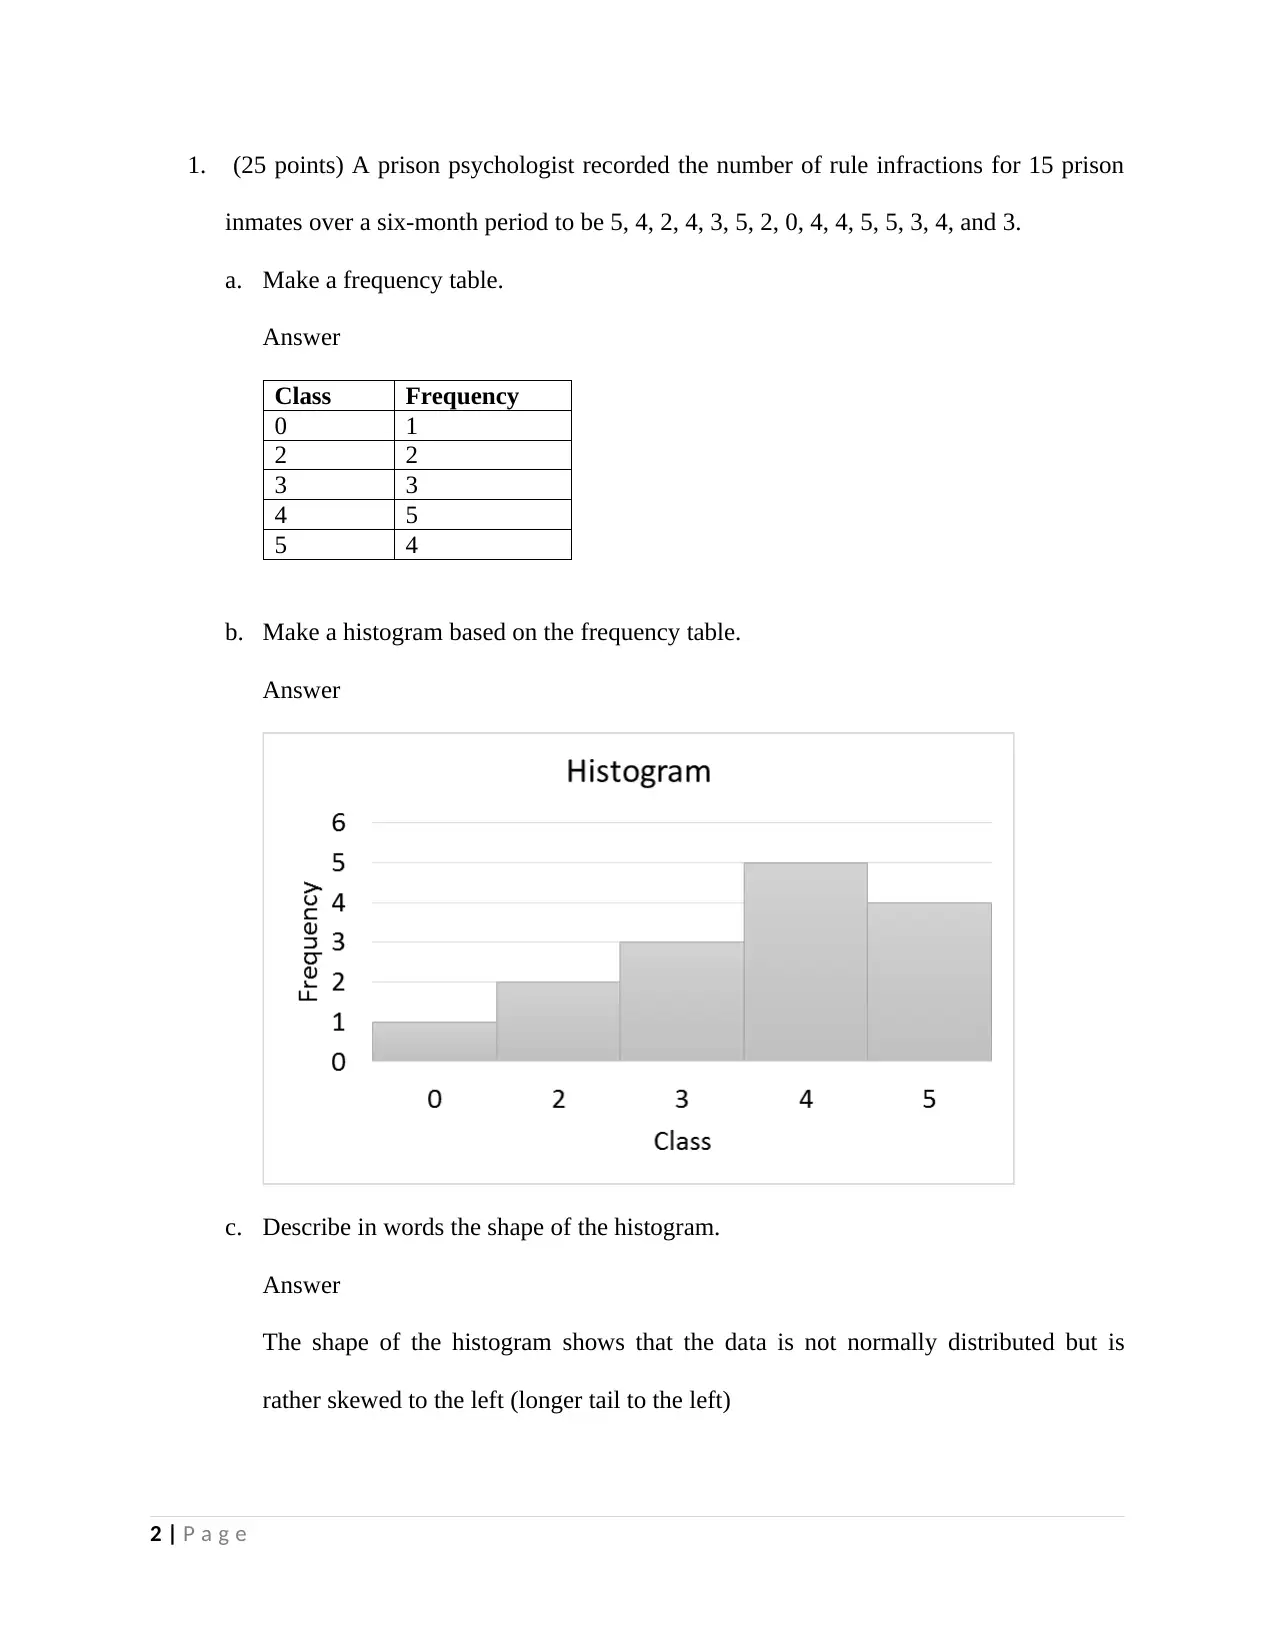
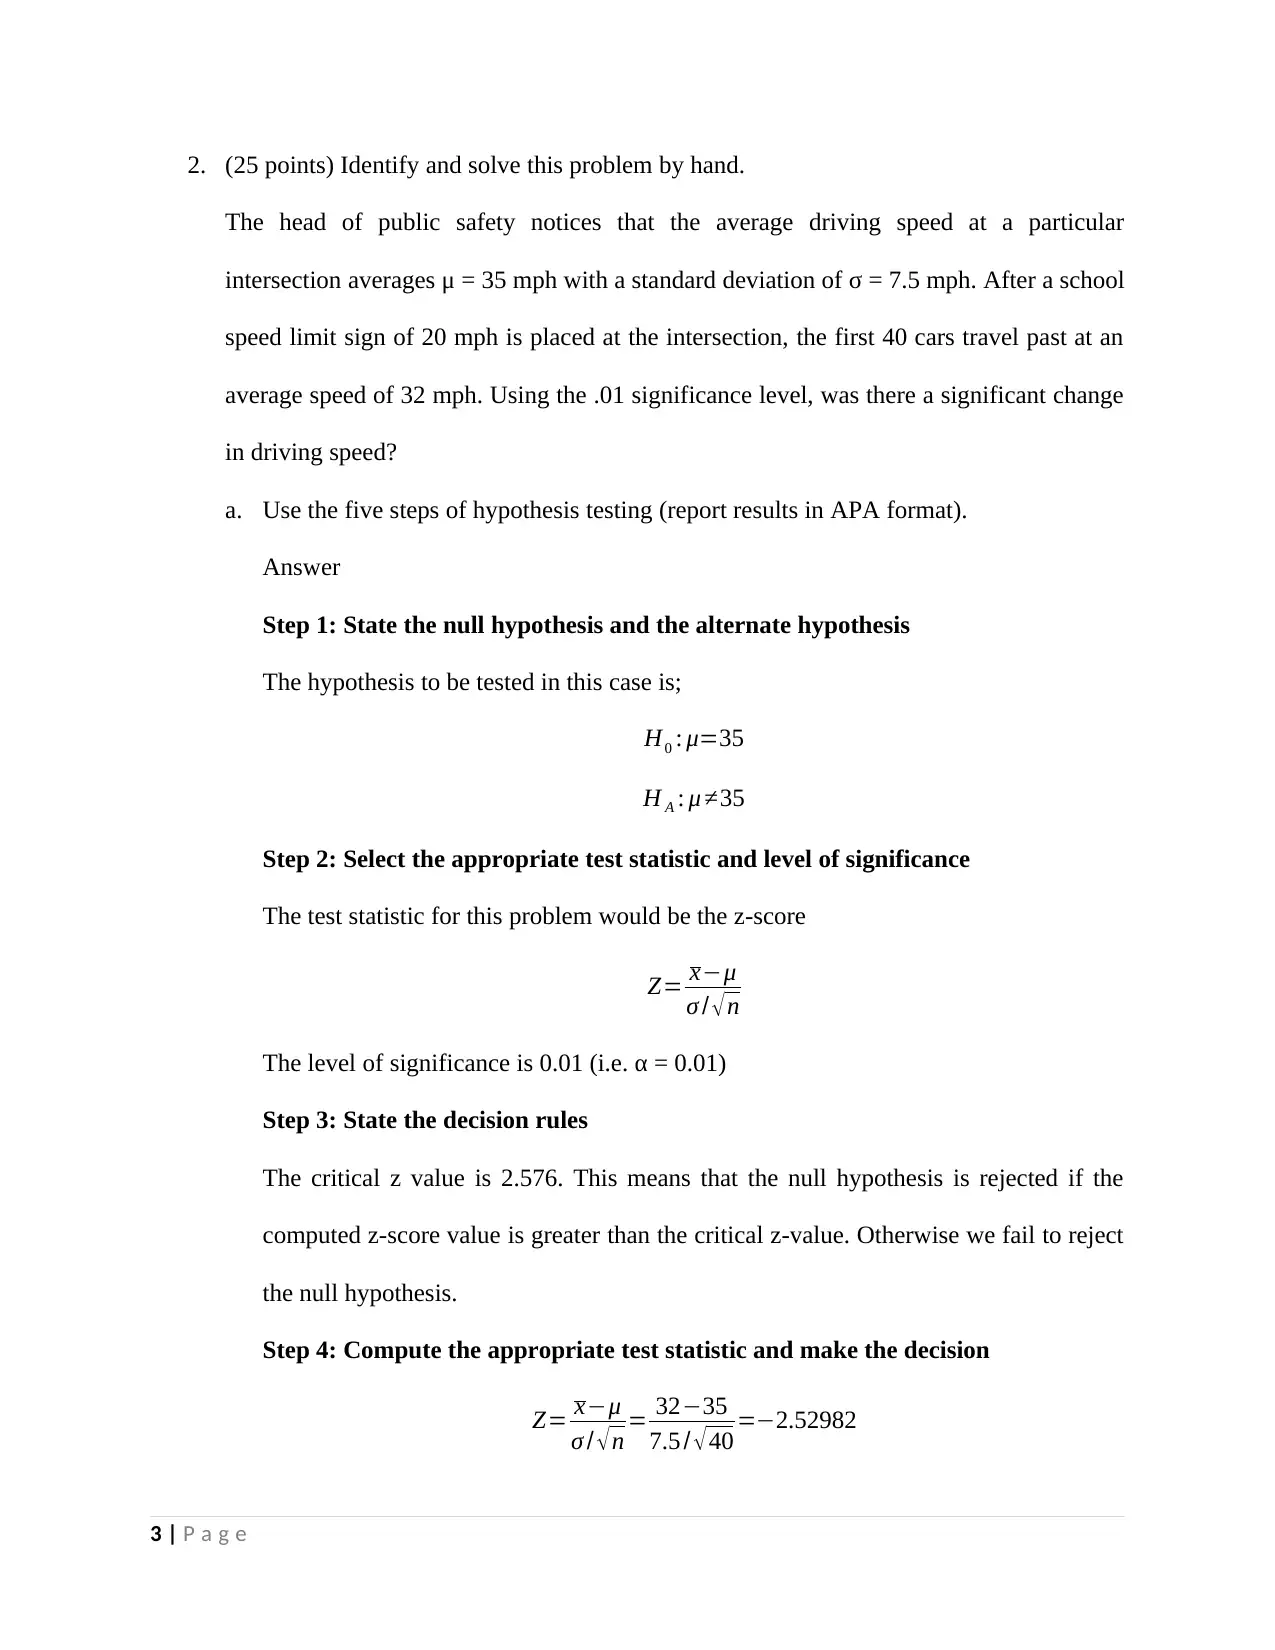
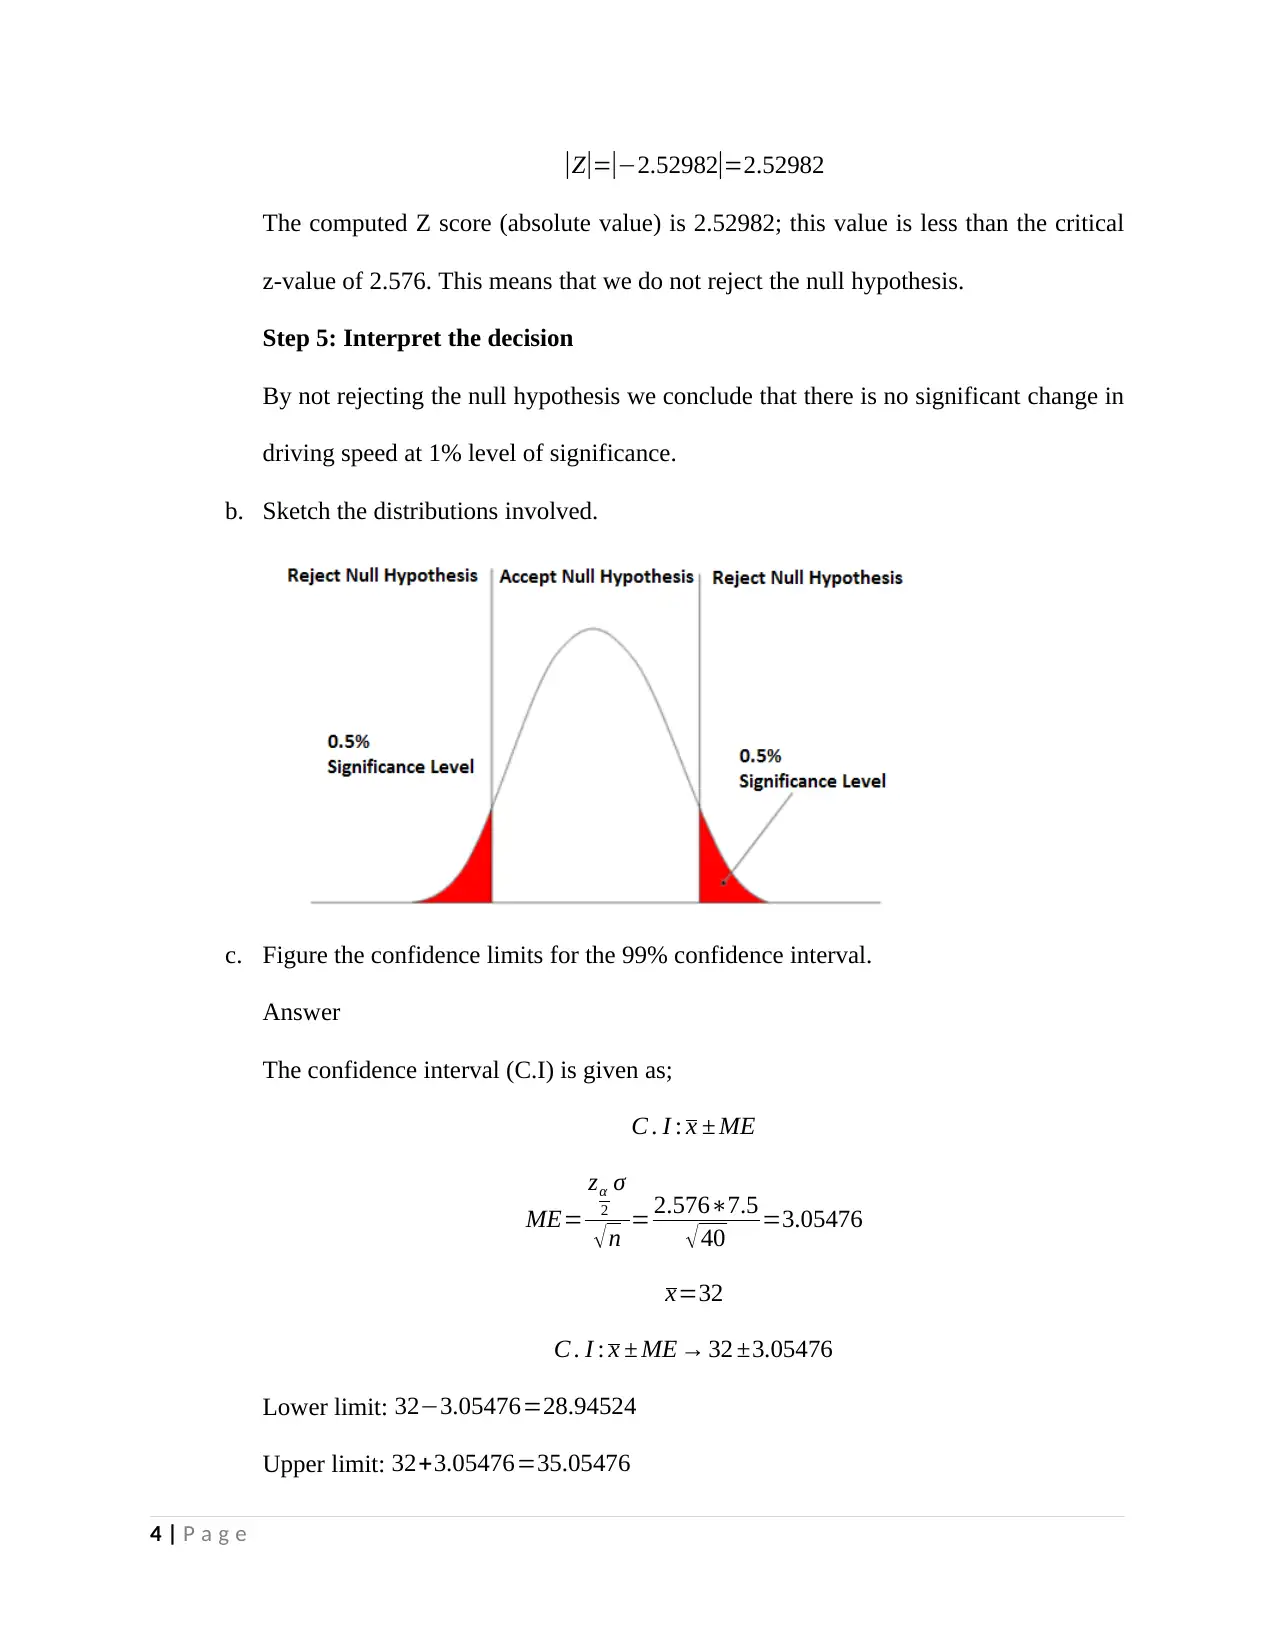
This assignment solution for PS390, Statistical Reasoning in Psychology, addresses four problems. The first involves creating a frequency table and histogram for rule infractions and describing the histogram's shape. The second problem focuses on hypothesis testing related to driving speeds, including calculations and confidence intervals. The third problem uses StatCrunch and hand calculations to analyze the impact of a film on concern for farm workers, involving paired t-tests and effect size. The final problem investigates the effects of sleep deprivation on short-term memory, utilizing independent samples t-tests, graph creation, effect size calculation, and APA format reporting for all analyses.
1 out of 11
Related Documents


Your All-in-One AI-Powered Toolkit for Academic Success.
+13062052269
info@desklib.com
Available 24*7 on WhatsApp / Email
![[object Object]](/_next/static/media/star-bottom.7253800d.svg)
Copyright © 2020–2026 A2Z Services. All Rights Reserved. Developed and managed by ZUCOL.