Psychological and Institutional Statistics
Added on 2022-08-12
12 Pages2692 Words27 Views
Running head: PSYCHOLOGICAL AND INSTITUTIONAL STATISTICS 1
Psychological and Institutional Statistics
By
(Name of Student)
(Institutional Affiliation)
(Course Code)
(Date of Submission)
Psychological and Institutional Statistics
By
(Name of Student)
(Institutional Affiliation)
(Course Code)
(Date of Submission)
PSYCHOLOGICAL AND INSTITUTIONAL STATISTICS 2
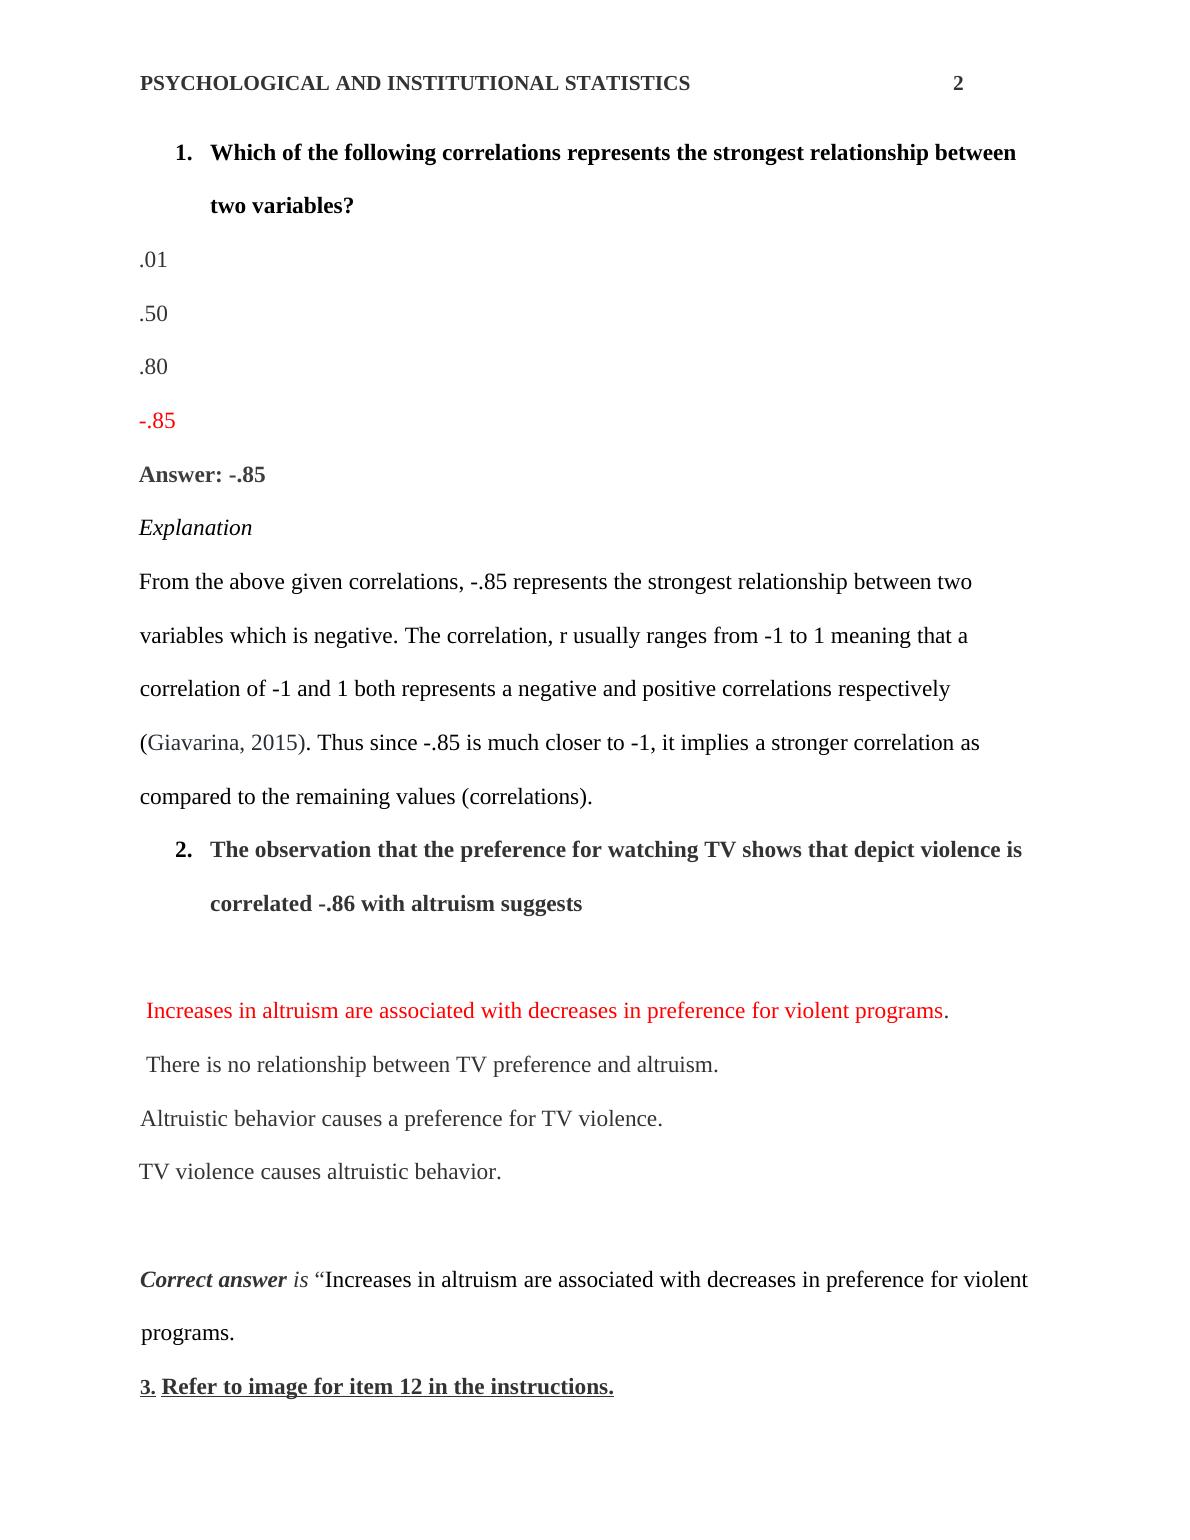
1. Which of the following correlations represents the strongest relationship between
two variables?
.01
.50
.80
-.85
Answer: -.85
Explanation
From the above given correlations, -.85 represents the strongest relationship between two
variables which is negative. The correlation, r usually ranges from -1 to 1 meaning that a
correlation of -1 and 1 both represents a negative and positive correlations respectively
(Giavarina, 2015). Thus since -.85 is much closer to -1, it implies a stronger correlation as
compared to the remaining values (correlations).
2. The observation that the preference for watching TV shows that depict violence is
correlated -.86 with altruism suggests
Increases in altruism are associated with decreases in preference for violent programs.
There is no relationship between TV preference and altruism.
Altruistic behavior causes a preference for TV violence.
TV violence causes altruistic behavior.
Correct answer is “Increases in altruism are associated with decreases in preference for violent
programs.
3. Refer to image for item 12 in the instructions.
PSYCHOLOGICAL AND INSTITUTIONAL STATISTICS 3
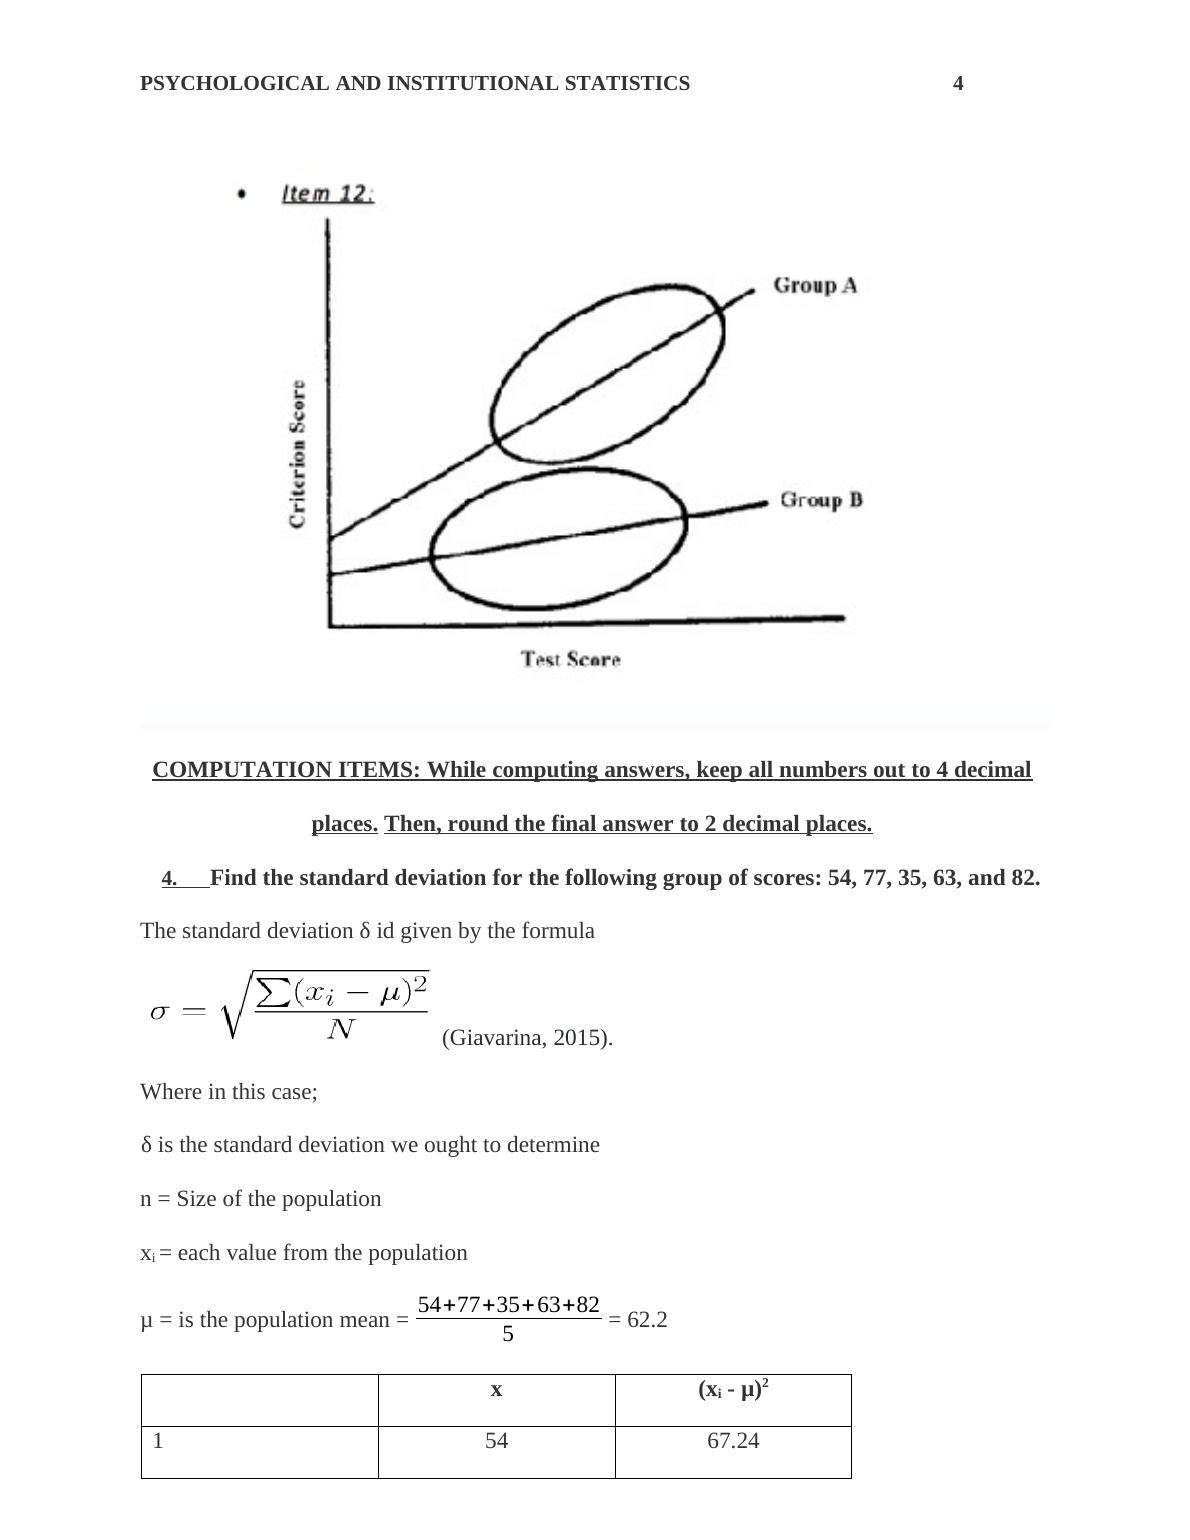
In terms of criterion validity, the situation shown in the diagram
reflects...
Test bias in favor of Group B.
No bias in favor of either group.
Higher validity for Group B.
Differential validity.
Answer: test bias in favor of Group B
The criterion validity aims at testing bias of the results between group A and group B.
Criterion validity measures the extent to which the test scores between group A and B are
correlated with other variables (criterion) that the expected results should correlate with.
In the diagram the common line of the criterion favors B. Therefore, this reflects “test bias in
favor of Group B “in the test scores.
PSYCHOLOGICAL AND INSTITUTIONAL STATISTICS 4
COMPUTATION ITEMS: While computing answers, keep all numbers out to 4 decimal
places. Then, round the final answer to 2 decimal places.
4. Find the standard deviation for the following group of scores: 54, 77, 35, 63, and 82.
The standard deviation δ id given by the formula
(Giavarina, 2015).
Where in this case;
δ is the standard deviation we ought to determine
n = Size of the population
xi = each value from the population
μ = is the population mean = 54+77+35+ 63+82
5 = 62.2
x (xi - μ)2
1 54 67.24
End of preview
Want to access all the pages? Upload your documents or become a member.