Analyzing Psychological Data: Encoding Specificity and Error Rates
VerifiedAdded on 2023/06/14
|12
|1715
|491
Report
AI Summary
This research report delves into the Encoding Specificity Principle within cognitive psychology, examining the concept of state-dependent learning. It analyzes data from a psychologist's test involving students learning statistics in different environments—home, classroom, and exam hall—and their subsequent error rates in the exam hall. The analysis includes comparison of means, ANOVA, and independent sample t-tests to determine if the learning environment impacts recall and error rates. The findings suggest that the lowest error rates occurred in the classroom, and there was no significant difference in error rates between the exam hall and non-exam hall environments, contradicting Tulving's Encoding Specificity Principle in this specific experiment. The report concludes with a recommendation for future research involving larger sample sizes to further investigate the principle.
Running head: PSYCHOLOGY
Psychological Data Analysis
Name of the Student:
Name of the University:
Author’s Note:
Psychological Data Analysis
Name of the Student:
Name of the University:
Author’s Note:
Paraphrase This Document
Need a fresh take? Get an instant paraphrase of this document with our AI Paraphraser
1PSYCHOLOGY
Abstract
The research report finds the vital aspects of the “Encoding Specificity Principle” of
psychology. The abstract highlights the test report of a psychologist based on the idea of
“state-dependent learning” from cognitive psychology. The sampled data consists only two
variables that are “rate of error” in the scale 0 to 2 and “places of performance”. Comparison
of means and ANOVA shows that rate of error in all the three places of performance are
unequal. Independent sample t-tests are applied in this analysis concluded that rates of error
are equal in both exam-hall and non-exam hall. However, the following analysis based on
small sample do not satisfy the principle of Tulving’s (1973).
Keywords: Cognitive Psychology, Rate of Error, Exam Hall, “Encoding Specificity
Principle”.
2PSYCHOLOGY
Table of Contents
Introduction:...............................................................................................................................3
Research Hypotheses:................................................................................................................3
Hypothesis 1:..........................................................................................................................3
Hypothesis 2:..........................................................................................................................4
Research Method:.......................................................................................................................4
Data Analysis:............................................................................................................................4
Comparison of Means............................................................................................................4
ANOVA:................................................................................................................................5
Independent Sample t-test:.....................................................................................................5
Conclusion:................................................................................................................................6
Recommendation:......................................................................................................................7
Reference:..................................................................................................................................8
Appendix:...................................................................................................................................9
⊘ This is a preview!⊘
Do you want full access?
Subscribe today to unlock all pages.
Trusted by 1+ million students worldwide
3PSYCHOLOGY
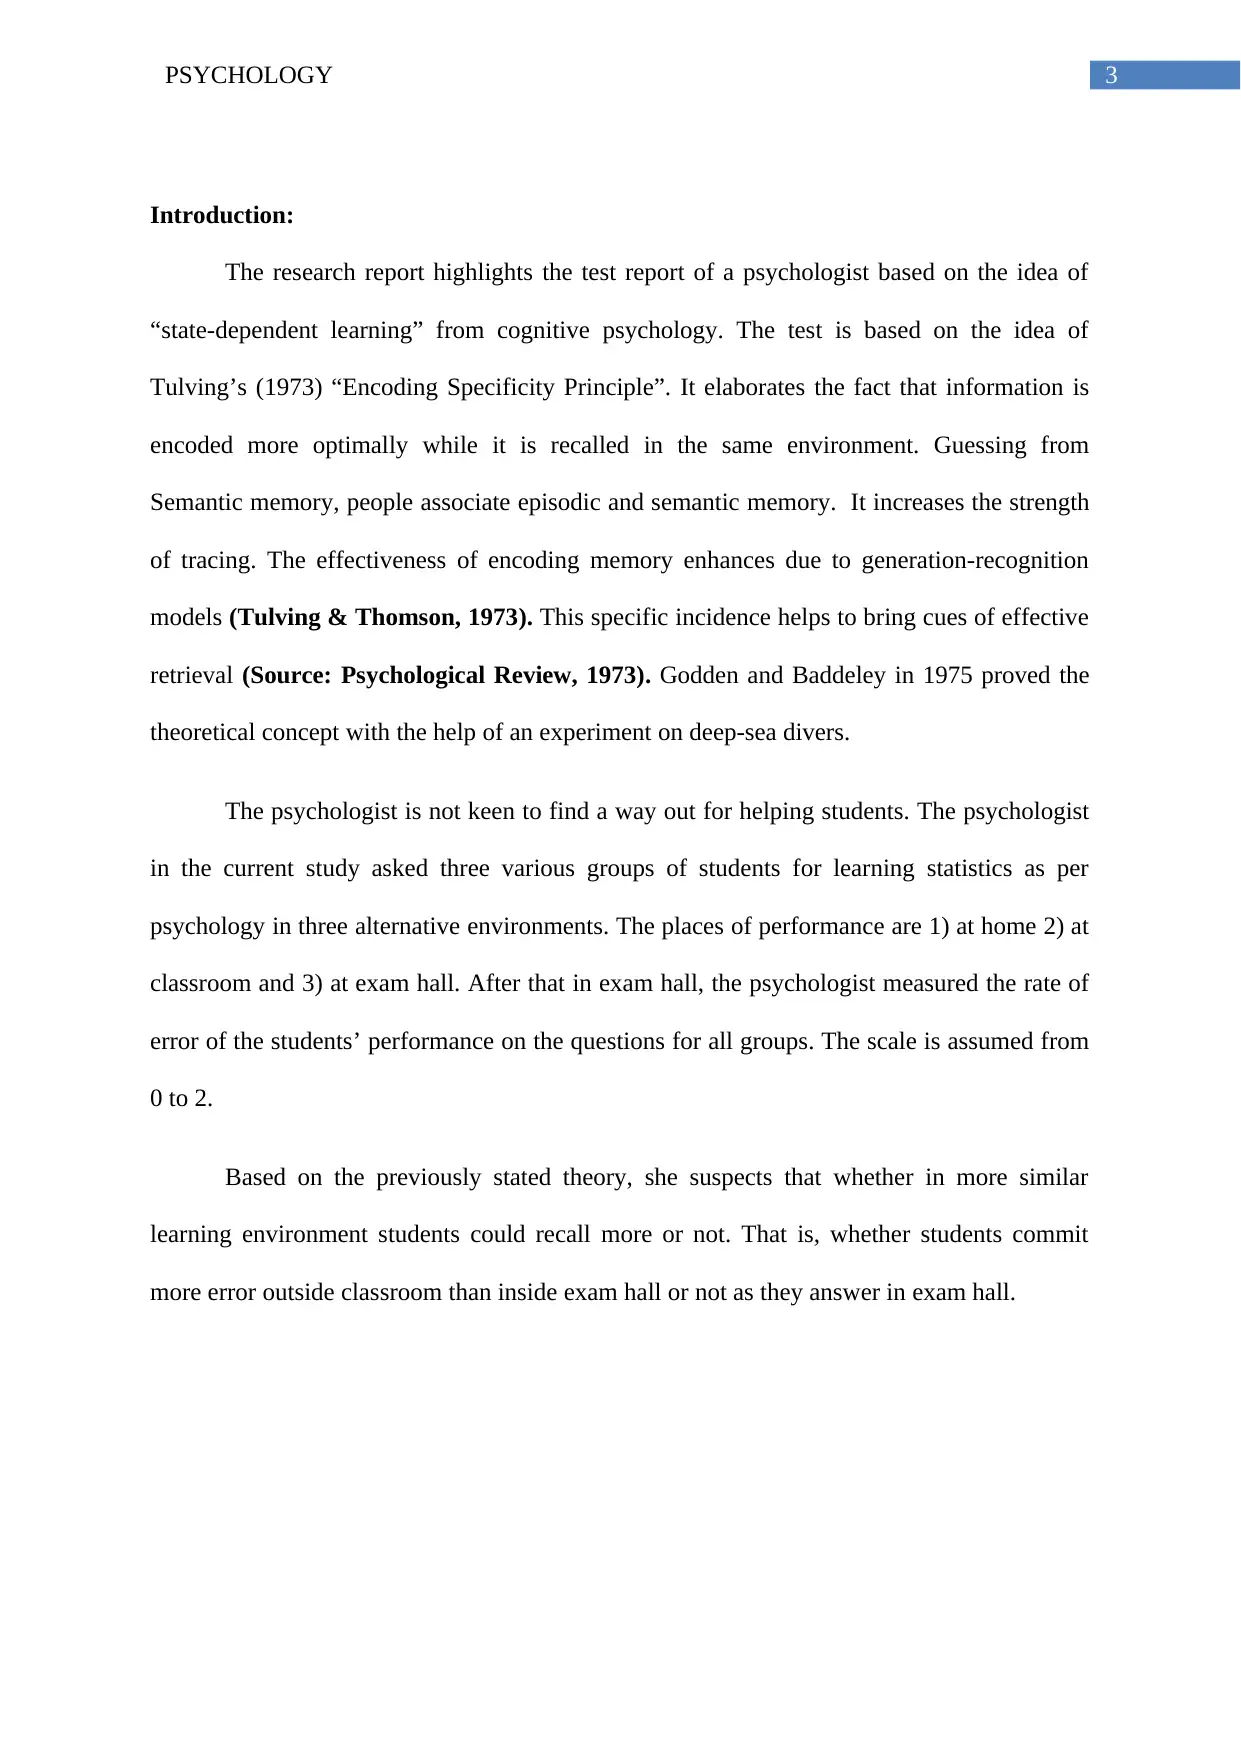
Introduction:
The research report highlights the test report of a psychologist based on the idea of
“state-dependent learning” from cognitive psychology. The test is based on the idea of
Tulving’s (1973) “Encoding Specificity Principle”. It elaborates the fact that information is
encoded more optimally while it is recalled in the same environment. Guessing from
Semantic memory, people associate episodic and semantic memory. It increases the strength
of tracing. The effectiveness of encoding memory enhances due to generation-recognition
models (Tulving & Thomson, 1973). This specific incidence helps to bring cues of effective
retrieval (Source: Psychological Review, 1973). Godden and Baddeley in 1975 proved the
theoretical concept with the help of an experiment on deep-sea divers.
The psychologist is not keen to find a way out for helping students. The psychologist
in the current study asked three various groups of students for learning statistics as per
psychology in three alternative environments. The places of performance are 1) at home 2) at
classroom and 3) at exam hall. After that in exam hall, the psychologist measured the rate of
error of the students’ performance on the questions for all groups. The scale is assumed from
0 to 2.
Based on the previously stated theory, she suspects that whether in more similar
learning environment students could recall more or not. That is, whether students commit
more error outside classroom than inside exam hall or not as they answer in exam hall.
Paraphrase This Document
Need a fresh take? Get an instant paraphrase of this document with our AI Paraphraser
4PSYCHOLOGY
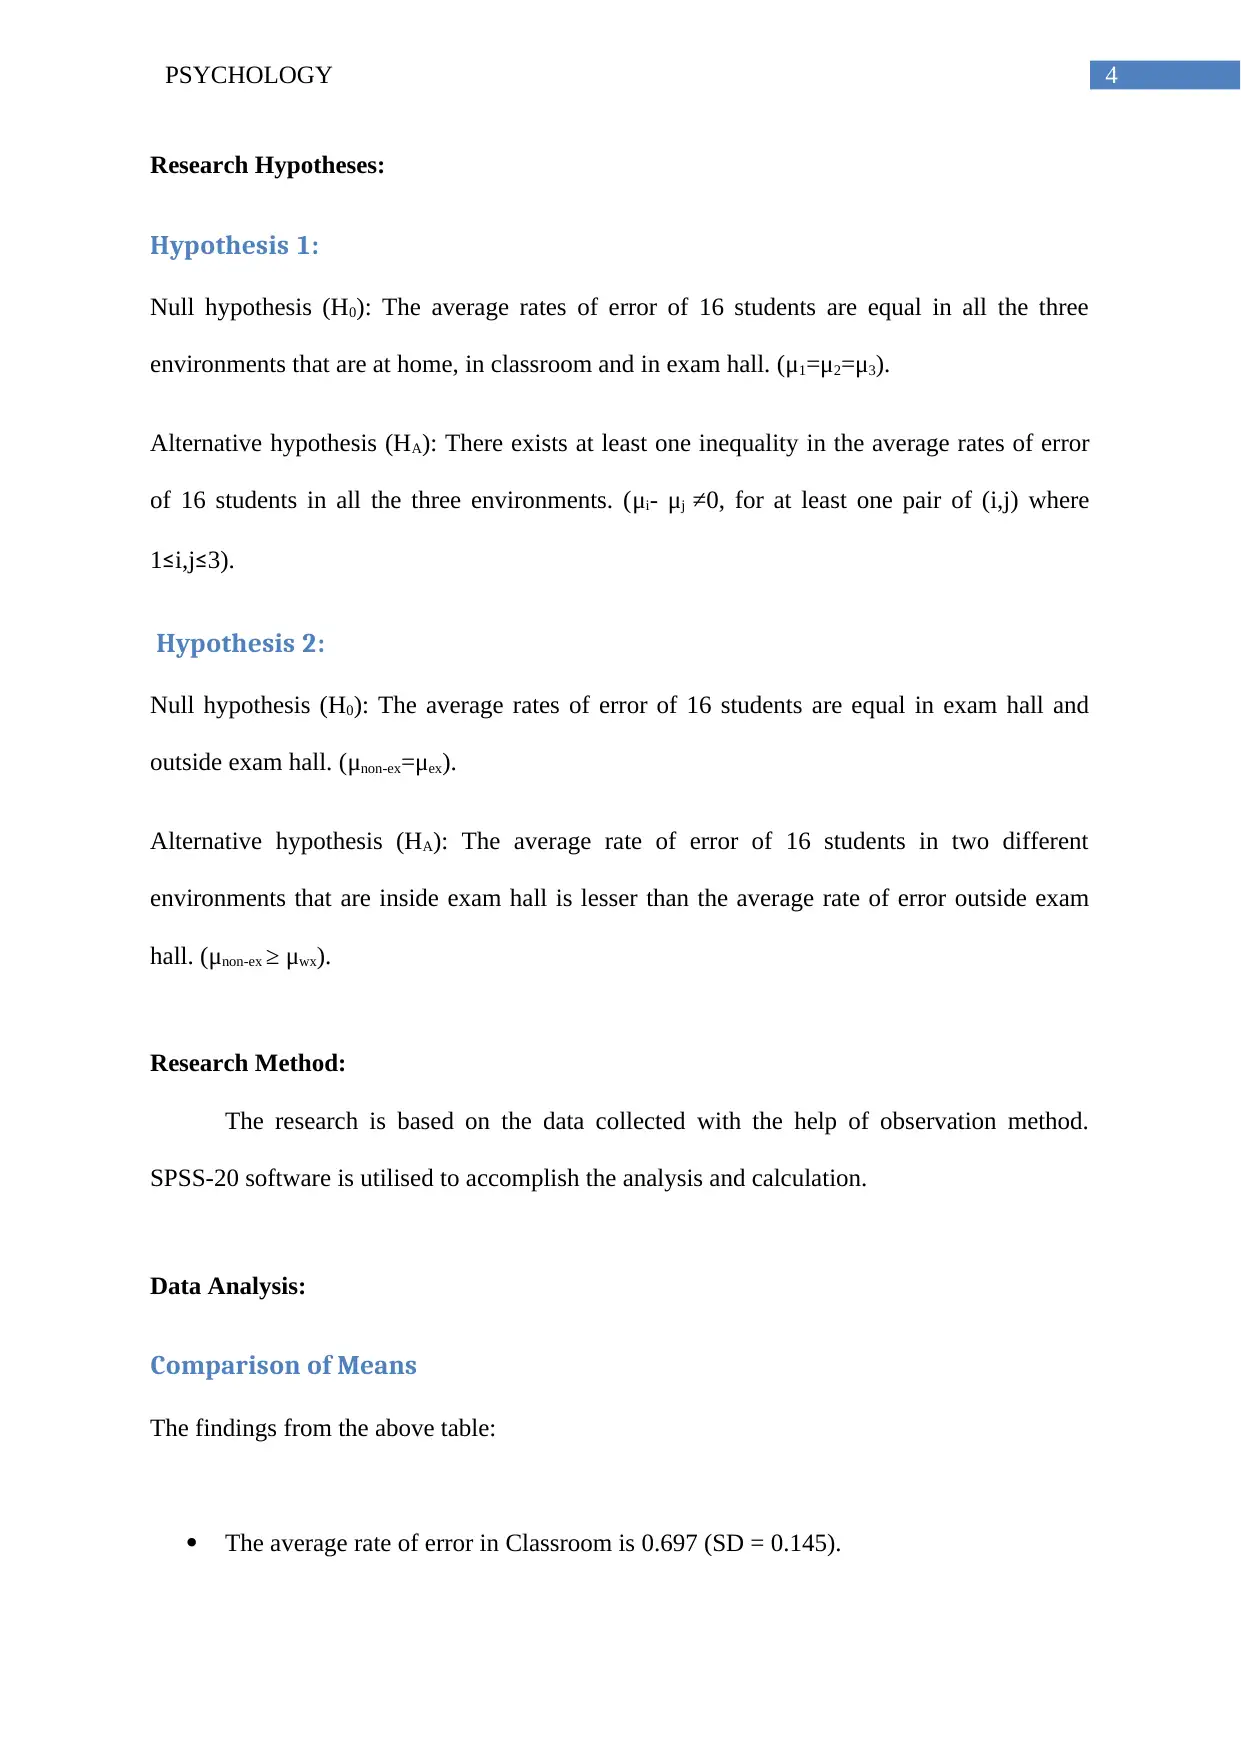
Research Hypotheses:
Hypothesis 1:
Null hypothesis (H0): The average rates of error of 16 students are equal in all the three
environments that are at home, in classroom and in exam hall. (μ1=μ2=μ3).
Alternative hypothesis (HA): There exists at least one inequality in the average rates of error
of 16 students in all the three environments. (μi- μj ≠0, for at least one pair of (i,j) where
1≤i,j≤3).
Hypothesis 2:
Null hypothesis (H0): The average rates of error of 16 students are equal in exam hall and
outside exam hall. (μnon-ex=μex).
Alternative hypothesis (HA): The average rate of error of 16 students in two different
environments that are inside exam hall is lesser than the average rate of error outside exam
hall. (μnon-ex ≥ μwx).
Research Method:
The research is based on the data collected with the help of observation method.
SPSS-20 software is utilised to accomplish the analysis and calculation.
Data Analysis:
Comparison of Means
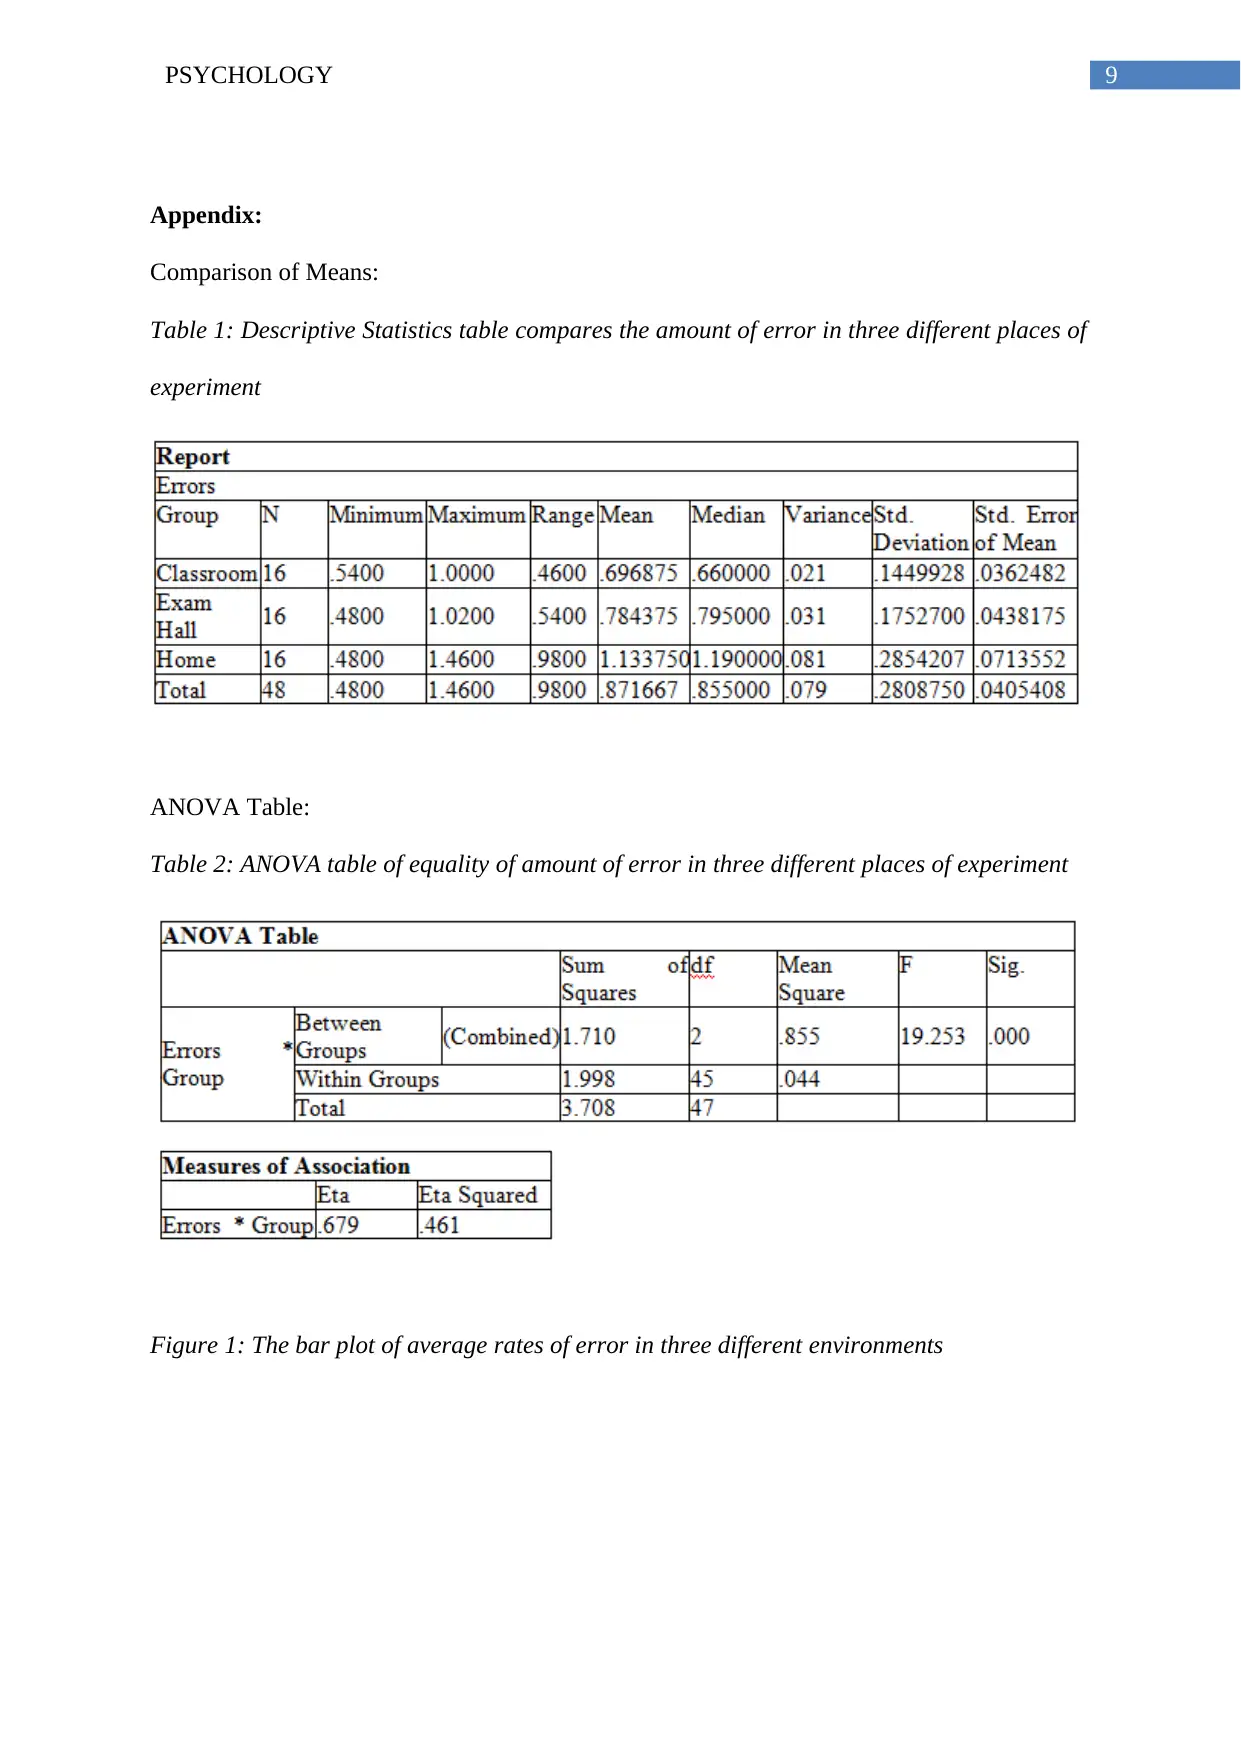
The findings from the above table:
The average rate of error in Classroom is 0.697 (SD = 0.145).
Research Hypotheses:
Hypothesis 1:
Null hypothesis (H0): The average rates of error of 16 students are equal in all the three
environments that are at home, in classroom and in exam hall. (μ1=μ2=μ3).
Alternative hypothesis (HA): There exists at least one inequality in the average rates of error
of 16 students in all the three environments. (μi- μj ≠0, for at least one pair of (i,j) where
1≤i,j≤3).
Hypothesis 2:
Null hypothesis (H0): The average rates of error of 16 students are equal in exam hall and
outside exam hall. (μnon-ex=μex).
Alternative hypothesis (HA): The average rate of error of 16 students in two different
environments that are inside exam hall is lesser than the average rate of error outside exam
hall. (μnon-ex ≥ μwx).
Research Method:
The research is based on the data collected with the help of observation method.
SPSS-20 software is utilised to accomplish the analysis and calculation.
Data Analysis:
Comparison of Means
The findings from the above table:
The average rate of error in Classroom is 0.697 (SD = 0.145).
5PSYCHOLOGY
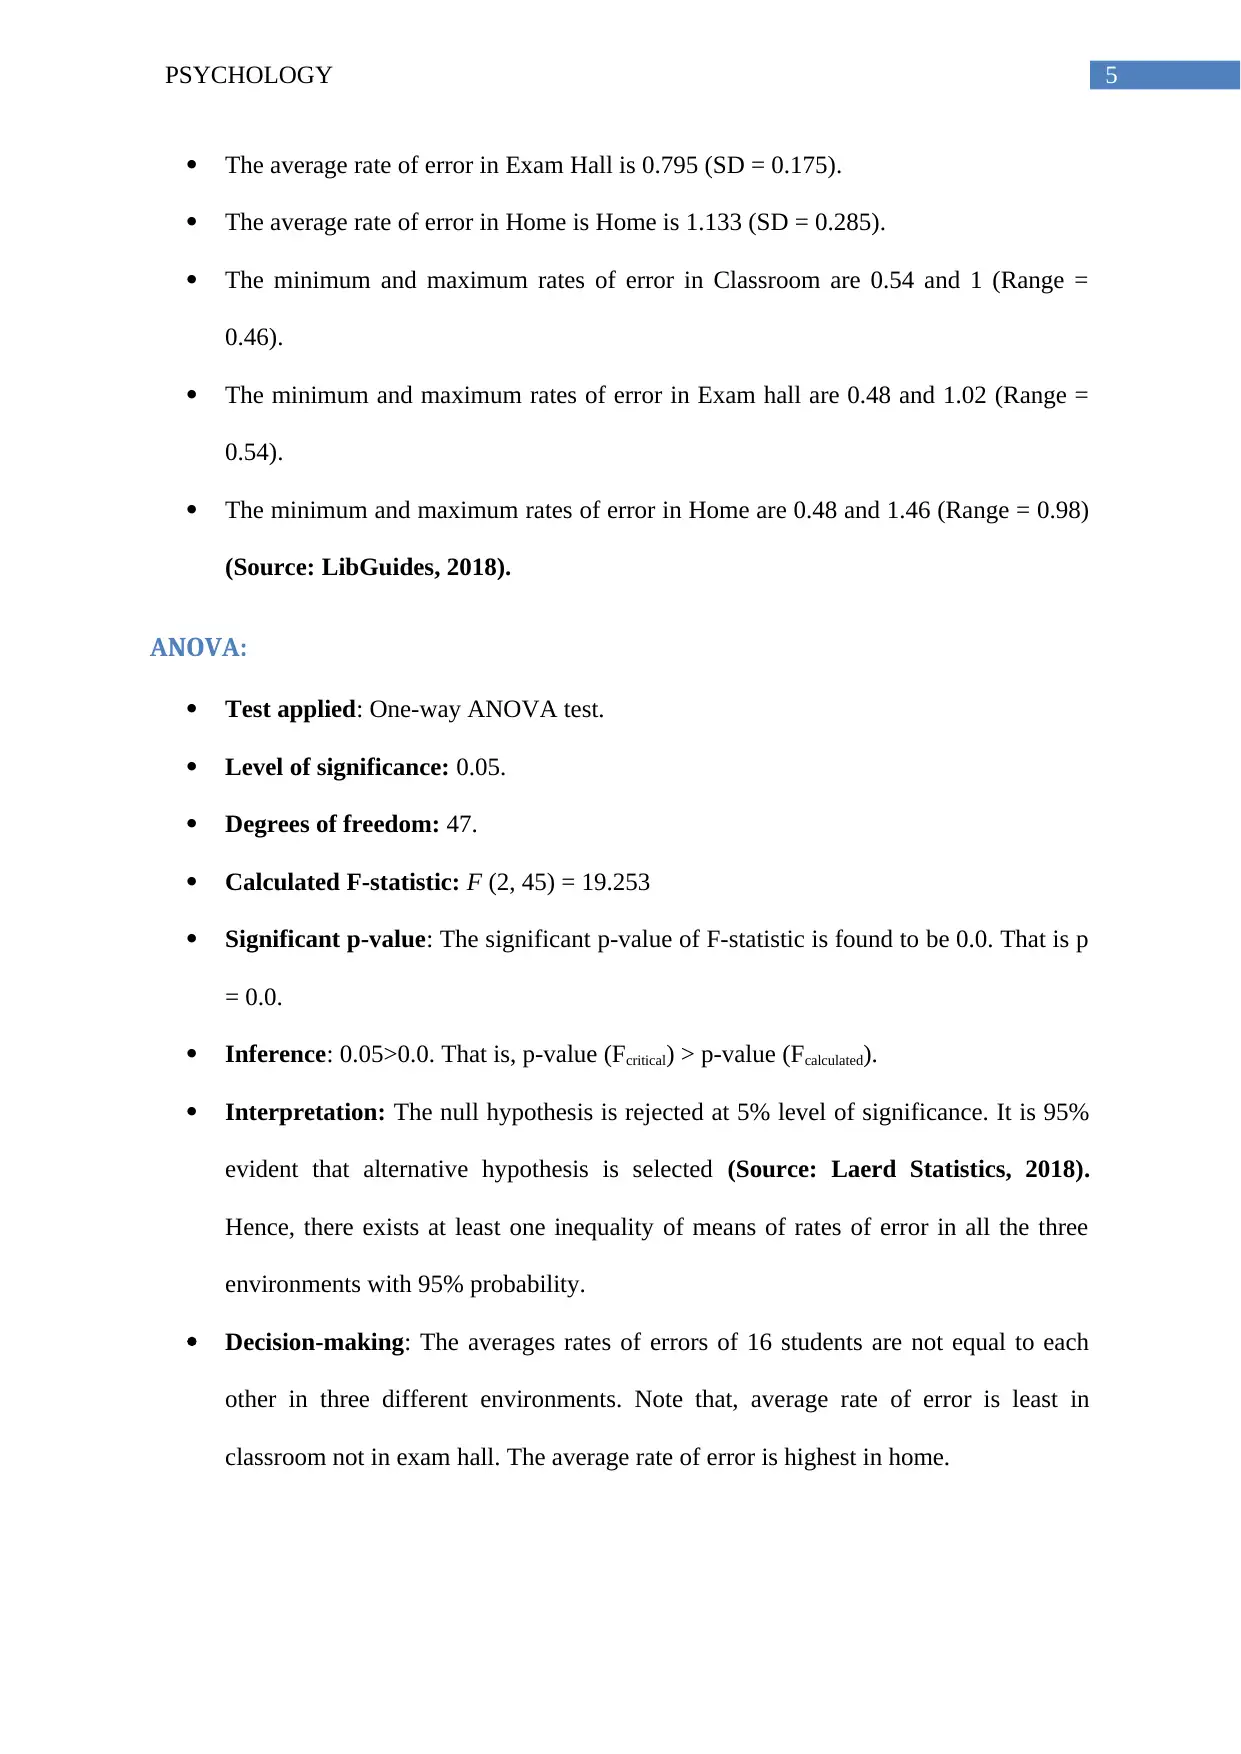
The average rate of error in Exam Hall is 0.795 (SD = 0.175).
The average rate of error in Home is Home is 1.133 (SD = 0.285).
The minimum and maximum rates of error in Classroom are 0.54 and 1 (Range =
0.46).
The minimum and maximum rates of error in Exam hall are 0.48 and 1.02 (Range =
0.54).
The minimum and maximum rates of error in Home are 0.48 and 1.46 (Range = 0.98)
(Source: LibGuides, 2018).
ANOVA:
Test applied: One-way ANOVA test.
Level of significance: 0.05.
Degrees of freedom: 47.
Calculated F-statistic: F (2, 45) = 19.253
Significant p-value: The significant p-value of F-statistic is found to be 0.0. That is p
= 0.0.
Inference: 0.05>0.0. That is, p-value (Fcritical) > p-value (Fcalculated).
Interpretation: The null hypothesis is rejected at 5% level of significance. It is 95%
evident that alternative hypothesis is selected (Source: Laerd Statistics, 2018).
Hence, there exists at least one inequality of means of rates of error in all the three
environments with 95% probability.
Decision-making: The averages rates of errors of 16 students are not equal to each
other in three different environments. Note that, average rate of error is least in
classroom not in exam hall. The average rate of error is highest in home.
⊘ This is a preview!⊘
Do you want full access?
Subscribe today to unlock all pages.
Trusted by 1+ million students worldwide
6PSYCHOLOGY
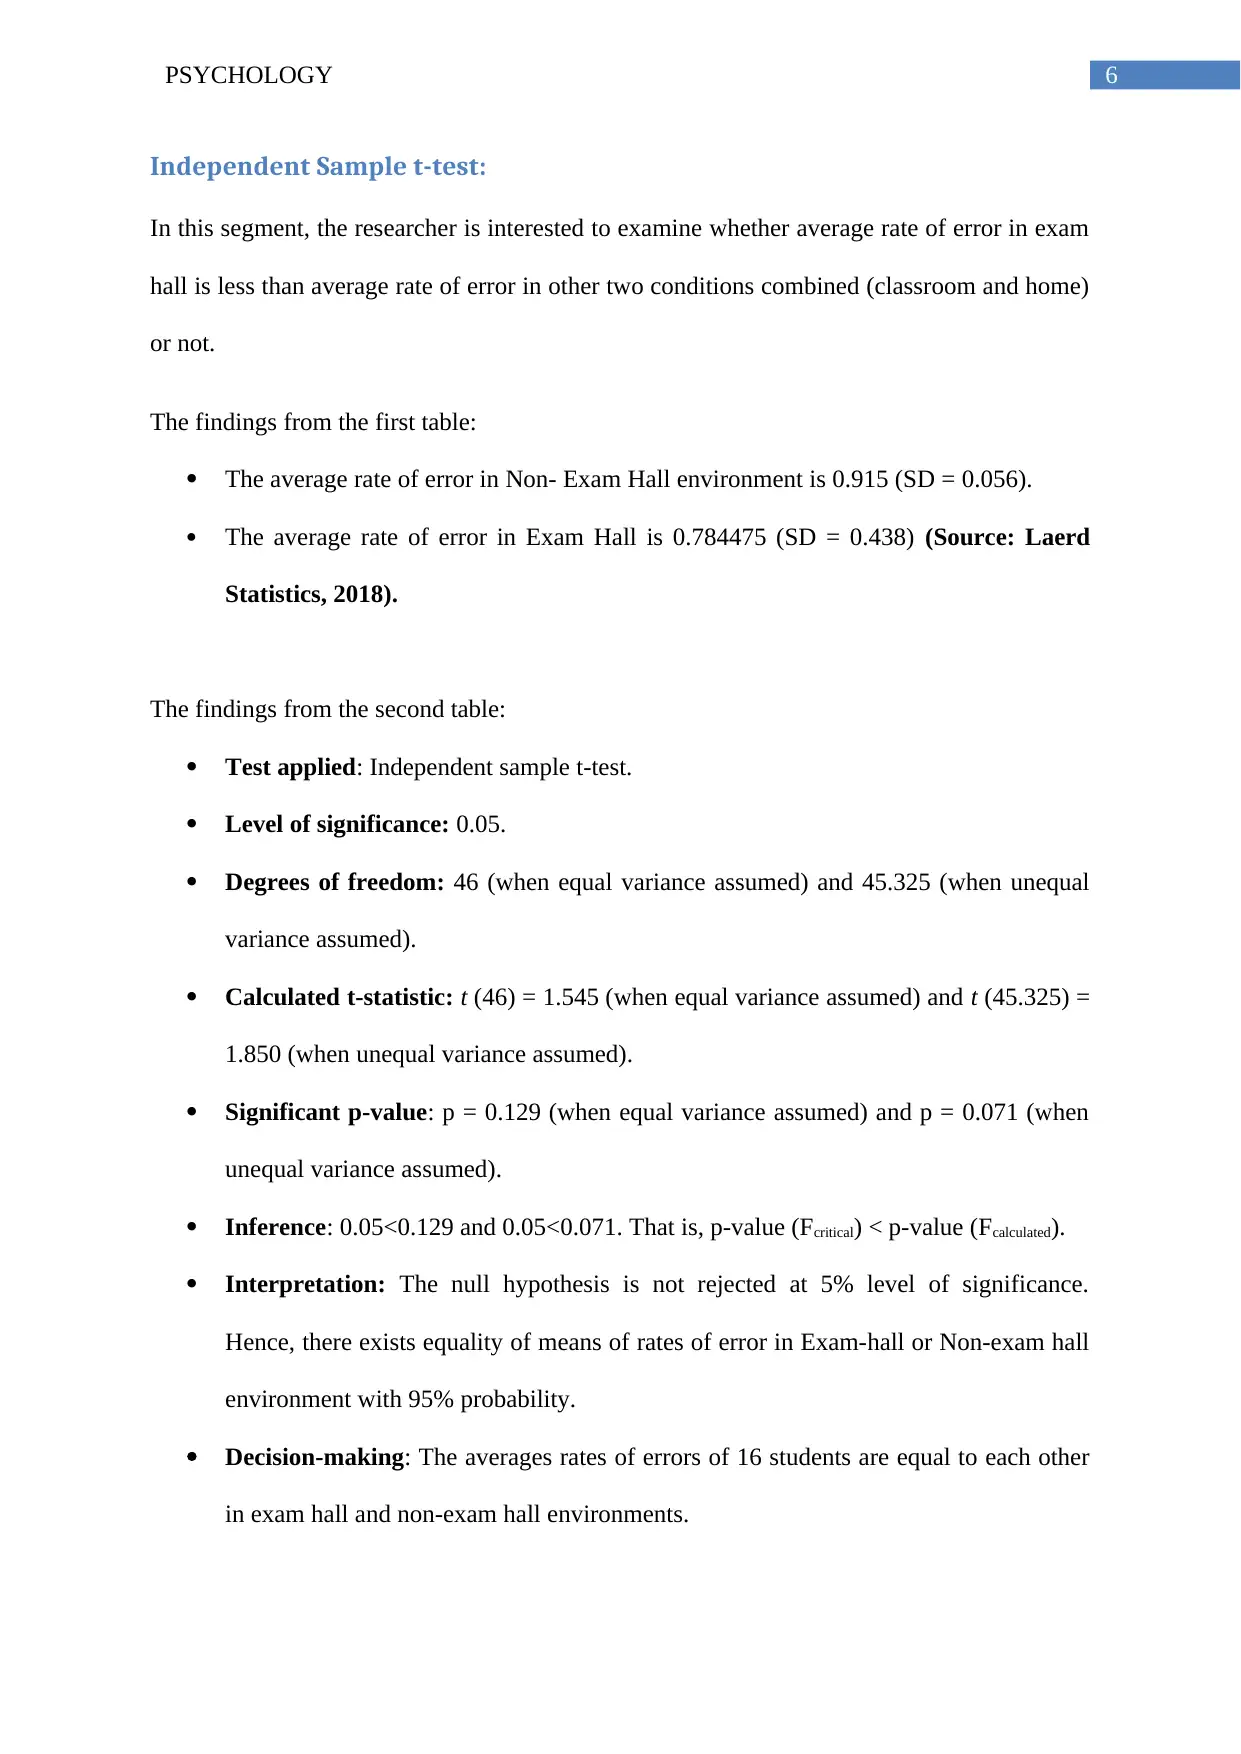
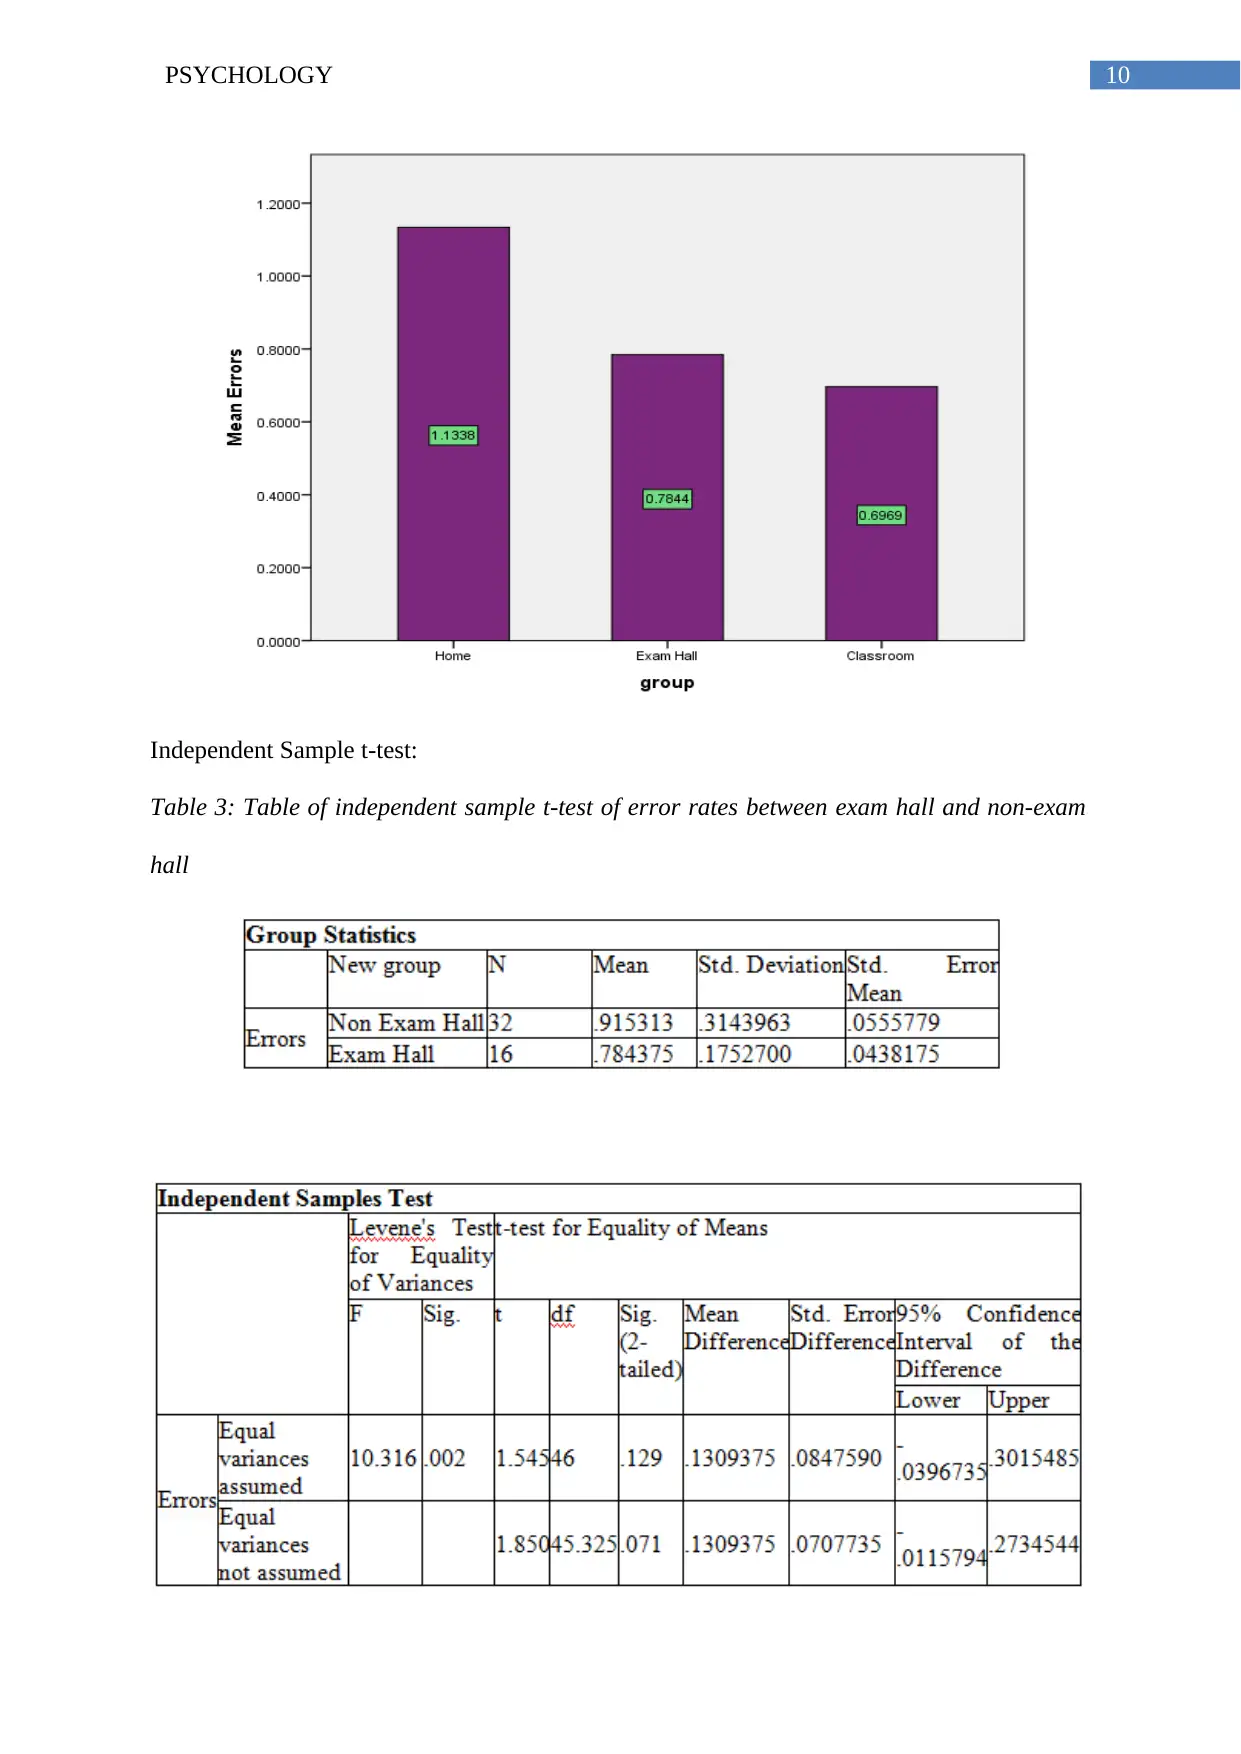
Independent Sample t-test:
In this segment, the researcher is interested to examine whether average rate of error in exam
hall is less than average rate of error in other two conditions combined (classroom and home)
or not.
The findings from the first table:
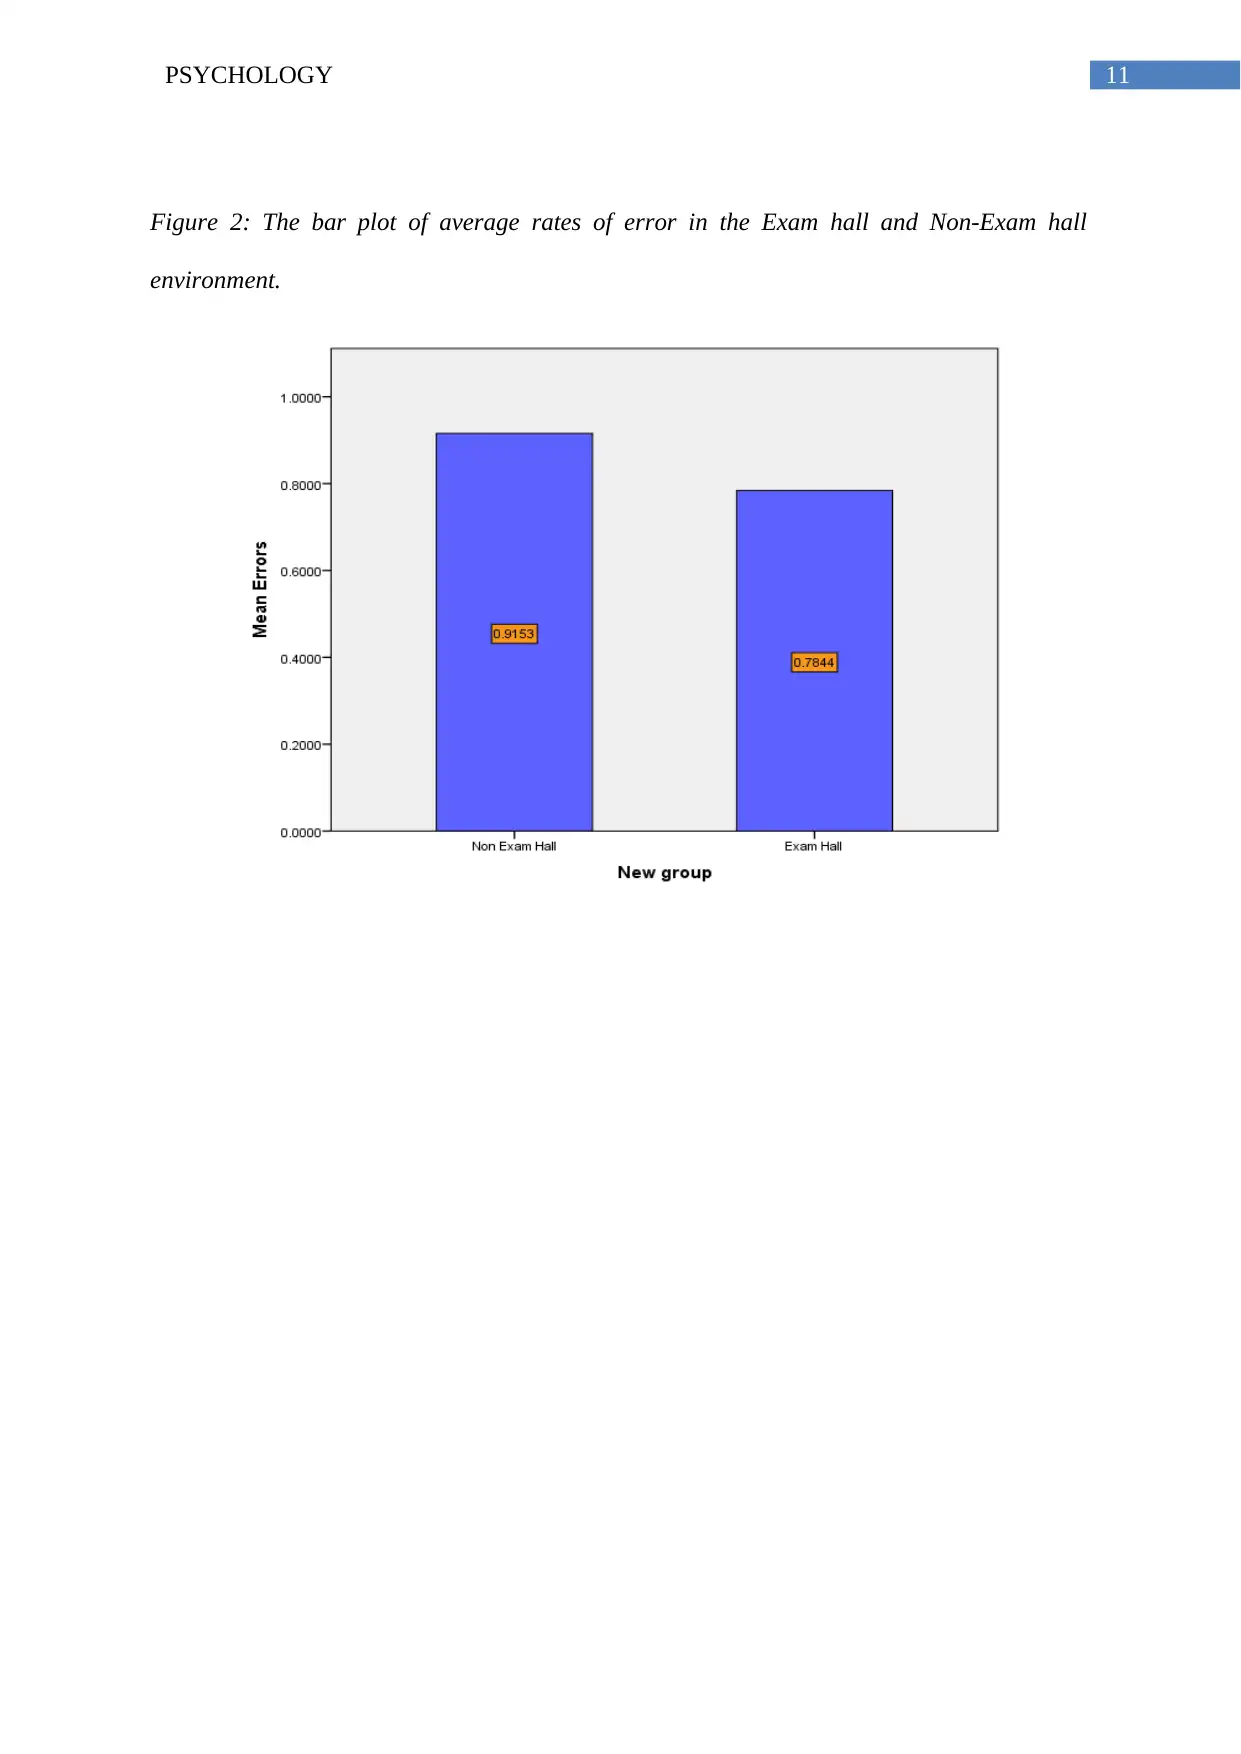
The average rate of error in Non- Exam Hall environment is 0.915 (SD = 0.056).
The average rate of error in Exam Hall is 0.784475 (SD = 0.438) (Source: Laerd
Statistics, 2018).
The findings from the second table:
Test applied: Independent sample t-test.
Level of significance: 0.05.
Degrees of freedom: 46 (when equal variance assumed) and 45.325 (when unequal
variance assumed).
Calculated t-statistic: t (46) = 1.545 (when equal variance assumed) and t (45.325) =
1.850 (when unequal variance assumed).
Significant p-value: p = 0.129 (when equal variance assumed) and p = 0.071 (when
unequal variance assumed).
Inference: 0.05<0.129 and 0.05<0.071. That is, p-value (Fcritical) < p-value (Fcalculated).
Interpretation: The null hypothesis is not rejected at 5% level of significance.
Hence, there exists equality of means of rates of error in Exam-hall or Non-exam hall
environment with 95% probability.
Decision-making: The averages rates of errors of 16 students are equal to each other
in exam hall and non-exam hall environments.
Independent Sample t-test:
In this segment, the researcher is interested to examine whether average rate of error in exam
hall is less than average rate of error in other two conditions combined (classroom and home)
or not.
The findings from the first table:
The average rate of error in Non- Exam Hall environment is 0.915 (SD = 0.056).
The average rate of error in Exam Hall is 0.784475 (SD = 0.438) (Source: Laerd
Statistics, 2018).
The findings from the second table:
Test applied: Independent sample t-test.
Level of significance: 0.05.
Degrees of freedom: 46 (when equal variance assumed) and 45.325 (when unequal
variance assumed).
Calculated t-statistic: t (46) = 1.545 (when equal variance assumed) and t (45.325) =
1.850 (when unequal variance assumed).
Significant p-value: p = 0.129 (when equal variance assumed) and p = 0.071 (when
unequal variance assumed).
Inference: 0.05<0.129 and 0.05<0.071. That is, p-value (Fcritical) < p-value (Fcalculated).
Interpretation: The null hypothesis is not rejected at 5% level of significance.
Hence, there exists equality of means of rates of error in Exam-hall or Non-exam hall
environment with 95% probability.
Decision-making: The averages rates of errors of 16 students are equal to each other
in exam hall and non-exam hall environments.
Paraphrase This Document
Need a fresh take? Get an instant paraphrase of this document with our AI Paraphraser
7PSYCHOLOGY
Conclusion:
The data analysis refers that the rate of error is not least while students answer
question in exam hall. More of it, students perform better in classroom. When researcher
considered exam hall as an environment and non-exam hall as another environment
(collaborating both classroom and home), she found that the rates of error in both the
conditions are almost equal.
Therefore, the idea of Tulving’s (1973) “Encoding Specificity Principle” is not
followed here in the small experiment.
Recommendation:
The analysis of a data having larger amount of data that is more than 100 samples
might establish the “Encoding Specificity Principle” (Hargittai, 2015).
8PSYCHOLOGY
Reference:
Alicekim.ca. (2018). Encoding Specificity and Retrieval Process in Episodic Memory. from
http://alicekim.ca/9.ESP73.pdf
Laerd Statistics. (2018). Independent t-test in SPSS Statistics - Procedure, output and
interpretation of the output using a relevant example | Statistics.laerd.com. from
https://statistics.laerd.com/spss-tutorials/independent-t-test-using-spss-statistics.php
Libguides.library.kent.edu. (2018). LibGuides: SPSS Tutorials: Descriptive Stats by Group
(Compare Means). from https://libguides.library.kent.edu/SPSS/CompareMeans
Statistics.laerd.com. (2018). One-way ANOVA in SPSS Statistics - Step-by-step procedure
including testing of assumptions.. from https://statistics.laerd.com/spss-tutorials/one-
way-anova-using-spss-statistics.php
Hargittai, E. (2015). Is bigger always better? Potential biases of big data derived from social
network sites. The ANNALS of the American Academy of Political and Social
Science, 659(1), 63-76.
Tulving, E., & Thomson, D. M. (1973). Encoding specificity and retrieval processes in
episodic memory. Psychological review, 80(5), 352.
⊘ This is a preview!⊘
Do you want full access?
Subscribe today to unlock all pages.
Trusted by 1+ million students worldwide
9PSYCHOLOGY
Appendix:
Comparison of Means:
Table 1: Descriptive Statistics table compares the amount of error in three different places of
experiment
ANOVA Table:
Table 2: ANOVA table of equality of amount of error in three different places of experiment
Figure 1: The bar plot of average rates of error in three different environments
Paraphrase This Document
Need a fresh take? Get an instant paraphrase of this document with our AI Paraphraser
10PSYCHOLOGY
Independent Sample t-test:
Table 3: Table of independent sample t-test of error rates between exam hall and non-exam
hall
Independent Sample t-test:
Table 3: Table of independent sample t-test of error rates between exam hall and non-exam
hall
11PSYCHOLOGY
Figure 2: The bar plot of average rates of error in the Exam hall and Non-Exam hall
environment.
Figure 2: The bar plot of average rates of error in the Exam hall and Non-Exam hall
environment.
⊘ This is a preview!⊘
Do you want full access?
Subscribe today to unlock all pages.
Trusted by 1+ million students worldwide
1 out of 12
Your All-in-One AI-Powered Toolkit for Academic Success.
+13062052269
info@desklib.com
Available 24*7 on WhatsApp / Email
![[object Object]](/_next/static/media/star-bottom.7253800d.svg)
Unlock your academic potential
Copyright © 2020–2026 A2Z Services. All Rights Reserved. Developed and managed by ZUCOL.