Statistical Analysis and Regression Model of Psychological Datasets
VerifiedAdded on 2022/09/01
|5
|510
|16
Report
AI Summary
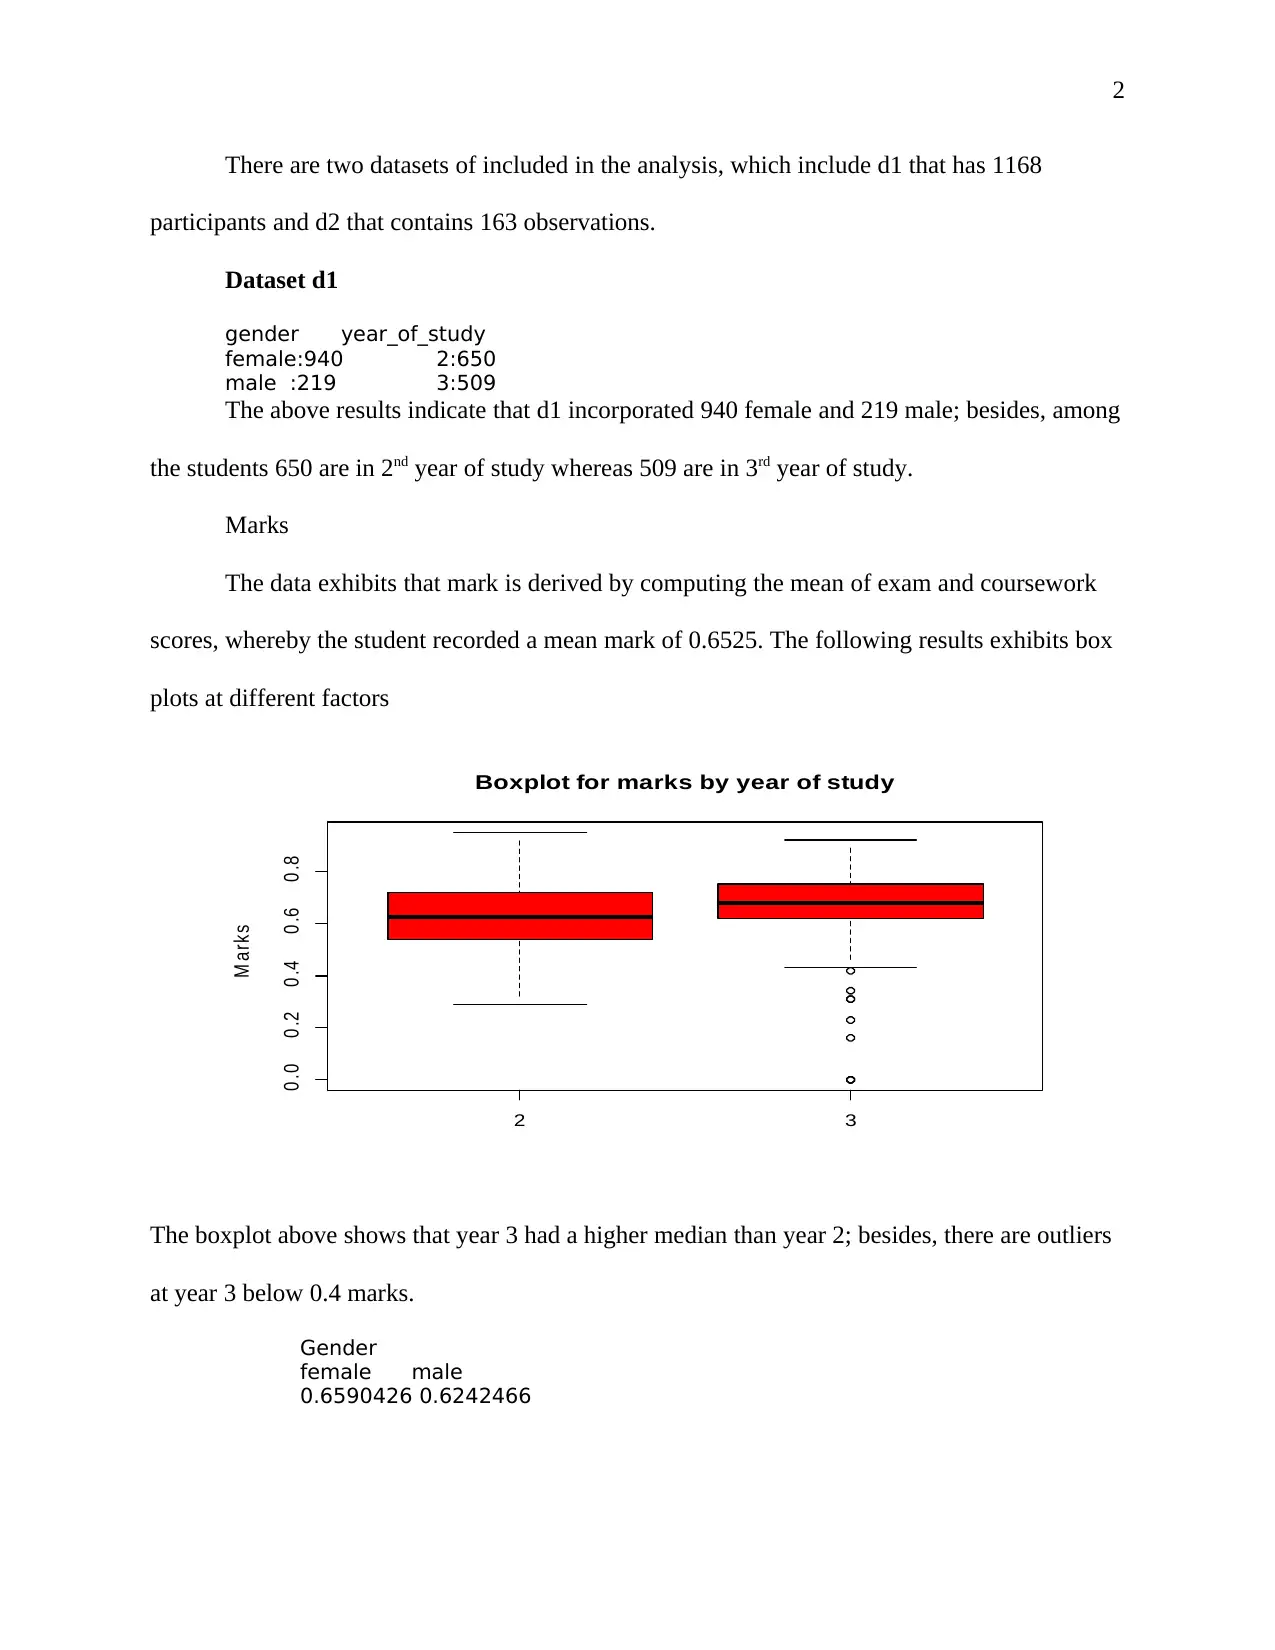
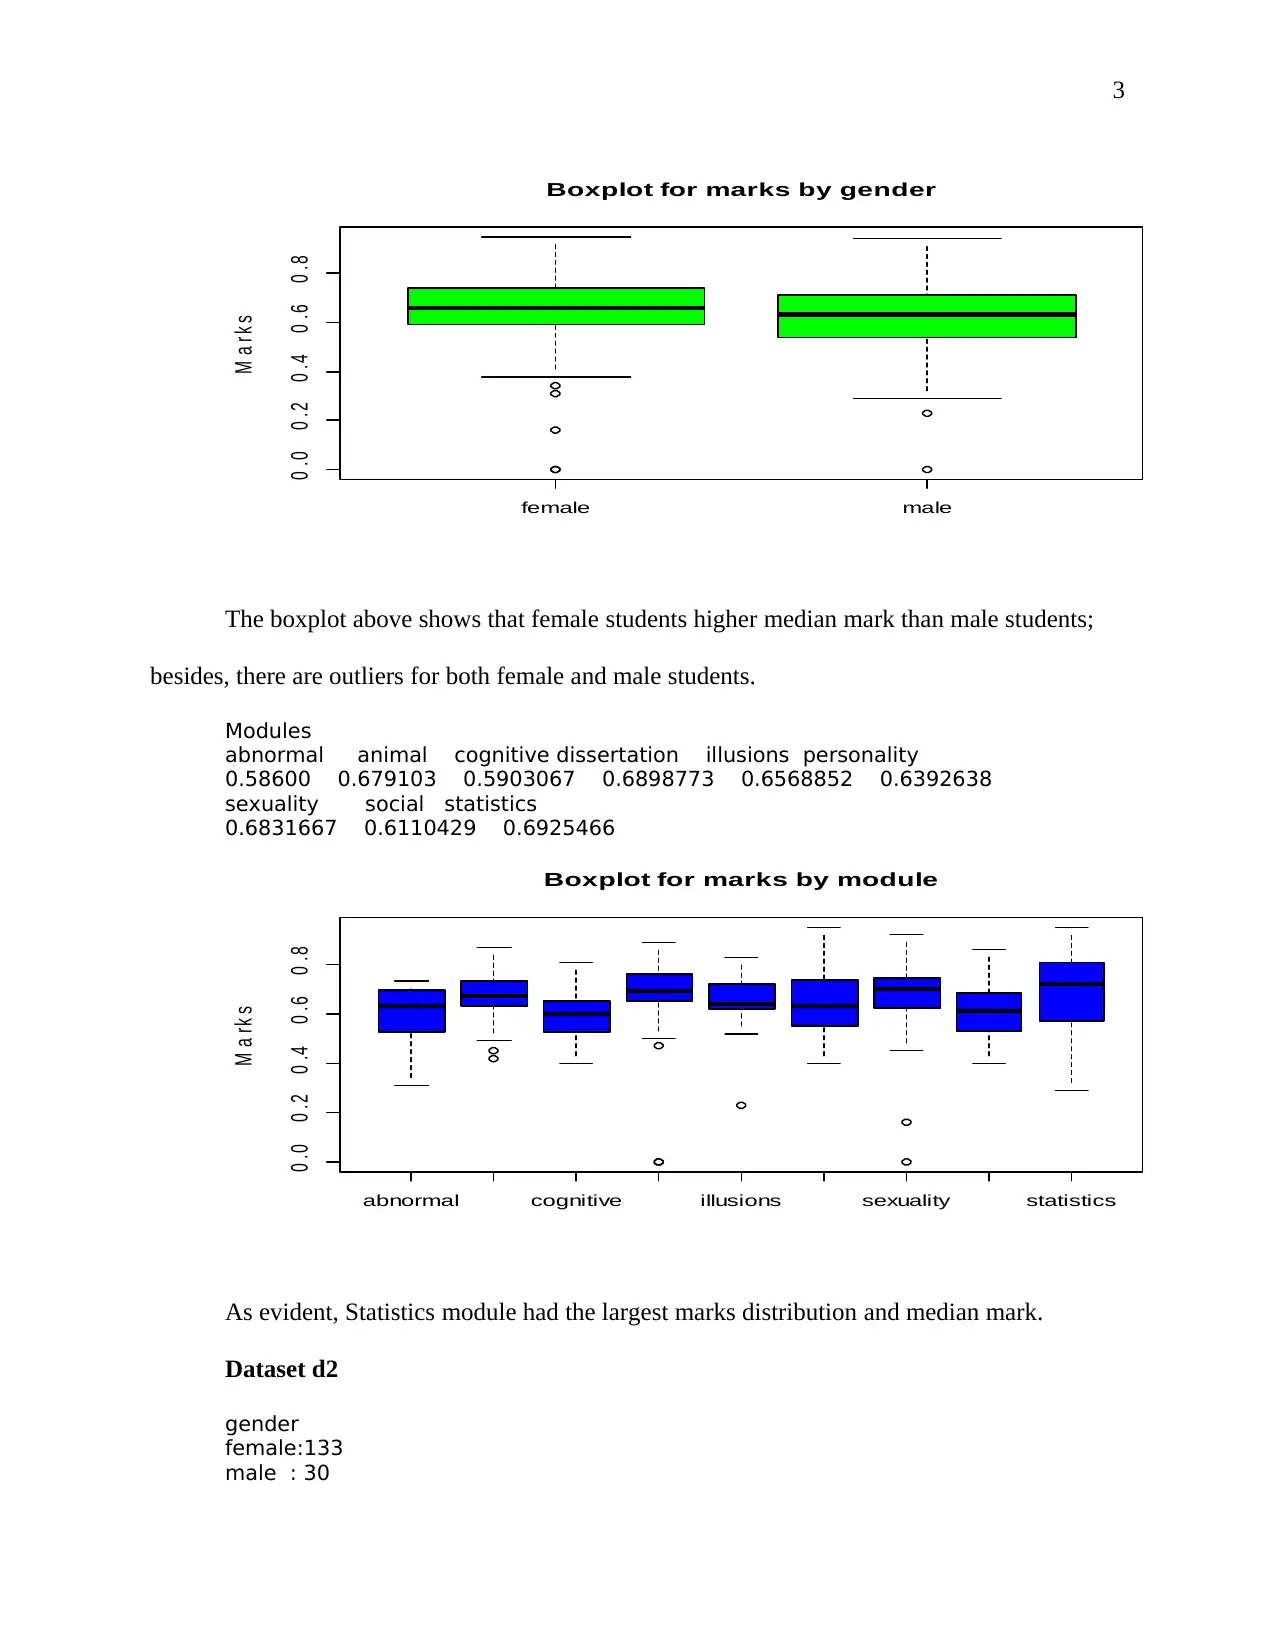
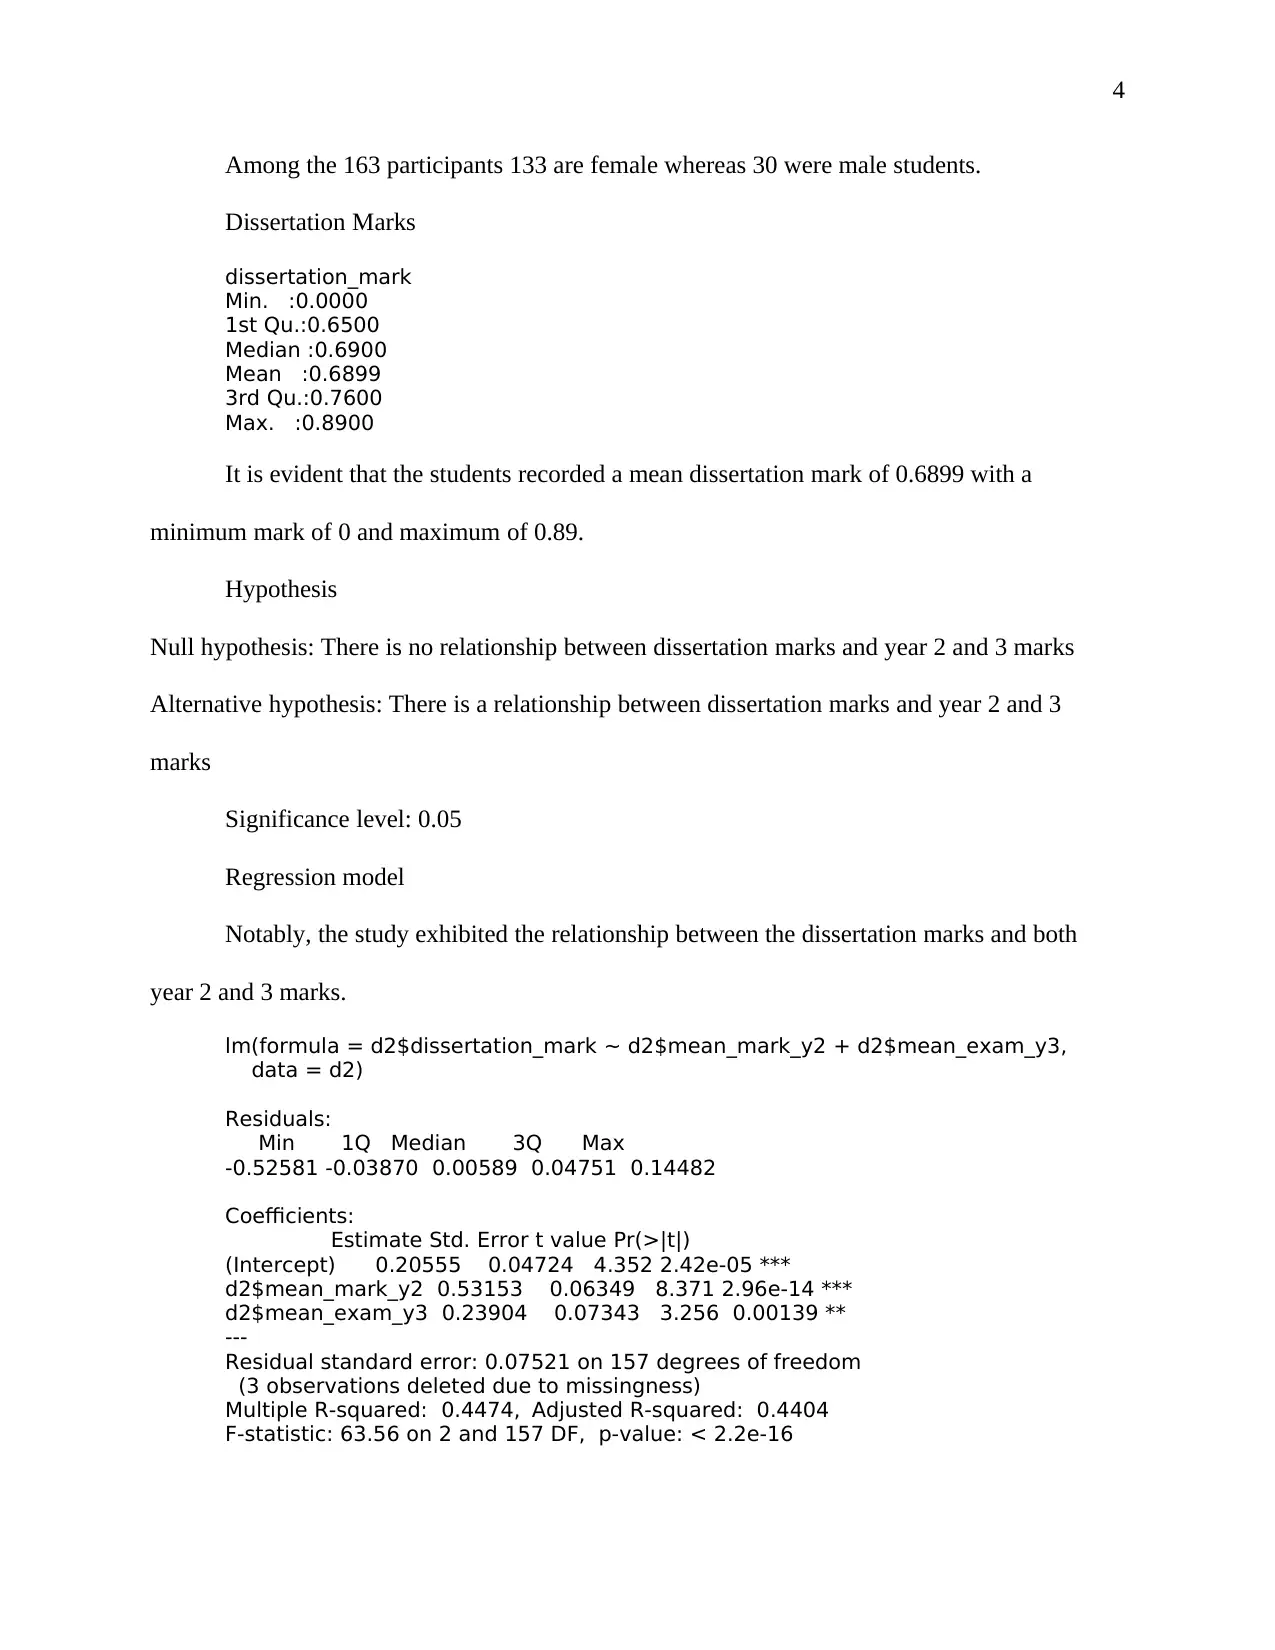
This report presents a statistical analysis of two psychological datasets, d1 and d2. Dataset d1, comprising 1168 participants, explores the relationship between gender, year of study, and mean marks across various modules. Descriptive statistics, including box plots, are used to visualize data dist...

1
Psychological Report
Name:
Institution:
Psychological Report
Name:
Institution:
Paraphrase This Document
Need a fresh take? Get an instant paraphrase of this document with our AI Paraphraser

2
There are two datasets of included in the analysis, which include d1 that has 1168
participants and d2 that contains 163 observations.
Dataset d1
gender year_of_study
female:940 2:650
male :219 3:509
The above results indicate that d1 incorporated 940 female and 219 male; besides, among
the students 650 are in 2nd year of study whereas 509 are in 3rd year of study.
Marks
The data exhibits that mark is derived by computing the mean of exam and coursework
scores, whereby the student recorded a mean mark of 0.6525. The following results exhibits box
plots at different factors
2 3
0 .0 0 .2 0 .4 0 .6 0 .8
Boxplot for marks by year of study
M a rk s
The boxplot above shows that year 3 had a higher median than year 2; besides, there are outliers
at year 3 below 0.4 marks.
Gender
female male
0.6590426 0.6242466

3
female male
0 .0 0 .2 0 .4 0 .6 0 .8
Boxplot for marks by gender
M a r k s
The boxplot above shows that female students higher median mark than male students;
besides, there are outliers for both female and male students.
Modules
abnormal animal cognitive dissertation illusions personality
0.58600 0.679103 0.5903067 0.6898773 0.6568852 0.6392638
sexuality social statistics
0.6831667 0.6110429 0.6925466
abnormal cognitive illusions sexuality statistics
0 .0 0 .2 0 .4 0 .6 0 .8
Boxplot for marks by module
M a r k s
As evident, Statistics module had the largest marks distribution and median mark.
Dataset d2
gender
female:133
male : 30
⊘ This is a preview!⊘
Do you want full access?
Subscribe today to unlock all pages.

Trusted by 1+ million students worldwide

4
Among the 163 participants 133 are female whereas 30 were male students.
Dissertation Marks
dissertation_mark
Min. :0.0000
1st Qu.:0.6500
Median :0.6900
Mean :0.6899
3rd Qu.:0.7600
Max. :0.8900
It is evident that the students recorded a mean dissertation mark of 0.6899 with a
minimum mark of 0 and maximum of 0.89.
Hypothesis
Null hypothesis: There is no relationship between dissertation marks and year 2 and 3 marks
Alternative hypothesis: There is a relationship between dissertation marks and year 2 and 3
marks
Significance level: 0.05
Regression model
Notably, the study exhibited the relationship between the dissertation marks and both
year 2 and 3 marks.
lm(formula = d2$dissertation_mark ~ d2$mean_mark_y2 + d2$mean_exam_y3,
data = d2)
Residuals:
Min 1Q Median 3Q Max
-0.52581 -0.03870 0.00589 0.04751 0.14482
Coefficients:
Estimate Std. Error t value Pr(>|t|)
(Intercept) 0.20555 0.04724 4.352 2.42e-05 ***
d2$mean_mark_y2 0.53153 0.06349 8.371 2.96e-14 ***
d2$mean_exam_y3 0.23904 0.07343 3.256 0.00139 **
---
Residual standard error: 0.07521 on 157 degrees of freedom
(3 observations deleted due to missingness)
Multiple R-squared: 0.4474, Adjusted R-squared: 0.4404
F-statistic: 63.56 on 2 and 157 DF, p-value: < 2.2e-16
Paraphrase This Document
Need a fresh take? Get an instant paraphrase of this document with our AI Paraphraser

5
As evident, the model recorded r square value of 0.4474 thus the variation in dissertation marks
is explained by the model at 44.74%. Consequently, the model had p-value of 2.2e-16 which is
less than 0.05 thus the model is adequate. Therefore, the null hypothesis is rejected and we
conclude that there is a relationship between dissertation marks and year 2 and 3 marks
1 out of 5

Your All-in-One AI-Powered Toolkit for Academic Success.
+13062052269
info@desklib.com
Available 24*7 on WhatsApp / Email
Unlock your academic potential
© 2024 | Zucol Services PVT LTD | All rights reserved.