Analysis of Blood Pressure Predictors: A Psychology Research Report
VerifiedAdded on 2023/06/10
|14
|3492
|353
Report
AI Summary
This report, focusing on research methods in psychology, investigates the prediction of future blood pressure based on various psychological factors. It begins with an introduction outlining the study's objective: to determine the key factors influencing blood pressure, incorporating new variables like anxiety and sensation seeking into existing data. The main body details the research question, justifying the use of multiple linear regression analysis to assess the impact of these new scales. The report presents and interprets regression outputs, including model summaries, ANOVA tables, and coefficient analyses, to determine the significance of each predictor. It examines the model's performance, reporting R, R-squared values, and confidence intervals to assess the strength of the relationships between variables. The report also considers each predictor individually, identifying the influence of each factor on future blood pressure and formulating an equation for prediction. Furthermore, it ranks predictors based on their influence, presents correlation analyses, and discusses the assumptions of regression analysis. The findings indicate that anxiety, current blood pressure, sensation seeking, and neuroticism significantly impact future blood pressure, while depression shows no significant effect. The report concludes with a discussion of the findings, emphasizing the practical implications of predicting future blood pressure using psychological variables.
Research Methods in
Psychology Statistics
Psychology Statistics
Paraphrase This Document
Need a fresh take? Get an instant paraphrase of this document with our AI Paraphraser
TABLE OF CONTENTS
INTRODUCTION...........................................................................................................................3
MAIN BODY...................................................................................................................................3
a) Research question and the use of appropriate regression model............................................3
b) Regression output...................................................................................................................4
c) Reporting main statistics from the regression model..............................................................5
d) Based on the analysis inferring the model’s performance......................................................5
e) Considering each of the predictor individually.......................................................................7
f) Equation of the predicted future blood pressure......................................................................8
g) Ranking all the predictors based upon the influence Future Blood Pressure.........................8
h) Correlation..............................................................................................................................9
i) Assumptions of regression analysis.......................................................................................10
j) Discussion relating to the findings........................................................................................10
CONCLUSION..............................................................................................................................12
REFERENCES..............................................................................................................................13
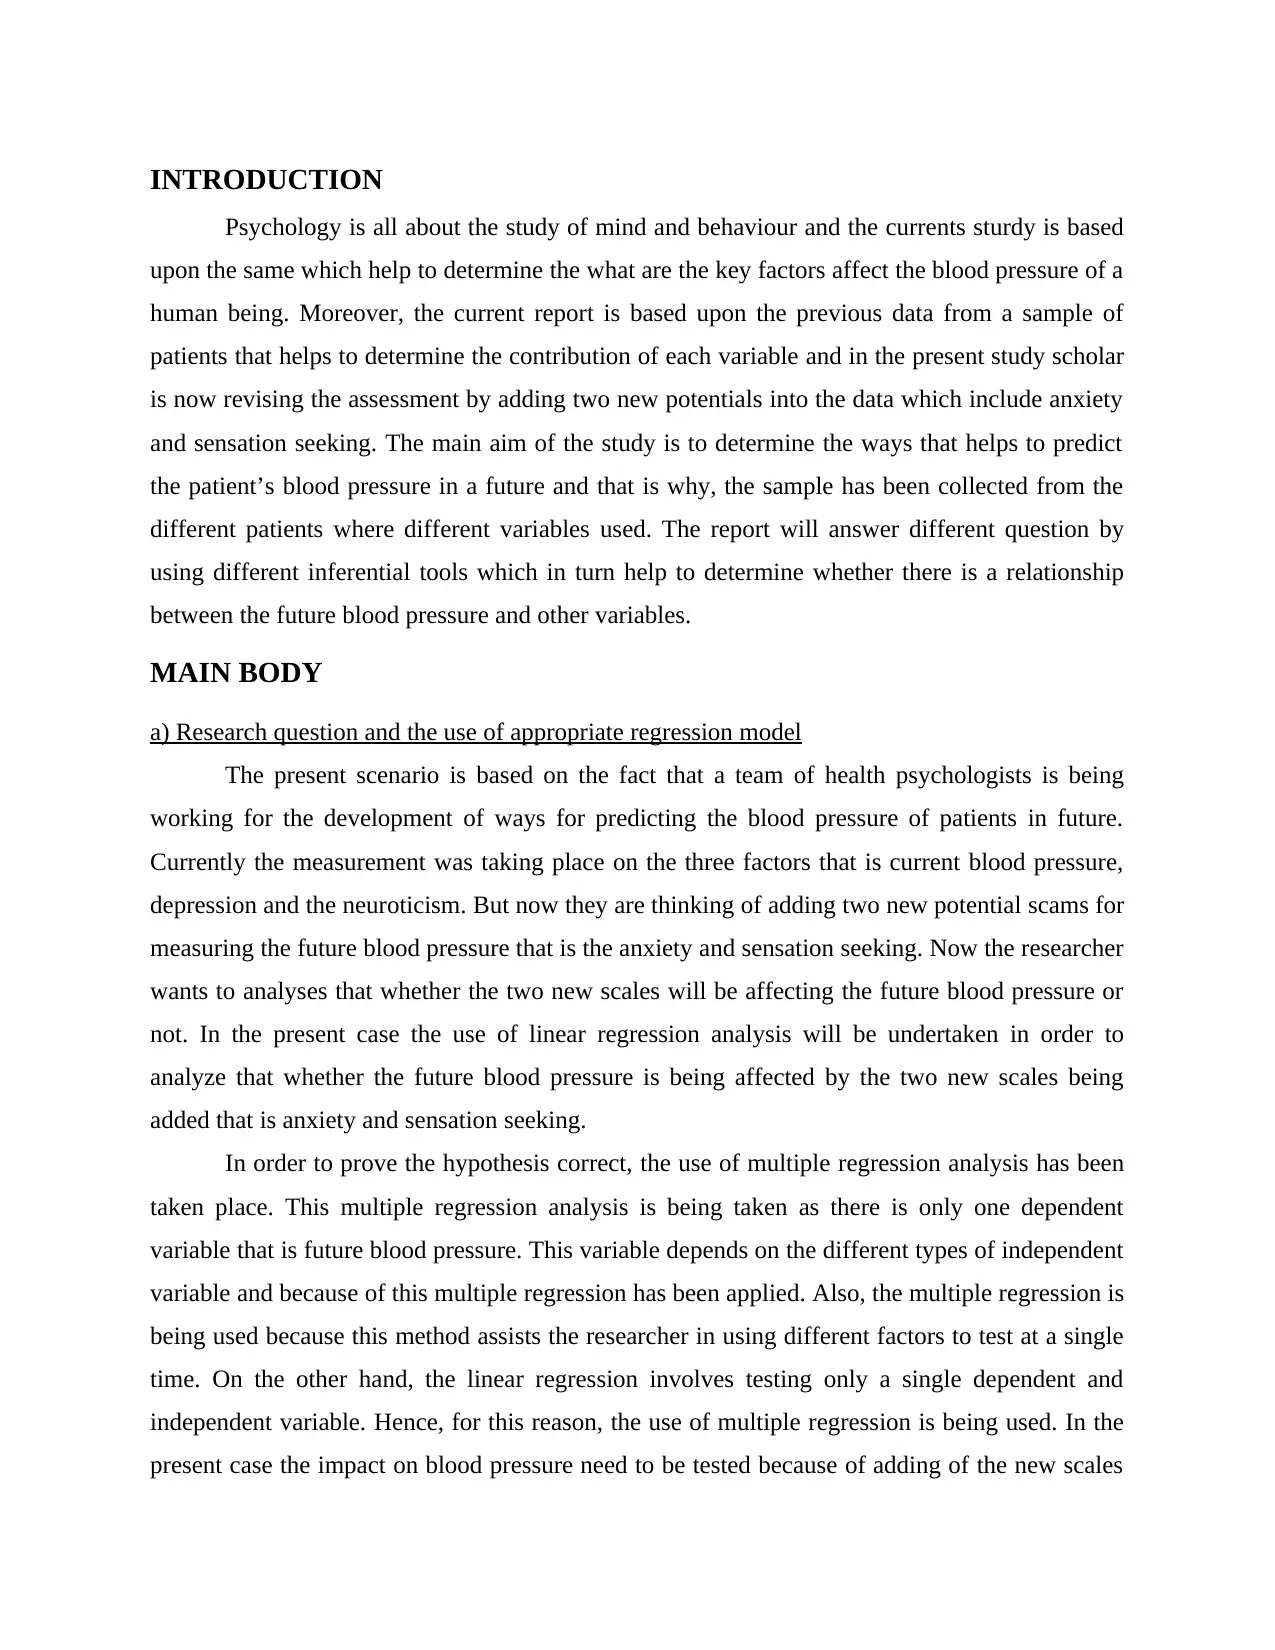
INTRODUCTION
Psychology is all about the study of mind and behaviour and the currents sturdy is based
upon the same which help to determine the what are the key factors affect the blood pressure of a
human being. Moreover, the current report is based upon the previous data from a sample of
patients that helps to determine the contribution of each variable and in the present study scholar
is now revising the assessment by adding two new potentials into the data which include anxiety
and sensation seeking. The main aim of the study is to determine the ways that helps to predict
the patient’s blood pressure in a future and that is why, the sample has been collected from the
different patients where different variables used. The report will answer different question by
using different inferential tools which in turn help to determine whether there is a relationship
between the future blood pressure and other variables.
MAIN BODY
a) Research question and the use of appropriate regression model
The present scenario is based on the fact that a team of health psychologists is being
working for the development of ways for predicting the blood pressure of patients in future.
Currently the measurement was taking place on the three factors that is current blood pressure,
depression and the neuroticism. But now they are thinking of adding two new potential scams for
measuring the future blood pressure that is the anxiety and sensation seeking. Now the researcher
wants to analyses that whether the two new scales will be affecting the future blood pressure or
not. In the present case the use of linear regression analysis will be undertaken in order to
analyze that whether the future blood pressure is being affected by the two new scales being
added that is anxiety and sensation seeking.
In order to prove the hypothesis correct, the use of multiple regression analysis has been
taken place. This multiple regression analysis is being taken as there is only one dependent
variable that is future blood pressure. This variable depends on the different types of independent
variable and because of this multiple regression has been applied. Also, the multiple regression is
being used because this method assists the researcher in using different factors to test at a single
time. On the other hand, the linear regression involves testing only a single dependent and
independent variable. Hence, for this reason, the use of multiple regression is being used. In the
present case the impact on blood pressure need to be tested because of adding of the new scales
⊘ This is a preview!⊘
Do you want full access?
Subscribe today to unlock all pages.
Trusted by 1+ million students worldwide
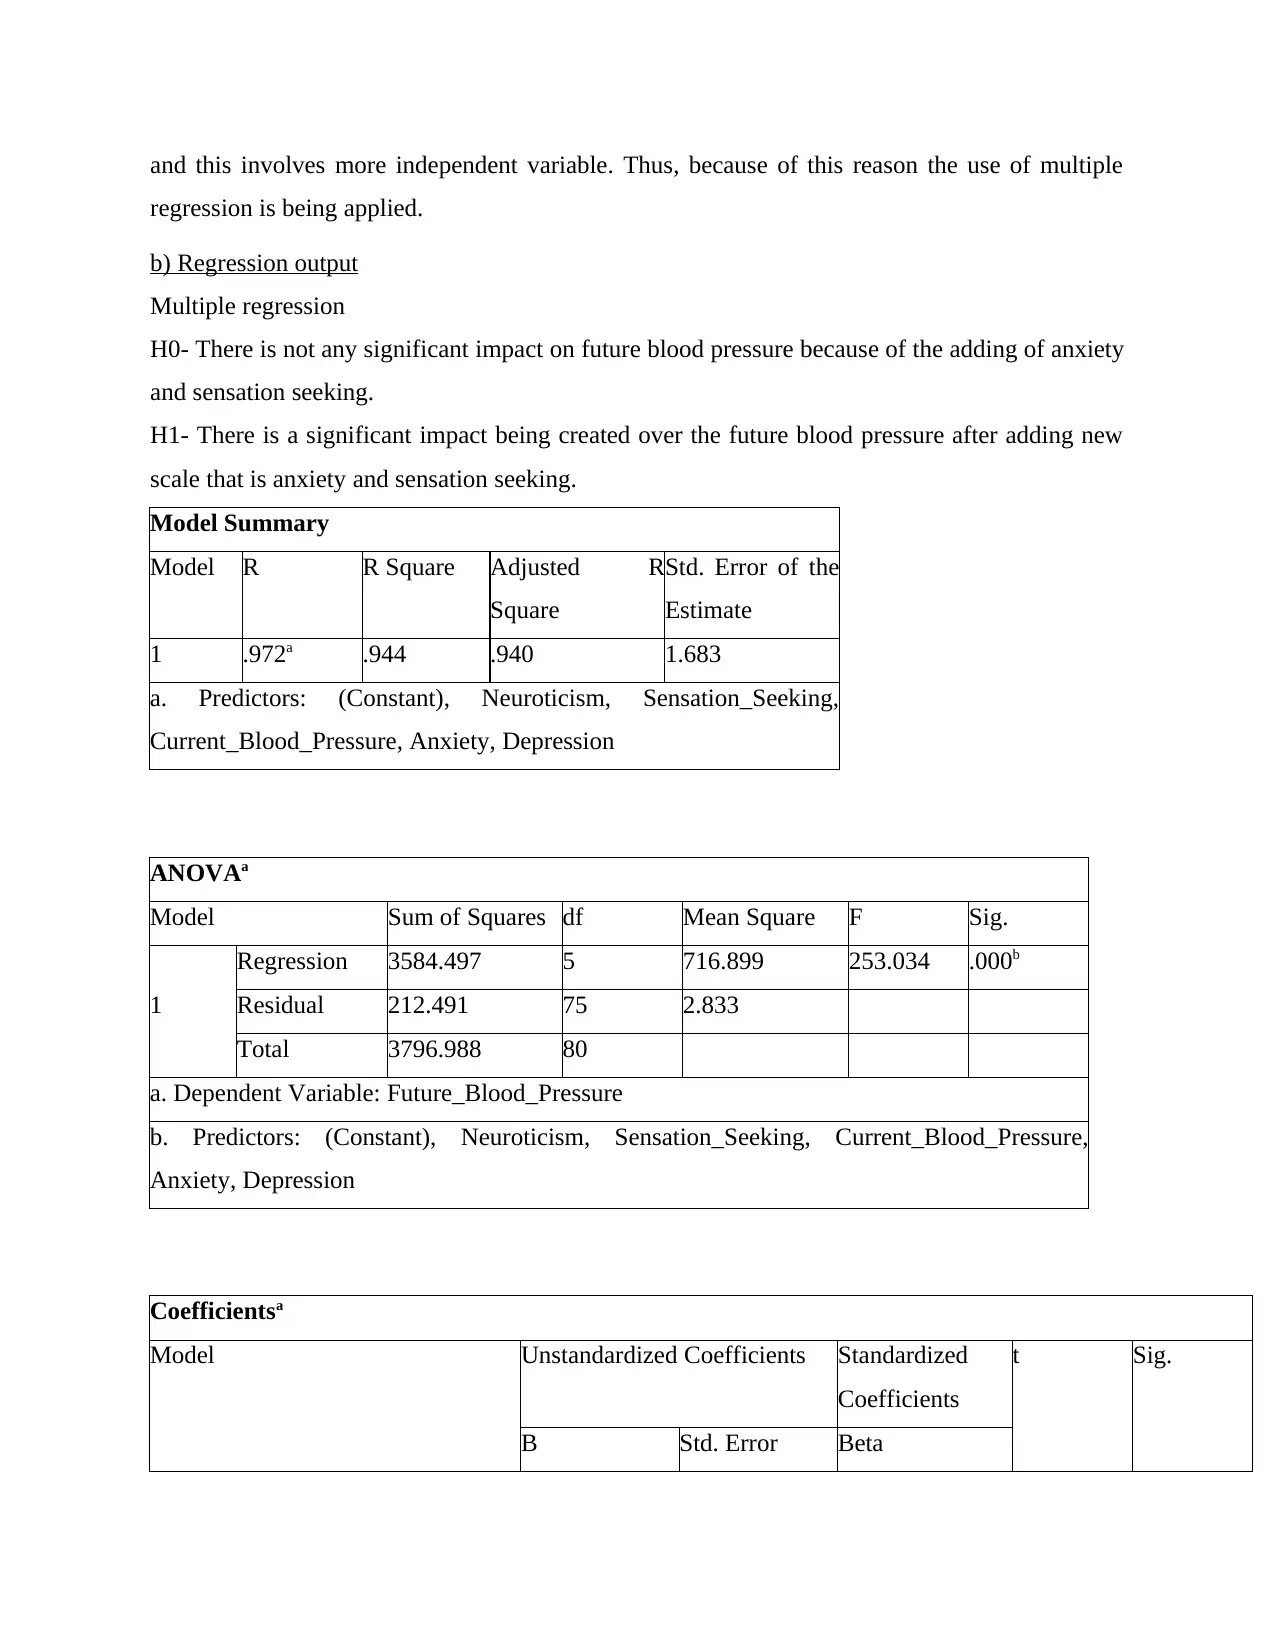
and this involves more independent variable. Thus, because of this reason the use of multiple
regression is being applied.
b) Regression output
Multiple regression
H0- There is not any significant impact on future blood pressure because of the adding of anxiety
and sensation seeking.
H1- There is a significant impact being created over the future blood pressure after adding new
scale that is anxiety and sensation seeking.
Model Summary
Model R R Square Adjusted R
Square
Std. Error of the
Estimate
1 .972a .944 .940 1.683
a. Predictors: (Constant), Neuroticism, Sensation_Seeking,
Current_Blood_Pressure, Anxiety, Depression
ANOVAa
Model Sum of Squares df Mean Square F Sig.
1
Regression 3584.497 5 716.899 253.034 .000b
Residual 212.491 75 2.833
Total 3796.988 80
a. Dependent Variable: Future_Blood_Pressure
b. Predictors: (Constant), Neuroticism, Sensation_Seeking, Current_Blood_Pressure,
Anxiety, Depression
Coefficientsa
Model Unstandardized Coefficients Standardized
Coefficients
t Sig.
B Std. Error Beta
Paraphrase This Document
Need a fresh take? Get an instant paraphrase of this document with our AI Paraphraser
1
(Constant) -15.696 1.279 -12.272 .000
Current_Blood_Pressure .958 .042 .638 22.595 .000
Sensation_Seeking 1.325 .212 .905 6.238 .000
Depression -.270 .204 -.191 -1.324 .189
Anxiety .938 .092 .750 10.176 .000
Neuroticism -.316 .092 -.250 -3.421 .001
a. Dependent Variable: Future_Blood_Pressure
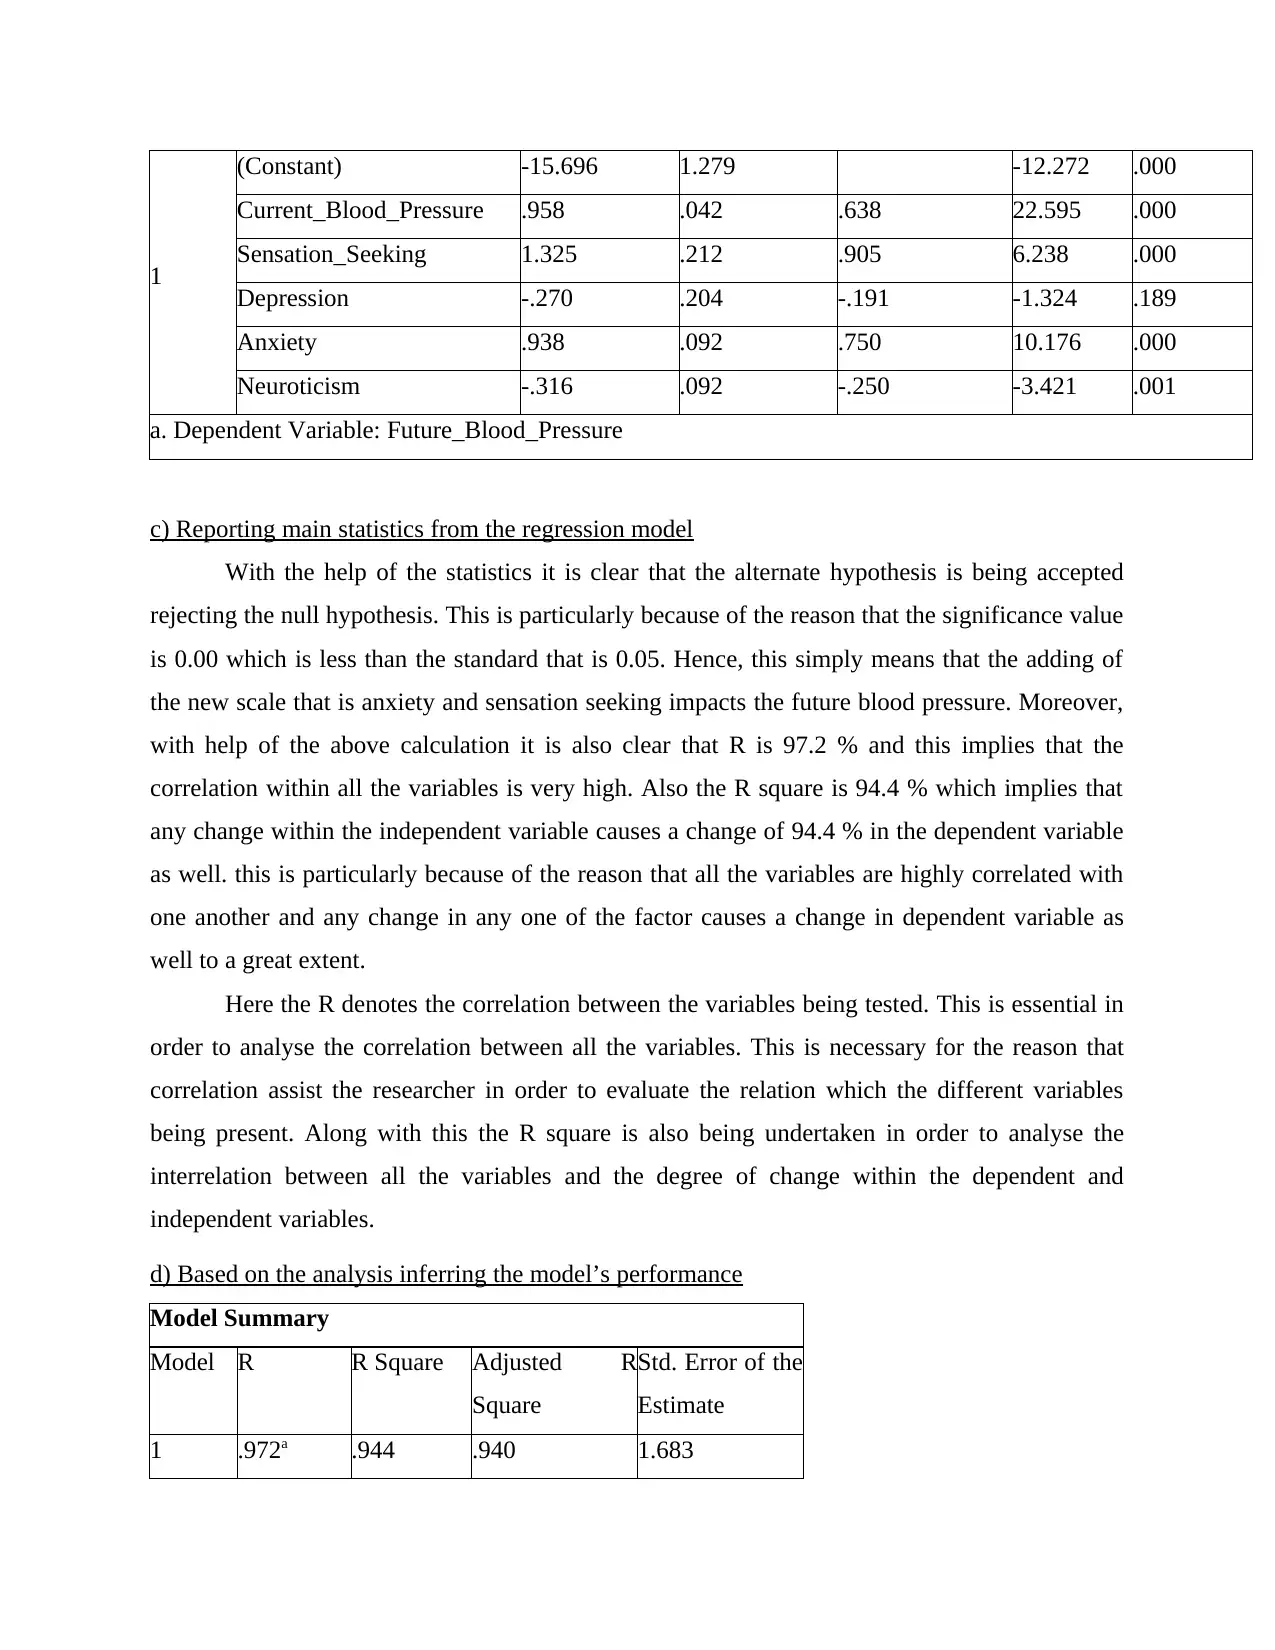
c) Reporting main statistics from the regression model
With the help of the statistics it is clear that the alternate hypothesis is being accepted
rejecting the null hypothesis. This is particularly because of the reason that the significance value
is 0.00 which is less than the standard that is 0.05. Hence, this simply means that the adding of
the new scale that is anxiety and sensation seeking impacts the future blood pressure. Moreover,
with help of the above calculation it is also clear that R is 97.2 % and this implies that the
correlation within all the variables is very high. Also the R square is 94.4 % which implies that
any change within the independent variable causes a change of 94.4 % in the dependent variable
as well. this is particularly because of the reason that all the variables are highly correlated with
one another and any change in any one of the factor causes a change in dependent variable as
well to a great extent.
Here the R denotes the correlation between the variables being tested. This is essential in
order to analyse the correlation between all the variables. This is necessary for the reason that
correlation assist the researcher in order to evaluate the relation which the different variables
being present. Along with this the R square is also being undertaken in order to analyse the
interrelation between all the variables and the degree of change within the dependent and
independent variables.
d) Based on the analysis inferring the model’s performance
Model Summary
Model R R Square Adjusted R
Square
Std. Error of the
Estimate
1 .972a .944 .940 1.683
(Constant) -15.696 1.279 -12.272 .000
Current_Blood_Pressure .958 .042 .638 22.595 .000
Sensation_Seeking 1.325 .212 .905 6.238 .000
Depression -.270 .204 -.191 -1.324 .189
Anxiety .938 .092 .750 10.176 .000
Neuroticism -.316 .092 -.250 -3.421 .001
a. Dependent Variable: Future_Blood_Pressure
c) Reporting main statistics from the regression model
With the help of the statistics it is clear that the alternate hypothesis is being accepted
rejecting the null hypothesis. This is particularly because of the reason that the significance value
is 0.00 which is less than the standard that is 0.05. Hence, this simply means that the adding of
the new scale that is anxiety and sensation seeking impacts the future blood pressure. Moreover,
with help of the above calculation it is also clear that R is 97.2 % and this implies that the
correlation within all the variables is very high. Also the R square is 94.4 % which implies that
any change within the independent variable causes a change of 94.4 % in the dependent variable
as well. this is particularly because of the reason that all the variables are highly correlated with
one another and any change in any one of the factor causes a change in dependent variable as
well to a great extent.
Here the R denotes the correlation between the variables being tested. This is essential in
order to analyse the correlation between all the variables. This is necessary for the reason that
correlation assist the researcher in order to evaluate the relation which the different variables
being present. Along with this the R square is also being undertaken in order to analyse the
interrelation between all the variables and the degree of change within the dependent and
independent variables.
d) Based on the analysis inferring the model’s performance
Model Summary
Model R R Square Adjusted R
Square
Std. Error of the
Estimate
1 .972a .944 .940 1.683
a. Predictors: (Constant), Neuroticism, Sensation_Seeking,
Current_Blood_Pressure, Anxiety, Depression
ANOVAa
Model Sum of Squares df Mean Square F Sig.
1
Regression 3584.497 5 716.899 253.034 .000b
Residual 212.491 75 2.833
Total 3796.988 80
a. Dependent Variable: Future_Blood_Pressure
b. Predictors: (Constant), Neuroticism, Sensation_Seeking, Current_Blood_Pressure,
Anxiety, Depression
Coefficientsa
Model Unstandardized
Coefficients
Standardized
Coefficients
t Sig. 99.0% Confidence
Interval for B
B Std.
Error
Beta Lower
Bound
Upper
Bound
1
(Constant) -15.696 1.279 -
12.272.000 -19.076 -12.315
Current_Blood_Pressure.958 .042 .638 22.595.000 .846 1.070
Sensation_Seeking 1.325 .212 .905 6.238 .000 .763 1.886
Depression -.270 .204 -.191 -1.324 .189 -.808 .268
Anxiety .938 .092 .750 10.176.000 .694 1.181
Neuroticism -.316 .092 -.250 -3.421 .001 -.560 -.072
a. Dependent Variable: Future_Blood_Pressure
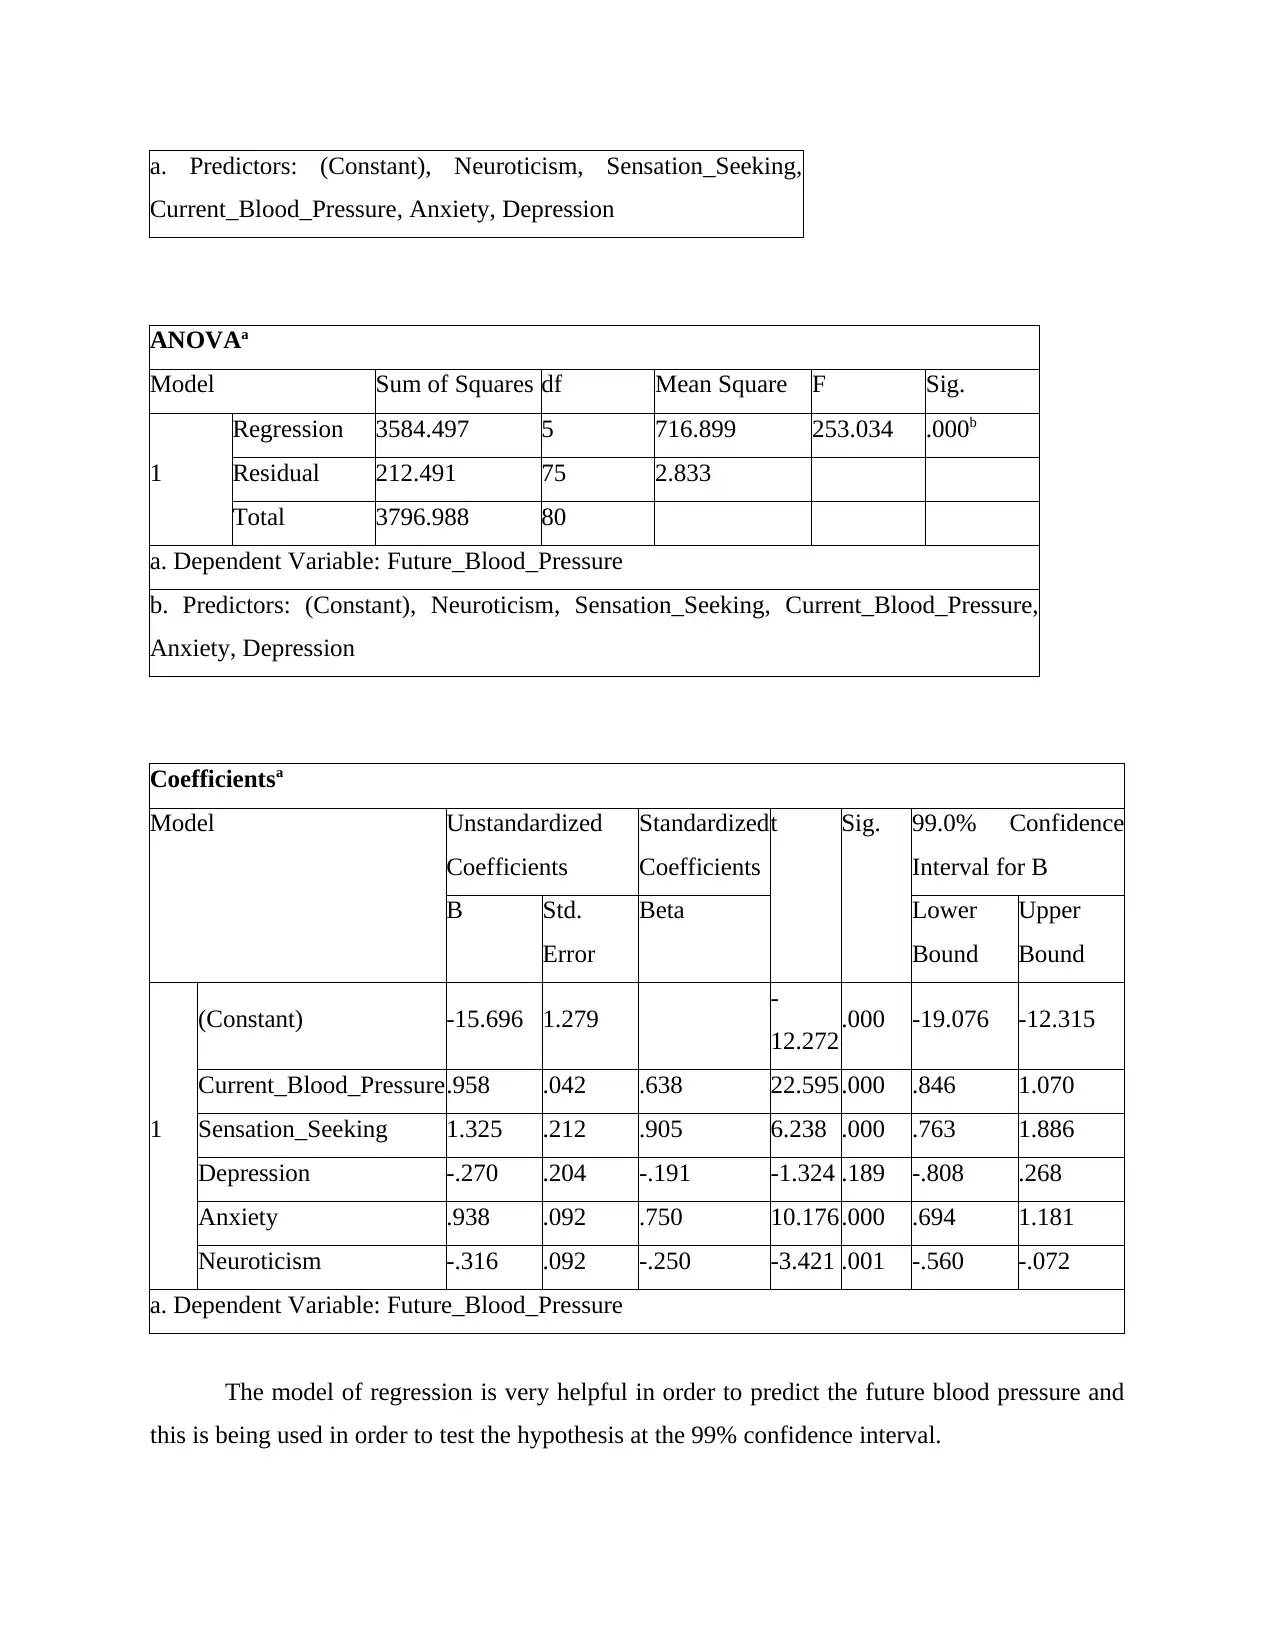
The model of regression is very helpful in order to predict the future blood pressure and
this is being used in order to test the hypothesis at the 99% confidence interval.
Current_Blood_Pressure, Anxiety, Depression
ANOVAa
Model Sum of Squares df Mean Square F Sig.
1
Regression 3584.497 5 716.899 253.034 .000b
Residual 212.491 75 2.833
Total 3796.988 80
a. Dependent Variable: Future_Blood_Pressure
b. Predictors: (Constant), Neuroticism, Sensation_Seeking, Current_Blood_Pressure,
Anxiety, Depression
Coefficientsa
Model Unstandardized
Coefficients
Standardized
Coefficients
t Sig. 99.0% Confidence
Interval for B
B Std.
Error
Beta Lower
Bound
Upper
Bound
1
(Constant) -15.696 1.279 -
12.272.000 -19.076 -12.315
Current_Blood_Pressure.958 .042 .638 22.595.000 .846 1.070
Sensation_Seeking 1.325 .212 .905 6.238 .000 .763 1.886
Depression -.270 .204 -.191 -1.324 .189 -.808 .268
Anxiety .938 .092 .750 10.176.000 .694 1.181
Neuroticism -.316 .092 -.250 -3.421 .001 -.560 -.072
a. Dependent Variable: Future_Blood_Pressure
The model of regression is very helpful in order to predict the future blood pressure and
this is being used in order to test the hypothesis at the 99% confidence interval.
⊘ This is a preview!⊘
Do you want full access?
Subscribe today to unlock all pages.
Trusted by 1+ million students worldwide
The null hypothesis is ‘There is not any significant relation between future blood pressure
and the new scales being added.’
The experimental hypothesis includes ‘There is a significant relation being present within
future blood pressure and the new scales being added.’
For the analysis of this hypothesis the statistics being used for the hypothesis testing is
the regression analysis. This analysis is being undertaken at the confidence interval of 99 % that
is at alpha threshold of 0.001. With the help of the overall analysis of the regression model it is
clear that the experimental hypothesis is being proven correct because the value is 0.00 which is
less than the standard of 0.001. Also, the R is 97.2 % which implies that all the variables are
highly correlated with one another. Also the R square is 94.4 % which implies that any change in
the independent variable will cause a high change in the dependent variable that is future blood
pressure.
The statement that the significance value is less than the standard states that alternate
hypothesis is being tested correct and null is being rejected.
e) Considering each of the predictor individually
With the analysis of the above regression analysis model it is clear that every predictor is
individual and it is not necessary that it is correlated with the dependent variable. It is necessary
to evaluate each predictor individually because many a times overall all the predictors prove but
individually it does.
The null hypothesis is ‘There is not any relation between future blood pressure and all the
other independent predictors.’
The experimental hypothesis is ‘There is a significant relation being present in future
blood pressure and all the other independent variables.’
With the help of the above regression tool statistically it can be stated that all the
variables create an impact over the future blood pressure. With the overall model it is clear that
the experimental hypothesis is being proven as the significance value is less than the standard
that is 0.00.
Individually it was evaluated that only depression is the variable which does not affect the
future blood pressure. This is pertaining to the fact that the significance value is 0.189 which is
more than the standard that is 0.001. Thus, with this it can be stated that depression is the
variable which has no impact over the future blood pressure.
Paraphrase This Document
Need a fresh take? Get an instant paraphrase of this document with our AI Paraphraser
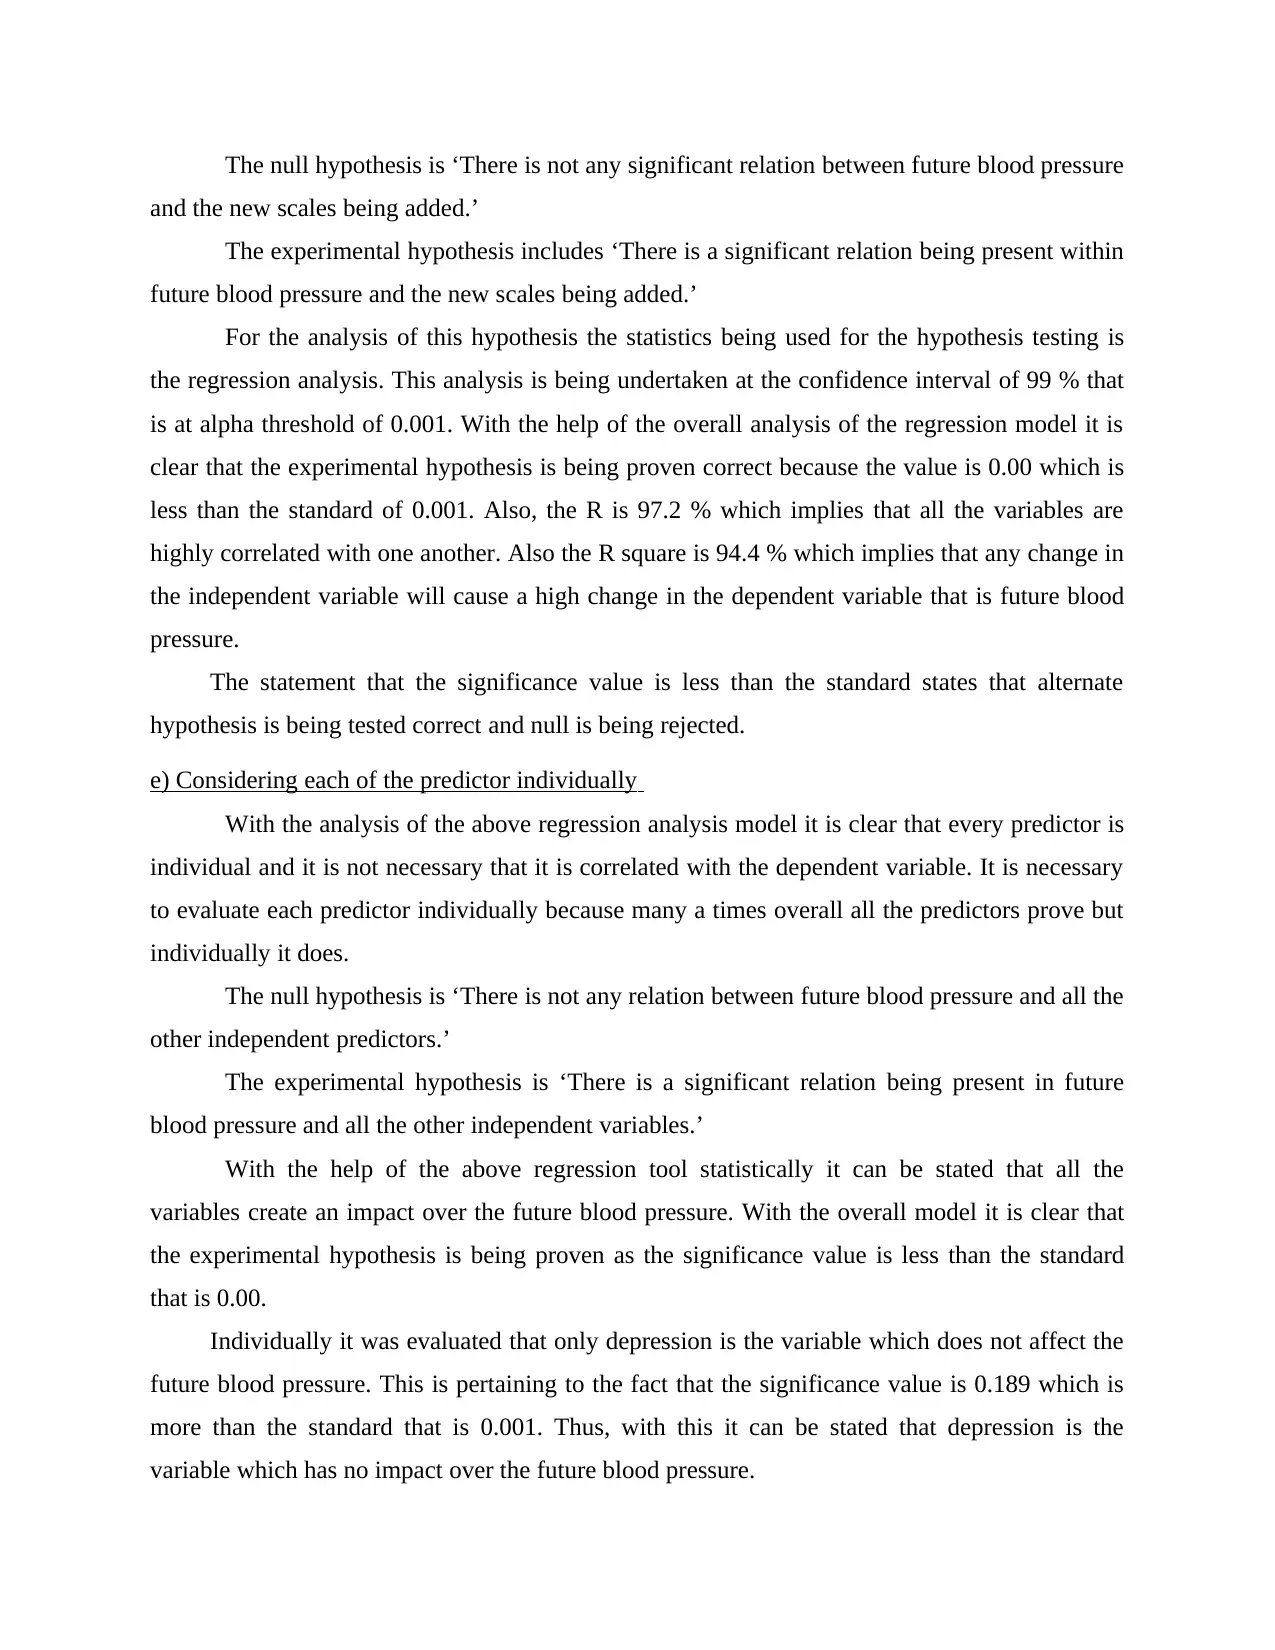
f) Equation of the predicted future blood pressure
Future blood pressure= -15.696 + 0.958 (current blood pressure) + 1.325 (sensation seeking) + (-
0.270 depression) + 0.938 (anxiety) + (-0.316 neuroticism)
g) Ranking all the predictors based upon the influence Future Blood Pressure
Created Variablesa
Source Variable Function New Variable Label
Current_Blood_Pressur
eb Rank RCurrent
Rank of
Current_Blood_Press
ure by
Future_Blood_Pressur
e
Sensation_Seekingb Rank RSensati
Rank of
Sensation_Seeking by
Future_Blood_Pressur
e
Depressionb Rank RDepress
Rank of Depression
by
Future_Blood_Pressur
e
Anxietyb Rank RAnxiety
Rank of Anxiety by
Future_Blood_Pressur
e
Neuroticismb Rank RNeuroti
Rank of Neuroticism
by
Future_Blood_Pressur
e
a. Mean rank of tied values is used for ties.
b. Ranks are in ascending order.
By using SPSS software, the ranking has performed which in turn assist to interpret the
result and determine ranking for each variable. The above table also reflected when the ranking
is performed by applying the tool and this in turn create a better outcome. Only one model has
been applied for the present data in order to evaluate the answer and determine the ranking. It
can be seen under the data view sheet of SPSS software which entails each variable ranking and
reflect upon the same.
h) Correlation
Correlations
Current_Blood
_Pressure
Sensation_
Seeking
Depre
ssion
Anx
iety
Neuroti
cism
Future_Blood
_Pressure
Current_Blood
_Pressure
Pearso
n
Correl
ation
1 -.156 -.127 -.13
3 -.138 .456**
Sig.
(2-
tailed)
.164 .258 .237 .218 .000
N 81 81 81 81 81 81
Sensation_See
king
Pearso
n
Correl
ation
-.156 1 .980** -.00
8 .031 .604**
Sig.
(2-
tailed)
.164 .000 .944 .785 .000
N 81 81 81 81 81 81
Depression
Pearso
n
Correl
ation
-.127 .980** 1 .012 .034 .616**
Sig.
(2-
tailed)
.258 .000 .913 .765 .000
N 81 81 81 81 81 81
Anxiety
Pearso
n
Correl
ation
-.133 -.008 .012 1 .924** .424**
Sig.
(2-
tailed)
.237 .944 .913 .000 .000
N 81 81 81 81 81 81
⊘ This is a preview!⊘
Do you want full access?
Subscribe today to unlock all pages.
Trusted by 1+ million students worldwide
Neuroticism
Pearso
n
Correl
ation
-.138 .031 .034 .924
** 1 .375**
Sig.
(2-
tailed)
.218 .785 .765 .000 .001
N 81 81 81 81 81 81
**. Correlation is significant at the 0.01 level (2-tailed).
*. Correlation is significant at the 0.05 level (2-tailed).
c. Unless otherwise noted, bootstrap results are based on 1000 bootstrap samples
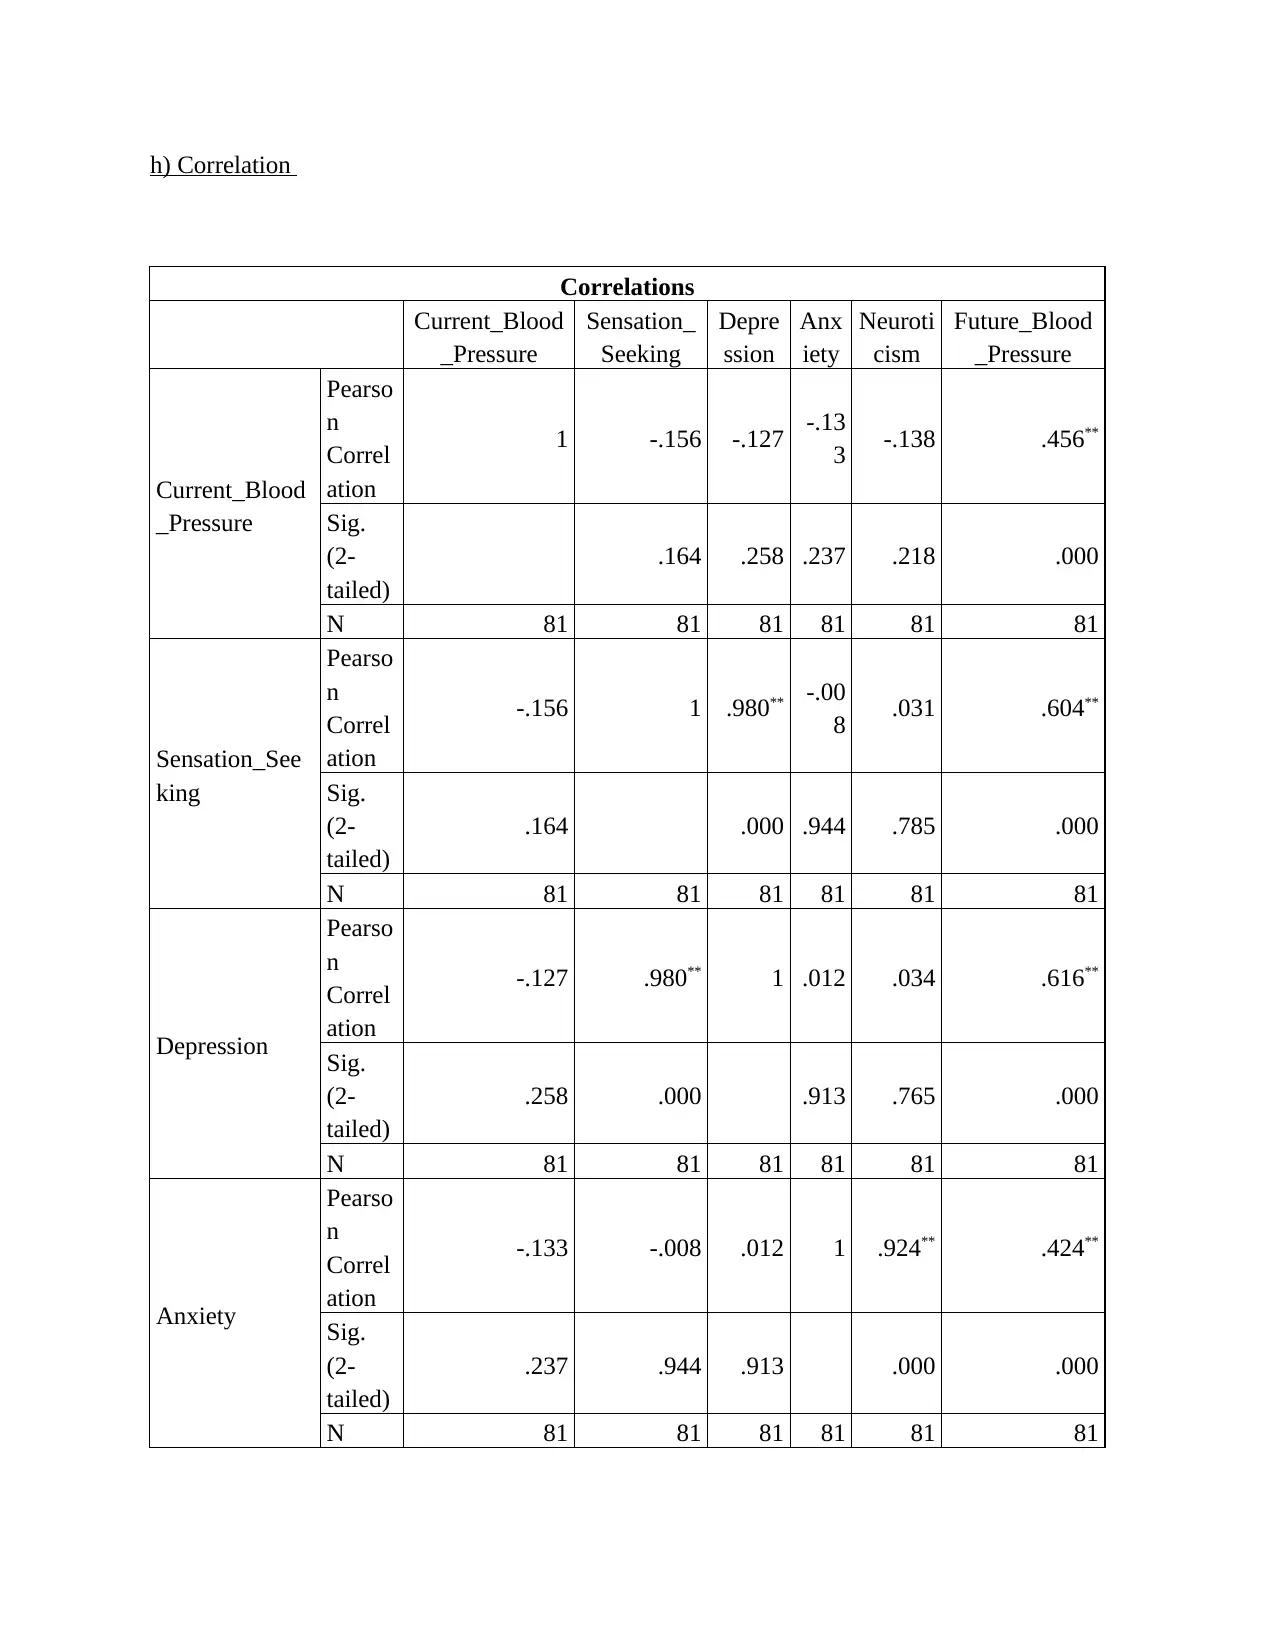
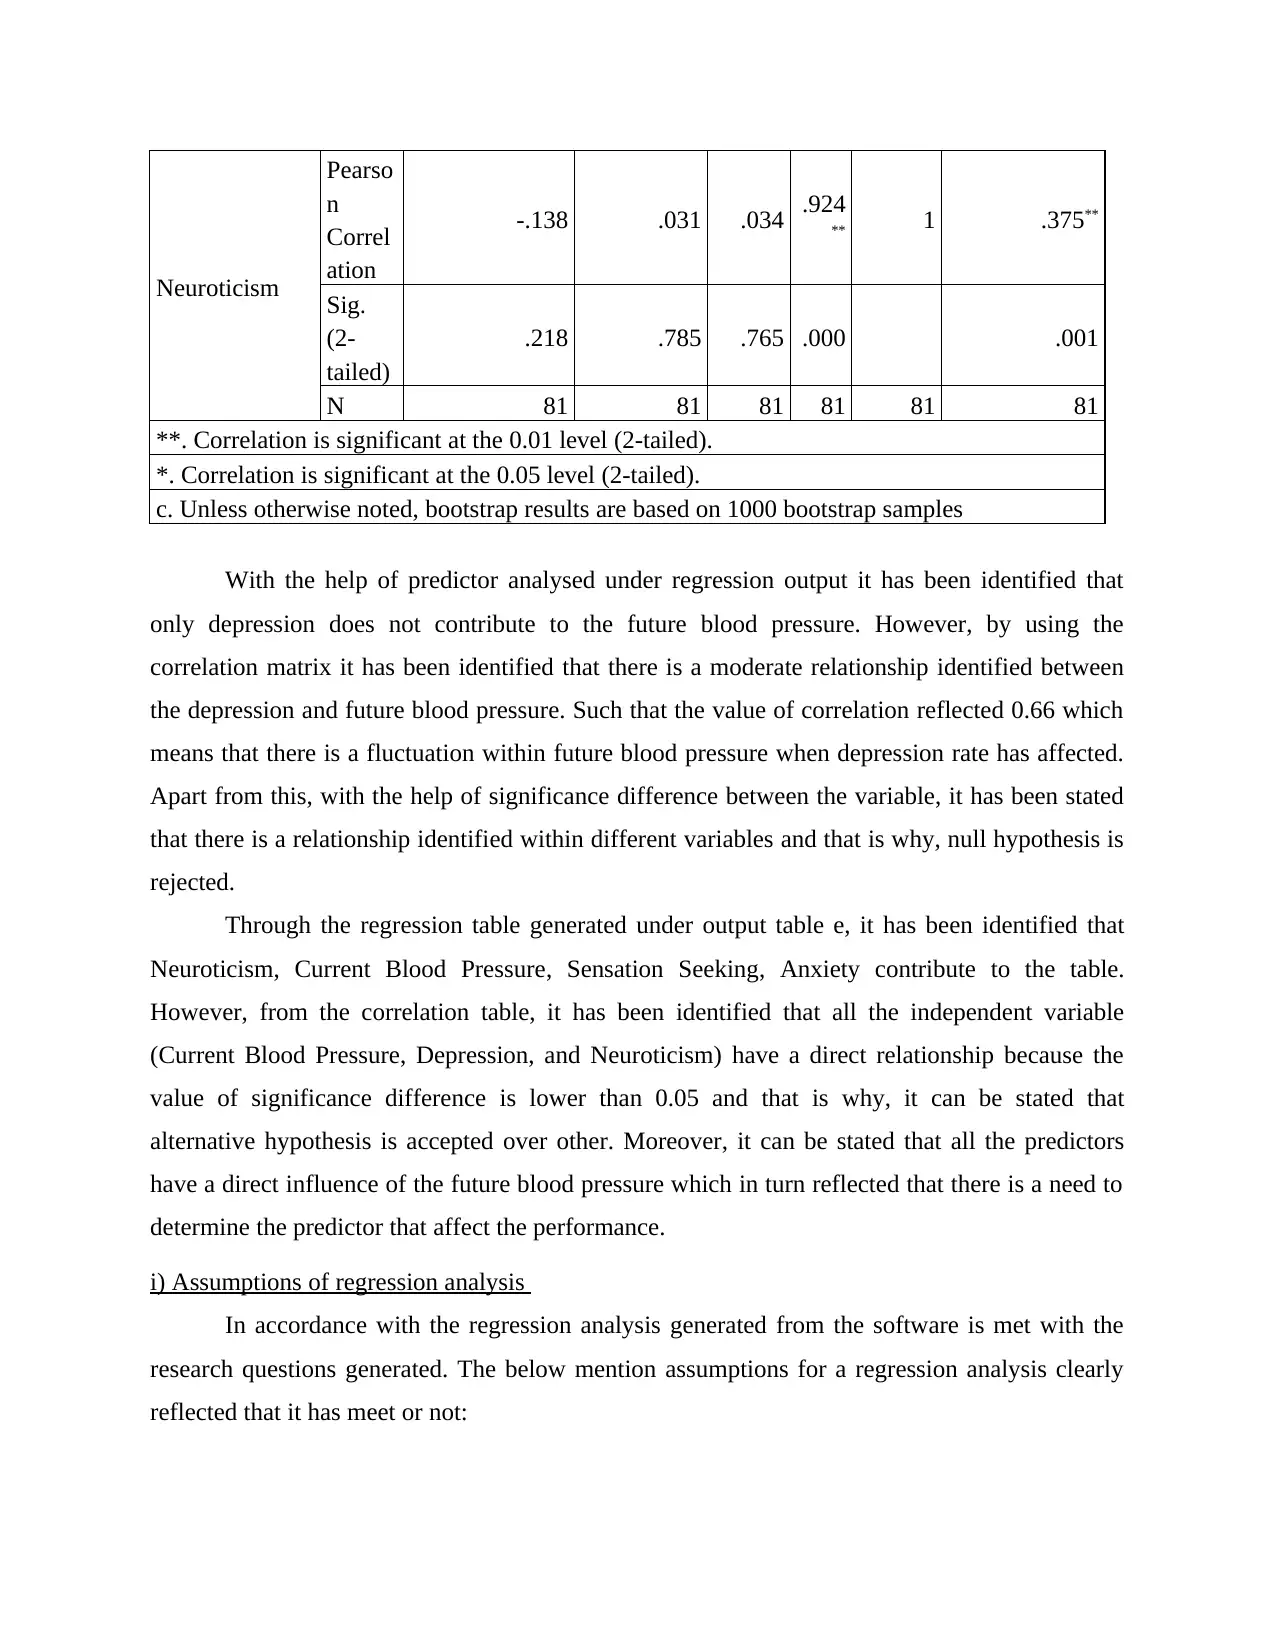
With the help of predictor analysed under regression output it has been identified that
only depression does not contribute to the future blood pressure. However, by using the
correlation matrix it has been identified that there is a moderate relationship identified between
the depression and future blood pressure. Such that the value of correlation reflected 0.66 which
means that there is a fluctuation within future blood pressure when depression rate has affected.
Apart from this, with the help of significance difference between the variable, it has been stated
that there is a relationship identified within different variables and that is why, null hypothesis is
rejected.
Through the regression table generated under output table e, it has been identified that
Neuroticism, Current Blood Pressure, Sensation Seeking, Anxiety contribute to the table.
However, from the correlation table, it has been identified that all the independent variable
(Current Blood Pressure, Depression, and Neuroticism) have a direct relationship because the
value of significance difference is lower than 0.05 and that is why, it can be stated that
alternative hypothesis is accepted over other. Moreover, it can be stated that all the predictors
have a direct influence of the future blood pressure which in turn reflected that there is a need to
determine the predictor that affect the performance.
i) Assumptions of regression analysis
In accordance with the regression analysis generated from the software is met with the
research questions generated. The below mention assumptions for a regression analysis clearly
reflected that it has meet or not:
Pearso
n
Correl
ation
-.138 .031 .034 .924
** 1 .375**
Sig.
(2-
tailed)
.218 .785 .765 .000 .001
N 81 81 81 81 81 81
**. Correlation is significant at the 0.01 level (2-tailed).
*. Correlation is significant at the 0.05 level (2-tailed).
c. Unless otherwise noted, bootstrap results are based on 1000 bootstrap samples
With the help of predictor analysed under regression output it has been identified that
only depression does not contribute to the future blood pressure. However, by using the
correlation matrix it has been identified that there is a moderate relationship identified between
the depression and future blood pressure. Such that the value of correlation reflected 0.66 which
means that there is a fluctuation within future blood pressure when depression rate has affected.
Apart from this, with the help of significance difference between the variable, it has been stated
that there is a relationship identified within different variables and that is why, null hypothesis is
rejected.
Through the regression table generated under output table e, it has been identified that
Neuroticism, Current Blood Pressure, Sensation Seeking, Anxiety contribute to the table.
However, from the correlation table, it has been identified that all the independent variable
(Current Blood Pressure, Depression, and Neuroticism) have a direct relationship because the
value of significance difference is lower than 0.05 and that is why, it can be stated that
alternative hypothesis is accepted over other. Moreover, it can be stated that all the predictors
have a direct influence of the future blood pressure which in turn reflected that there is a need to
determine the predictor that affect the performance.
i) Assumptions of regression analysis
In accordance with the regression analysis generated from the software is met with the
research questions generated. The below mention assumptions for a regression analysis clearly
reflected that it has meet or not:
Paraphrase This Document
Need a fresh take? Get an instant paraphrase of this document with our AI Paraphraser
There is a linear relationship identified within a regression output and that is why, there is
alternative hypothesis has accepted which in turn shows that all the variable has a direct
relationship over the dependent variable. Thus, it can be stated that the assumption met
on the basis of regression outcome.
No auto-correlation is another assumption for a regression analysis in which it has been
identified that it was not met under the analysis. It is so because there is direct
relationship identified however the assumption is different from the actual results.
j) Discussion relating to the findings
With the above finding it is clear that all the working of the regression analysis proves
that the future blood pressure is being affected to a great extent by all the other variables. This is
particularly because of the reason that when the person is feeling any one of the symptom that is
independent variable than this will be affecting the future blood pressure. In support of this,
Desboulets (2018) states that the future blood pressure is being affected by the different factors.
This is particularly because of the reason that in case the person is in anxiety then they blood
pressure might increase. This is particularly because of the reason that when the person will be
feeling depressed then also the level of blood pressure might be increased. This is because of the
reason that when the person will be having some issue or depression then their mental level will
not be stable. Also in case the person is in some dilemma or is not feeling well then they might
be affected and this can result in the negative impact over their health and blood pressure can
increase.
Moreover, with the finding and views of Rambod and et.al., (2020) it is also evaluated
that the future blood pressure also depends on the current level of blood pressure. This is
pertaining to the fact that when the current blood pressure can also affect the efficiency of the
person as this can affect the health of the person. Along with this in case the current blood
pressure level is high then all these factors that is anxiety, depression, sensation and neuroticism
affect the future blood pressure to a great extent. This is pertaining to the fact that when any of
this factor is negative then this will be affecting the blood pressure level of the person.
For instance, the person is in depression relating to some reason and because of this the
health of the person. This is pertaining to the fact that when the mind of the person will not be
stable then this will be affecting the blood pressure level. Also, in case the sensation of the
person will be low then this will also be affecting the health of the person in negative manner.
The reason underlying this fact is that when the working efficiency of the person will not be
good then this will be definitely affect the health of the person and particularly the blood
pressure level of the person. Also, the neuroticism is a trait which outlines the negative
experience of the person which includes the anger, self- consciousness, irritability, emotional
instability and others. Hence, all these factors as well affect the health and the blood pressure
level of person to a great extent.
In against of this Zhou and et.al., (2021) states that managing the depression and all the
other predictors is very important as this will improve the person capability to beat the blood
pressure and other health related issue. This is very necessary for the reason that when the person
will be happy and healthy then there will not be any issue relating to the blood pressure and other
diseases. Hence, this is crucial for the person that they effectively create good working
environment and improve the relation with others such that the cordial working can be created.
This is necessary for improving the working efficiency and will power of the person so that they
can deal with any of the health issue be it blood pressure or any other disease. This is very
important for the reason that when the person will be happy within the mind and there will not be
any tension then this will be affecting the working of the person to a great extent.
CONCLUSION
By summing up above report, it has been concluded that by using different significance
level, there is a significance difference identified within a dependent as well as independent
variables. However, in the case of individual variable like depression there is no relationship
between depression and future blood pressure because the value is greater than the standard
criteria. Whereas the correlation is moderate as shown the correlation matrix. That is why, it can
be stated that to predict the blood pressure in future variable like Depression, Neuroticism,
Anxiety and Sensation Seeking can be used that help to determine the actual values in order to
make decision accordingly.
In the future, when the same assessment will be revised then it is to be suggested to use
more variable and also increase the sample size. Along with this, different inferential tools can
be used like t-test that helps to improve the results and meet the defined aim of the research as
well. That is why, it will be beneficial for the scholar to determine the variation in a results in
order to understand the differences when different test applied.
⊘ This is a preview!⊘
Do you want full access?
Subscribe today to unlock all pages.
Trusted by 1+ million students worldwide
1 out of 14
Related Documents


Your All-in-One AI-Powered Toolkit for Academic Success.
+13062052269
info@desklib.com
Available 24*7 on WhatsApp / Email
![[object Object]](/_next/static/media/star-bottom.7253800d.svg)
Unlock your academic potential
Copyright © 2020–2026 A2Z Services. All Rights Reserved. Developed and managed by ZUCOL.