Regression & ANOVA: Analyzing UK Primary and Secondary Pupil Data
VerifiedAdded on 2023/06/15
|37
|3408
|172
Report
AI Summary
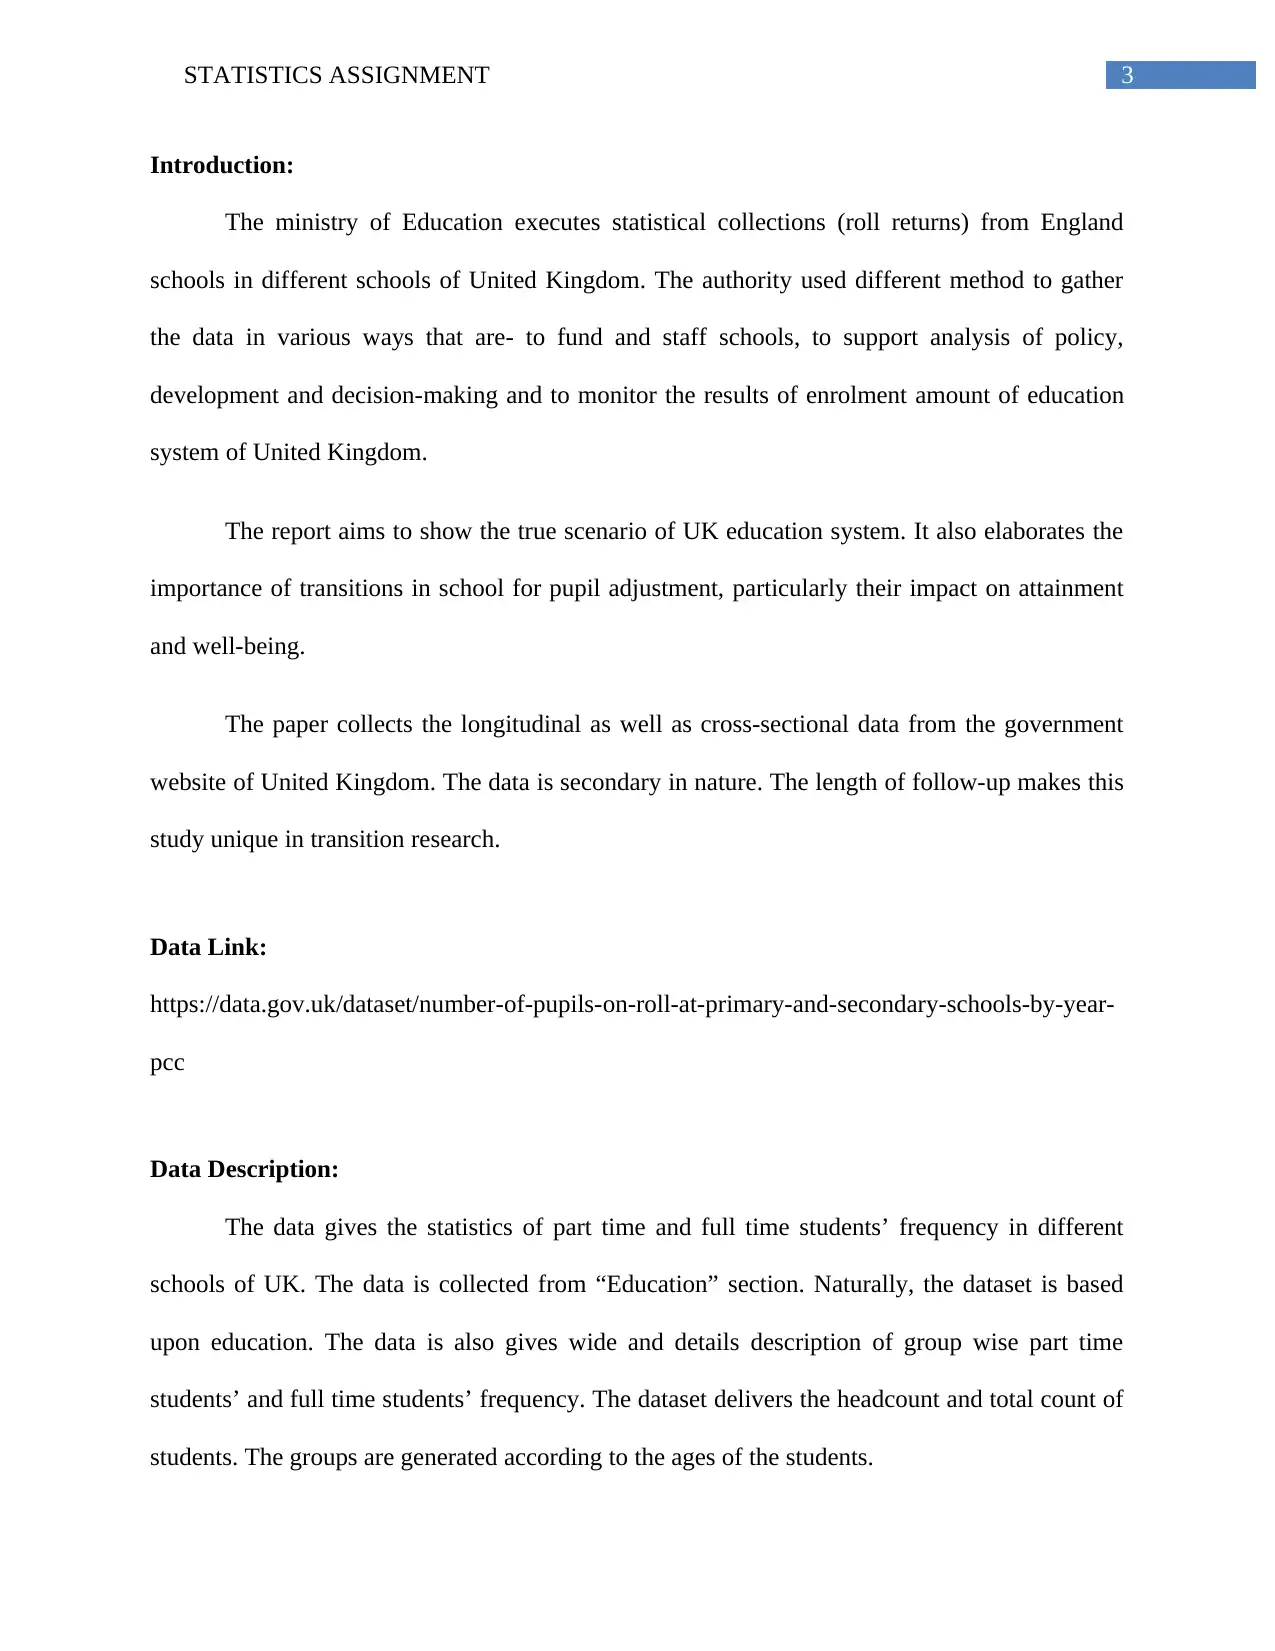
This report presents a statistical analysis of pupil enrollment data in primary and secondary schools across the United Kingdom. The analysis utilizes multiple regression, logistic regression, and ANOVA models to examine the relationships between various factors such as full-time and part-time student status, gender, and overall headcounts. The multiple regression model explores the association between full-time equivalent pupils and headcount/full-time pupil numbers, while the logistic regression model investigates the relationship between these factors when considering factorized full-time equivalent pupils. ANOVA is employed to assess differences between groups, with specific models examining the relationship between full-time and part-time pupils, as well as headcount data for girls and boys. The report provides detailed interpretations of the statistical results, including R-squared values, p-values, and graphical representations of model fit, ultimately offering insights into the dynamics of pupil enrollment within the UK education system. Desklib provides access to this and similar solved assignments for students.

Running head: STATISTICS ASSIGNMENT
Analysis of Pupils on Roll at Primary and Secondary schools
Name of the Student:
Name of the University:
Author’s note:
Analysis of Pupils on Roll at Primary and Secondary schools
Name of the Student:
Name of the University:
Author’s note:
Paraphrase This Document
Need a fresh take? Get an instant paraphrase of this document with our AI Paraphraser

1STATISTICS ASSIGNMENT
Executive Summary
The data analysis is based on the education enrolment data of primary and secondary schools
reported in United Kingdom. Summarily the dataset is dependent upon the part time and full time
students and their corresponding headcounts. Multiple regression model, Logistic regression
model and ANOVA are executed with this chosen data. Proper conclusions were drawn from the
analysis. Necessary analysis is incorporated with software “R”. The analysis presents a clear
view about full time and half time as well as boy and girl students’ enrolment in primary and
secondary school.

2STATISTICS ASSIGNMENT
Table of Contents
Introduction:....................................................................................................................................3
Data Link:........................................................................................................................................3
Data Description:.............................................................................................................................3
Methods:..........................................................................................................................................4
Analysis:..........................................................................................................................................4
Multiple Regression Model:........................................................................................................4
Logistic Regression Model:.......................................................................................................11
ANOVA:....................................................................................................................................18
Model 1:.................................................................................................................................21
Model 2:.................................................................................................................................32
Conclusion:....................................................................................................................................35
⊘ This is a preview!⊘
Do you want full access?
Subscribe today to unlock all pages.

Trusted by 1+ million students worldwide

3STATISTICS ASSIGNMENT
Introduction:
The ministry of Education executes statistical collections (roll returns) from England
schools in different schools of United Kingdom. The authority used different method to gather
the data in various ways that are- to fund and staff schools, to support analysis of policy,
development and decision-making and to monitor the results of enrolment amount of education
system of United Kingdom.
The report aims to show the true scenario of UK education system. It also elaborates the
importance of transitions in school for pupil adjustment, particularly their impact on attainment
and well-being.
The paper collects the longitudinal as well as cross-sectional data from the government
website of United Kingdom. The data is secondary in nature. The length of follow-up makes this
study unique in transition research.
Data Link:
https://data.gov.uk/dataset/number-of-pupils-on-roll-at-primary-and-secondary-schools-by-year-
pcc
Data Description:
The data gives the statistics of part time and full time students’ frequency in different
schools of UK. The data is collected from “Education” section. Naturally, the dataset is based
upon education. The data is also gives wide and details description of group wise part time
students’ and full time students’ frequency. The dataset delivers the headcount and total count of
students. The groups are generated according to the ages of the students.
Paraphrase This Document
Need a fresh take? Get an instant paraphrase of this document with our AI Paraphraser

4STATISTICS ASSIGNMENT
Methods:
The Analysis is executed by “R” software (with the help of MSexcel). Multiple
regression model, Logistic regression model and ANOVA (analysis of variance) are incorporated
with the chosen dataset.
Analysis:
Multiple Regression Model:
Multiple regression models are a special type of exploratory data analysis as well as
technique of data mining. A regression model relates a response that is dependent in nature and
one or more than one predictors that is/are dependent in nature. Here two multiple regression
models are executed.
The linear multiple regression analysis was employed in order to empirically identify
whether the response was a statistically important to all other factors or not. The equation is,
Y1=β0 +β1* X1 + …..+ β8 * X8 + μ, where Y1 refers to headcounts of pupils, β0 refers to the
constant or the intercept, X1, X2, …., X8 refers to the all other factors as predictors, β1, β2….β8
refers to the change of coefficient for the different predictors, while μ refers to the error term.
The regression result shows the goodness of fit for the regression between the Predictors and
response.
Linear multiple regression model is a commonly used generalized form of regression
model where the response factor linearly relates with the parameters of explanatory variables. In
linear regression model, the response variable should be continuous and dependent with
explanatory variables. R2 is known as the coefficient of determination. In multiple linear

5STATISTICS ASSIGNMENT
regression, R2 can assume the values between 0 and 1. For interpreting the direction of
relationship between variables of the regression model, we observe the values of the β
coefficients. If β is positive, the association of the variable with dependent variable is positive. If
β is negative, the association of the variable with dependent variable is negative. If the
coefficient β is equal to 0, then there is no relationship between the variables.
The high value of multiple R2 (near to 1) gives the signal of strong linear relationship, the
lowest value (near to -1) shows strong negative linear relationship and the value near to zero
gives the signal to weakest linear relationship with response and predictors. Multiple regression
equation also can calculate the regression value if all the parameters of simple linear regression
taken together in case of dichotomous (continuous or discrete) response parameter. The R-square
value is an indicator of how perfectly the model fits the data.
⊘ This is a preview!⊘
Do you want full access?
Subscribe today to unlock all pages.

Trusted by 1+ million students worldwide

6STATISTICS ASSIGNMENT
The linearly fitted model is-
Fte.pupils = 0.08444 + 0.502938b * headcount.time.pupils + 0.497060 * full.time.pupils.
As the value of multiple R2 is 1, we can tell that there exists the perfect significant
association among fte.pupils with headcounts of pupils and full.time.pupils. It also interprets
100.00% of the variations in the fte.pupils could be explained by the variations of
headcount.time.pupils and full.time.pupils. Obviously, the residual status is 0%. The Value of
adjusted R2 (1) indicates a very good (0.7 to 1 or -0.7 to -1) fitting as per the rules of goodness of
fit. The two variables headcount.time.pupils and full.time.pupils have positive relationship with
fte.pupils.
The insignificant p-value of product line (0.0) has p-value less than 0.05. Therefore, we
can reject the null hypothesis of absence of linear relationship among these three factors at 95%
confidence limit.
Paraphrase This Document
Need a fresh take? Get an instant paraphrase of this document with our AI Paraphraser

7STATISTICS ASSIGNMENT
The 95% confidence interval has calculated in case of the parameters of the multiple
regression model. The ANOVA model and variance covariance matrix had been calculated in the
analysis. The predictors, headcount.time.pupils and full.time.pupils both are very significant with
the response fte.pupil.

8STATISTICS ASSIGNMENT
The residual values of the regression model and the fitted values are well fitted in the graph.
⊘ This is a preview!⊘
Do you want full access?
Subscribe today to unlock all pages.

Trusted by 1+ million students worldwide

9STATISTICS ASSIGNMENT
The normal QQ plot indicates a perfect linear relationship with standardized residuals and
theoretical quantiles with a perfect fitting.
The normal QQ plot indicates a perfect linear relationship with standardized residuals and
theoretical quantiles with a perfect fitting.
Paraphrase This Document
Need a fresh take? Get an instant paraphrase of this document with our AI Paraphraser

10STATISTICS ASSIGNMENT
The red coloured fitted line shows a fantastic fit in the graph of square root of
standardised residuals vs. fitted values.
The red coloured fitted line shows a fantastic fit in the graph of square root of
standardised residuals vs. fitted values.

11STATISTICS ASSIGNMENT
The graph of standardised residuals and Leverage shows a perfect fitting among the three
variables.
Logistic Regression Model:
Logistic linear regression is a special type of generalised linear model (GLM). Logistic
regression model is a regression model where dependent variable or response is categorical. The
report executes binary response variable. The predictors could be numerical or categorical in
⊘ This is a preview!⊘
Do you want full access?
Subscribe today to unlock all pages.

Trusted by 1+ million students worldwide
1 out of 37
Your All-in-One AI-Powered Toolkit for Academic Success.
+13062052269
info@desklib.com
Available 24*7 on WhatsApp / Email
Unlock your academic potential
Copyright © 2020–2026 A2Z Services. All Rights Reserved. Developed and managed by ZUCOL.

