Statistics Homework: Central Tendency

Verified

Added on  2019/09/23

|2
|505
|88
Homework Assignment
AI Summary
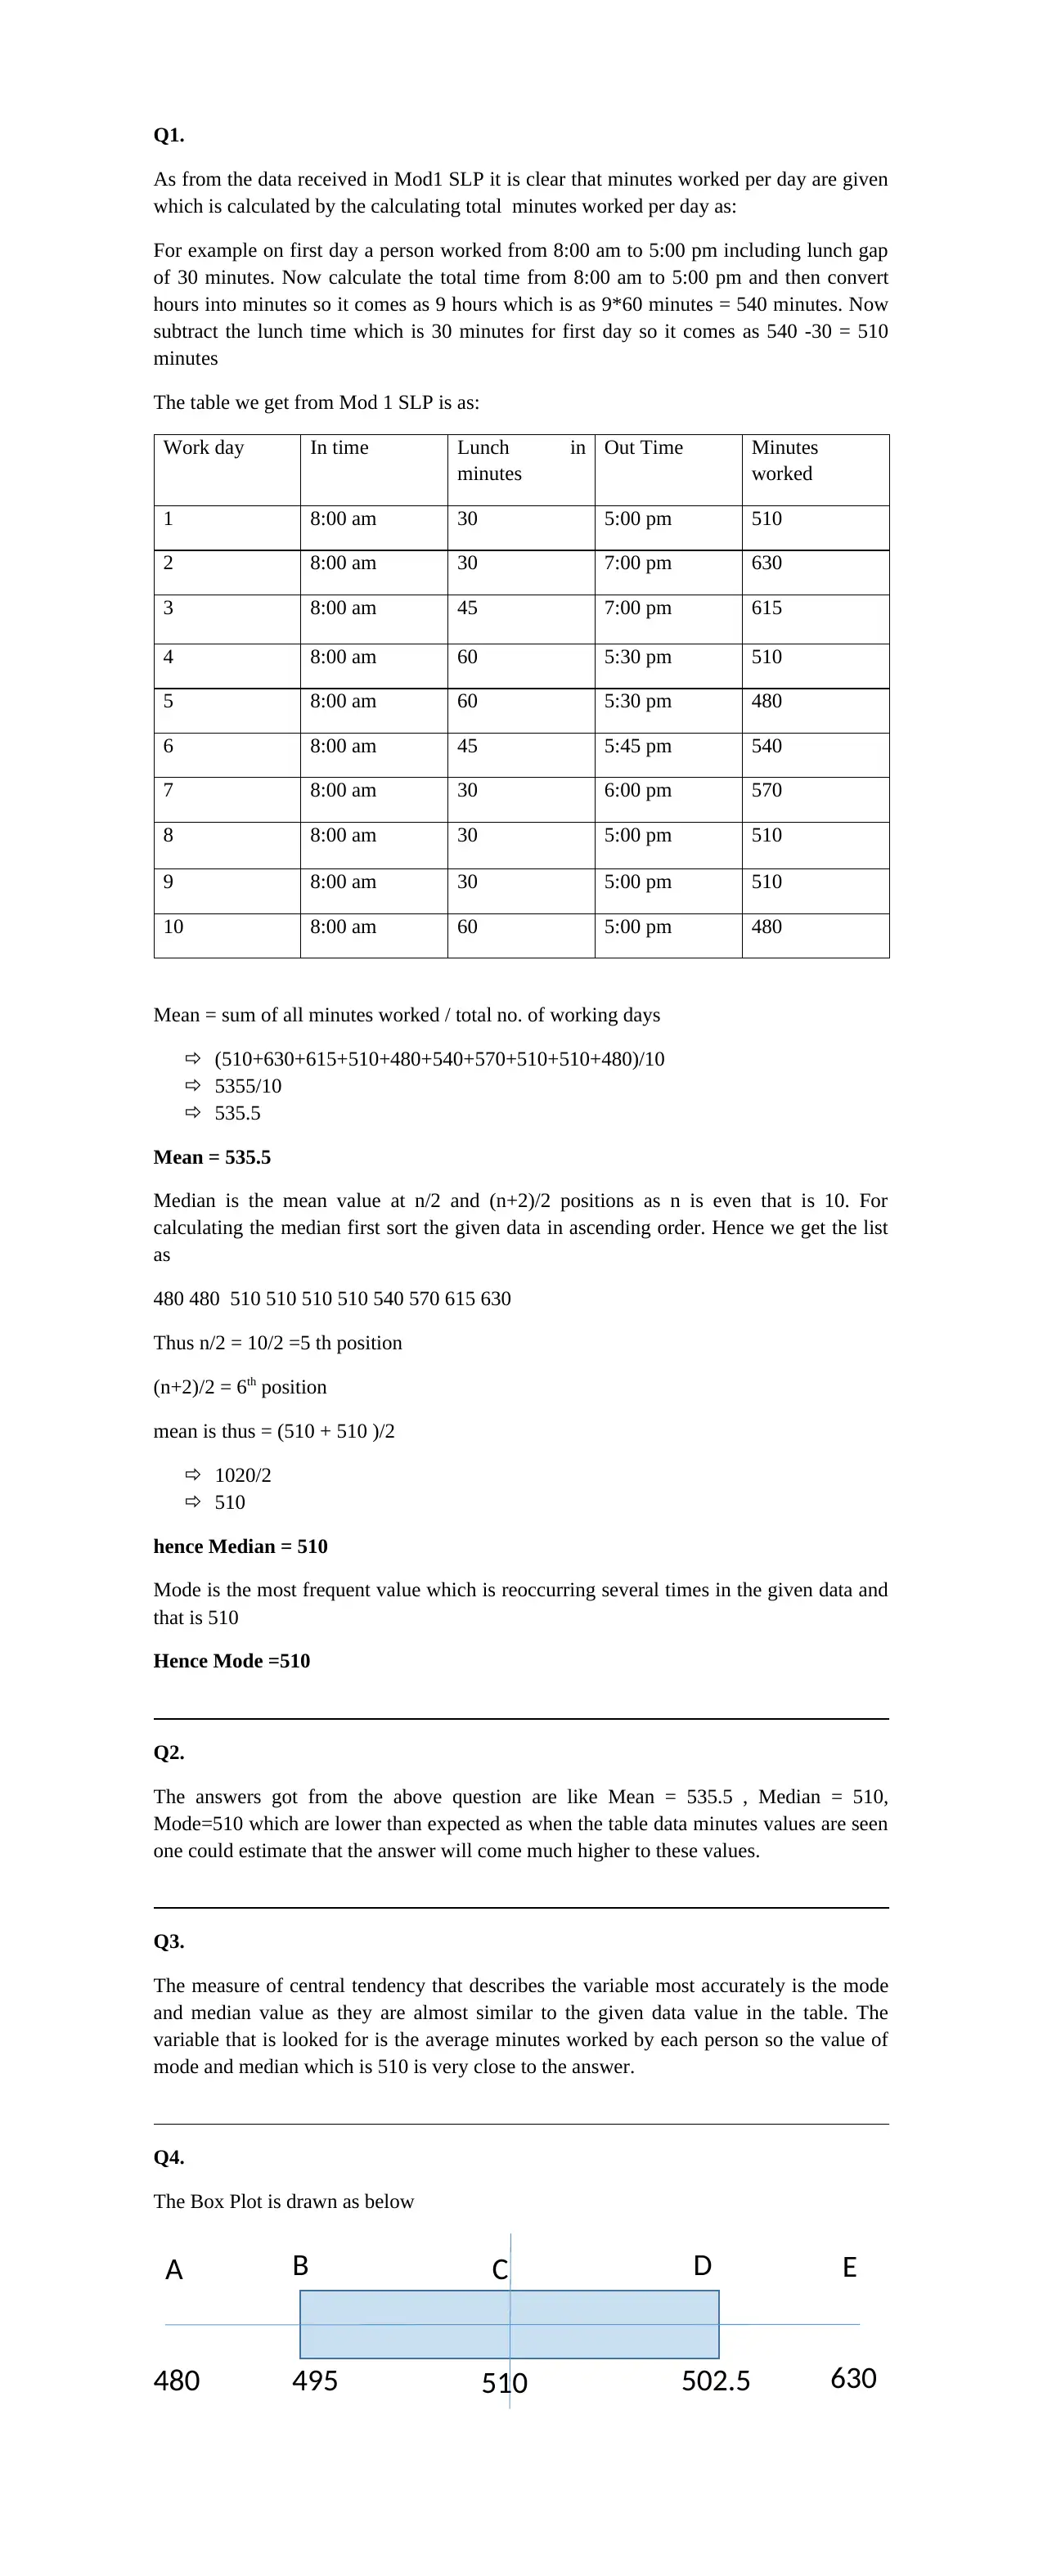
This homework assignment focuses on descriptive statistics, specifically calculating the mean, median, and mode of a dataset representing daily work minutes. The assignment details the calculation process for each measure of central tendency, showing the steps involved in converting hours to minutes and accounting for lunch breaks. It then analyzes the results, comparing the calculated values to expectations and determining which measure best represents the data. Finally, it includes a hand-drawn box plot illustrating the data's distribution. The solution demonstrates a clear understanding of statistical concepts and their application to real-world data.
Document Page
Q1.
As from the data received in Mod1 SLP it is clear that minutes worked per day are given
which is calculated by the calculating total minutes worked per day as:
For example on first day a person worked from 8:00 am to 5:00 pm including lunch gap
of 30 minutes. Now calculate the total time from 8:00 am to 5:00 pm and then convert
hours into minutes so it comes as 9 hours which is as 9*60 minutes = 540 minutes. Now
subtract the lunch time which is 30 minutes for first day so it comes as 540 -30 = 510
minutes
The table we get from Mod 1 SLP is as:
Work day In time Lunch in
minutes
Out Time Minutes
worked
1 8:00 am 30 5:00 pm 510
2 8:00 am 30 7:00 pm 630
3 8:00 am 45 7:00 pm 615
4 8:00 am 60 5:30 pm 510
5 8:00 am 60 5:30 pm 480
6 8:00 am 45 5:45 pm 540
7 8:00 am 30 6:00 pm 570
8 8:00 am 30 5:00 pm 510
9 8:00 am 30 5:00 pm 510
10 8:00 am 60 5:00 pm 480
Mean = sum of all minutes worked / total no. of working days
(510+630+615+510+480+540+570+510+510+480)/10
5355/10
535.5
Mean = 535.5
Median is the mean value at n/2 and (n+2)/2 positions as n is even that is 10. For
calculating the median first sort the given data in ascending order. Hence we get the list
as
480 480 510 510 510 510 540 570 615 630
Thus n/2 = 10/2 =5 th position
(n+2)/2 = 6th position
mean is thus = (510 + 510 )/2
1020/2
510
hence Median = 510
Mode is the most frequent value which is reoccurring several times in the given data and
that is 510
Hence Mode =510
Q2.
The answers got from the above question are like Mean = 535.5 , Median = 510,
Mode=510 which are lower than expected as when the table data minutes values are seen
one could estimate that the answer will come much higher to these values.
Q3.
The measure of central tendency that describes the variable most accurately is the mode
and median value as they are almost similar to the given data value in the table. The
variable that is looked for is the average minutes worked by each person so the value of
mode and median which is 510 is very close to the answer.
Q4.
The Box Plot is drawn as below
EDCA B
495480 630502.5510
tabler-icon-diamond-filled.svg

Paraphrase This Document

Need a fresh take? Get an instant paraphrase of this document with our AI Paraphraser
Document Page
Here C is the Median value , A is the lower quartile, E is the upper quartile, B is the
median obtained of the first half list and D is the median obtained of second half list.
chevron_up_icon
1 out of 2
circle_padding
hide_on_mobile
zoom_out_icon
[object Object]