QUA4A5: Comprehensive Data Analysis of TfL Bike Hire Scheme Project
VerifiedAdded on 2023/04/23
|15
|2836
|342
Project
AI Summary
This project analyzes the Transport for London (TfL) bike hire scheme data from July 2014 to August 2018. The analysis begins with descriptive statistics, including the calculation of the average number of bikes hired per day, standard deviation, and a 95% confidence interval. The project then explores sample data, comparing descriptive statistics of samples with varying sizes (10, 50, and 500 observations) to the population data. Time series analysis and forecasting are conducted using Excel's Forecast function to predict bike hires, followed by an investigation of daily and seasonal hiring patterns. The project also examines the correlation between temperature and bike hires, constructing a linear regression model to assess the impact of temperature on bike hiring. The findings highlight the importance of understanding seasonal demand, temperature influences, and the need for optimized bike redistribution to improve operational efficiency and financial outcomes for TfL.

1
QUA4A5 Group Project – Assessment 3
QUA4A5 Group Project – Assessment 3
Paraphrase This Document
Need a fresh take? Get an instant paraphrase of this document with our AI Paraphraser

2
Task 1
A. Average number of bikes hired from the docks was evaluated to be 29279.92 or
approximately 29280 per day between July 2014 and August 2018. Standard deviation of
bikes hired from the docks was evaluated to be 11418.19 or approximately 11419 per day.
The number of observations in the sample is 1494
( n )
, which is also considered to be the
population (Anderson, Sweeney, Williams, Camm & Cochran, 2017).
The 95% confidence interval for population of bike hired is calculated as
x
¿
±Z0 . 25∗ s
√ n =
[ 29279 . 92−1. 96∗11418 .19
√ 1494 ,29279 . 92−1 .96∗11418 . 19
√ 1494 ]= [ 28700 . 93 , 29585. 91 ]
wh
ere
Z0 . 25=1. 96
.
Hence, with 95% confidence it is possible to say that average number of bikes hired from the
docks would be somewhere between 28701 and 29586 per day, between July 2014 and
August 2018.
Population of bikes for daily hires was analysed using descriptive statistics. Within the time
period of July 2014 to August 2018, a maximum of 63732 bikes and a minimum of 3593
bikes were hired per day. Number of daily hires has been plotted graphically using a Boxplot
and a frequency histogram (Newbold, Carlson & Thorne, 2012).

3
Figure 1: Histogram and Boxplot of daily hires of bicycles
B. Figure 1 indicates that the median number of bikes was slightly less than 30000 bikes per
day. The exact value of median was evaluated as 28377.5 or approximately as 28378 bikes
per day. The median was slightly less than the mean number of bikes hired daily, which
indicated a little positive skewness in the distribution of number of bicycles hired daily. The
histogram of daily hired bikes also represents that the distribution is almost normal.
Approximately on 50% of the days, number of bikes hired was less than 28378 and on rest of
days more than 28378 bikes were hired. The first quartile is noted to be somewhere around
twenty thousand bikes per day
( Q1=21862 )
and the third quartile is pointed out to be just
above 35000 bikes
( Q3=36361 .3 or 36362 )
. Hence, middle 50% of the demand of bikes by
customers varied between 21862 and 36362 bikes per day. The lowest 25% hiring of bikes
hired in day was below 21862, and top 25% hiring was above 36362 bikes.
C. In the statistical analysis, the characteristics of interest are always average or standard
deviation. Therefore, it is required to estimate the distribution of samples for mean. The
sample itself does not contain enough information to perform this operation. The shape and
form of the sampling distribution are always assumed to be normal (Ghasemi & Zahediasl,
2012).
The first known characteristic of the normal distribution is that, given the random and
⊘ This is a preview!⊘
Do you want full access?
Subscribe today to unlock all pages.
Trusted by 1+ million students worldwide
4
independent samples of N observations, the distribution of the sample mean is normal and
impartial, regardless of the size of N. Therefore, if we assume that the population is normal,
then it is always safe to make parametric assumptions about the distribution of the sample,
regardless of the size of the sample. The second known characteristic of the normal
distribution indicates that sample and variance of the sample are independent in random and
independent observations. Therefore, assuming that estimation of population mean and
variance are independent, the sample average and sample deviation are used to make these
estimates. So we assume that the population is normal.
Task 2
A. Three samples of size 10, 50 and 500 were randomly generated in Excel using
RANDBETWEEN function. First 10 observations for each of the three samples have been
presented in the following table. The formula used for the sample selection is “INDEX
($A$2:$A$15000, RANDBETWEEN (2, COUNTA ($A$2:$A$15000)), 1)”.
Table 1: First 10 observation of three samples
Number of
Bicycles_10
Number of
Bicycles_50
Number of
Bicycles_500
38131 29989 26520
55958 52787 34608
38243 20439 27301
27706 27071 58002
58531 15938 29047
39725 20919 28043
47524 48955 13612
45929 6242 37514
41468 42935 31436
18135 34115 15059
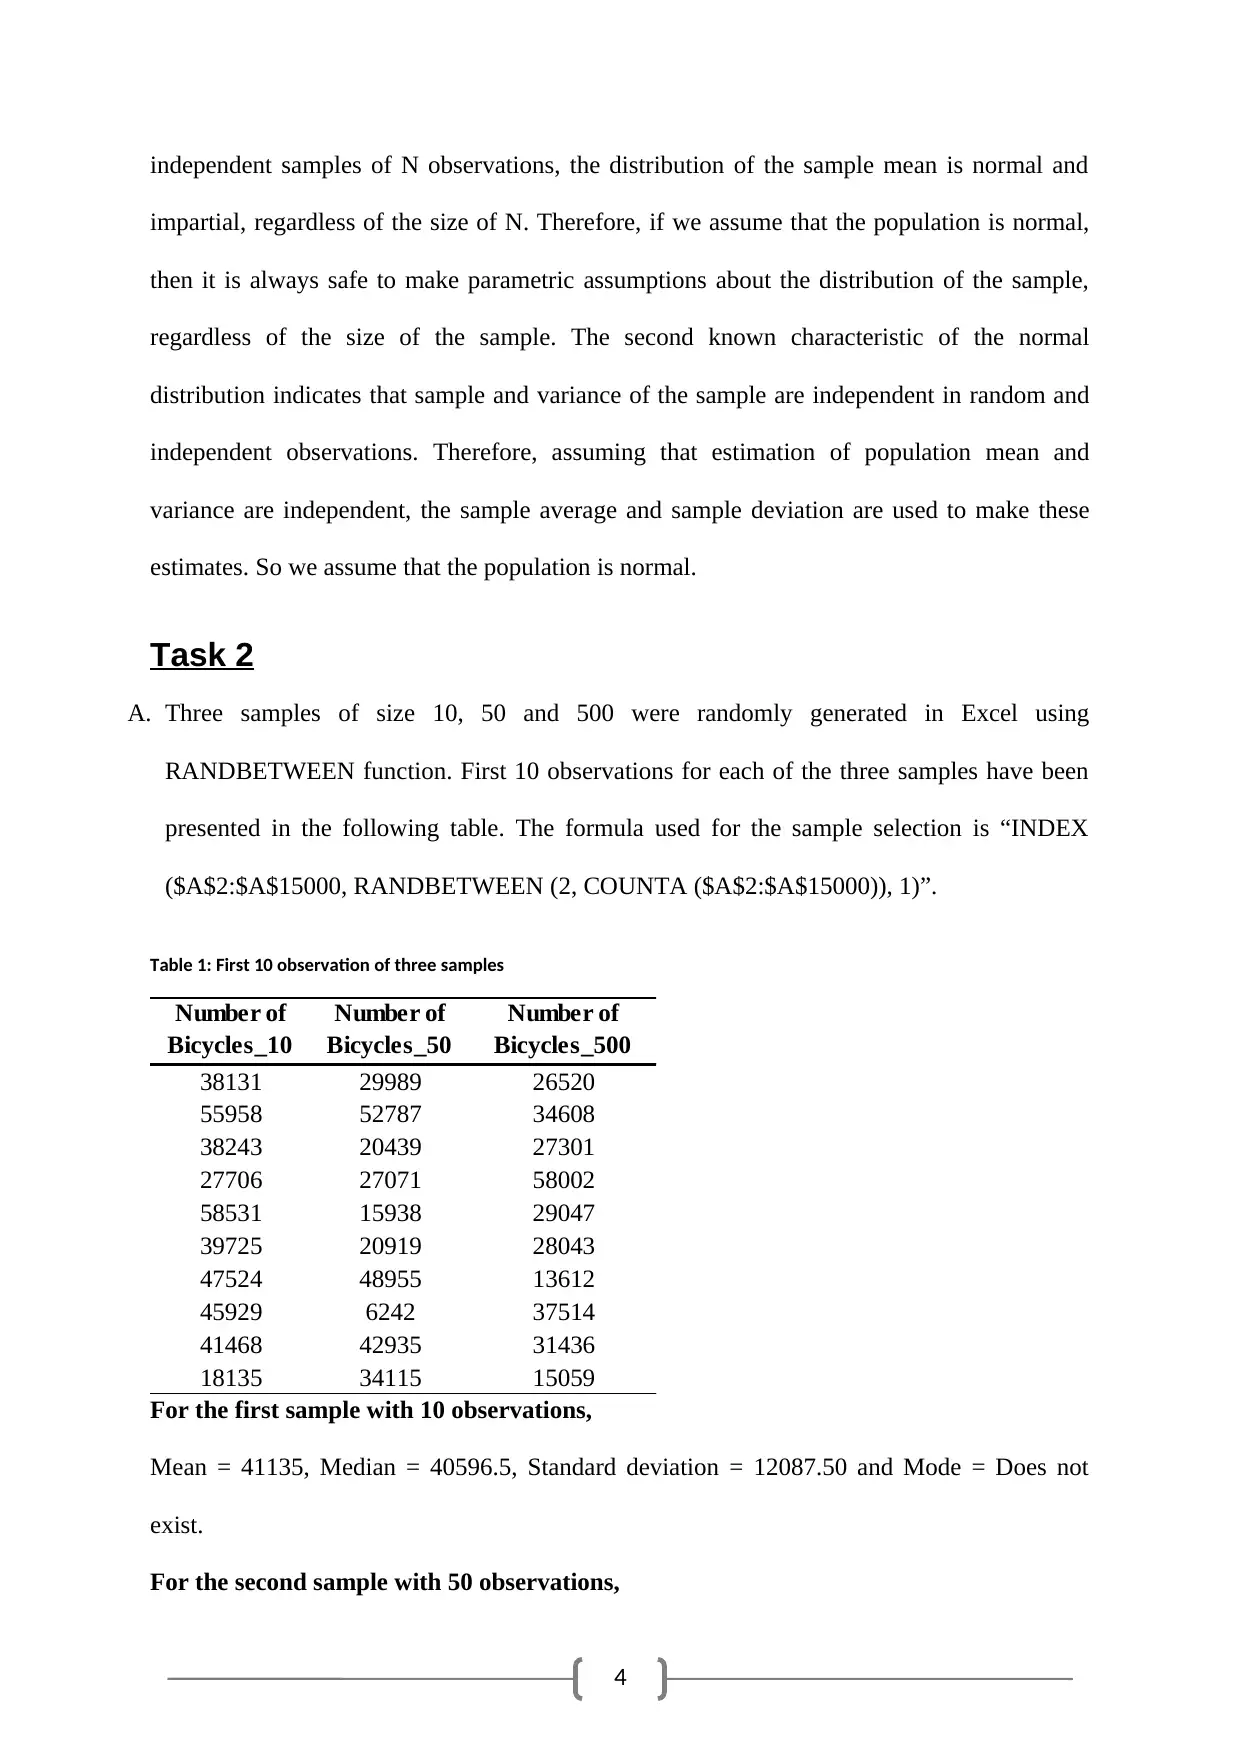
For the first sample with 10 observations,
Mean = 41135, Median = 40596.5, Standard deviation = 12087.50 and Mode = Does not
exist.
For the second sample with 50 observations,
independent samples of N observations, the distribution of the sample mean is normal and
impartial, regardless of the size of N. Therefore, if we assume that the population is normal,
then it is always safe to make parametric assumptions about the distribution of the sample,
regardless of the size of the sample. The second known characteristic of the normal
distribution indicates that sample and variance of the sample are independent in random and
independent observations. Therefore, assuming that estimation of population mean and
variance are independent, the sample average and sample deviation are used to make these
estimates. So we assume that the population is normal.
Task 2
A. Three samples of size 10, 50 and 500 were randomly generated in Excel using
RANDBETWEEN function. First 10 observations for each of the three samples have been
presented in the following table. The formula used for the sample selection is “INDEX
($A$2:$A$15000, RANDBETWEEN (2, COUNTA ($A$2:$A$15000)), 1)”.
Table 1: First 10 observation of three samples
Number of
Bicycles_10
Number of
Bicycles_50
Number of
Bicycles_500
38131 29989 26520
55958 52787 34608
38243 20439 27301
27706 27071 58002
58531 15938 29047
39725 20919 28043
47524 48955 13612
45929 6242 37514
41468 42935 31436
18135 34115 15059
For the first sample with 10 observations,
Mean = 41135, Median = 40596.5, Standard deviation = 12087.50 and Mode = Does not
exist.
For the second sample with 50 observations,
Paraphrase This Document
Need a fresh take? Get an instant paraphrase of this document with our AI Paraphraser

5
Mean = 32140.62, Median = 30790, Standard deviation = 12518.72 and Mode = Does not
exist.
For the third sample with 500 observations,
Mean = 29100.10, Median = 27749, Standard deviation = 11470.59 and Mode = 20432.
B. For the population, average number of bikes hired was evaluated to be approximately 29280
per day. Standard deviation of bikes hired from the docks was evaluated to be approximately
11419 per day. The exact value of median was evaluated approximately as 28378 bikes per
day.
Now, it can be noted that with increase in sample size descriptive statistics of samples
converge towards the descriptive values of the population. Mean, standard deviation,
median for the sample with 10 observations were noticeably different than those of the
population. But, similar descriptive measures of sample with 500 observations were
very close to descriptive values of the population. Hence, greater the sample size better is
the characteristics of the sample. Also, the distribution of the samples behaves in line with the
population.
For the first sample with 10 observations,
Mean = 41135, Standard deviation = 12087.50
For the second sample with 50 observations,
Mean = 32140.62, Standard deviation = 12518.72
For the third sample with 500 observations,
Mean = 29100.10, Standard deviation = 11470.59
Margin of error depends directly on the sample size and sample standard deviation. Increase
in sample size will reduce the margin of error. Reduced margin of error decreases the length
of the confidence interval and increases the predictability of the population mean. Therefore,
increase in sample size increases validity and reliability of statistical inference and results,

6
which almost accurately estimates the population (Herkenhoff & Fogli, 2013).
Task 3
A. The Forecast function was used in Excel to predict the number of bikes (bicycles) hired based
on a linear trend. The predicted number of bikes for the missing observation was calculated to
be approximately 32455 per day. Figure 2 presents the linear trend of bicycle hiring for
consecutive 6 days in summer. The Forecast function used the previous five observations for
number of bikes hired in summer as given “y” values to predict the next value for number of
hires. The period 1490 – 1494 were considered as the available values of “x”.
Figure 2: Line diagram for number of bicycles hired
⊘ This is a preview!⊘
Do you want full access?
Subscribe today to unlock all pages.
Trusted by 1+ million students worldwide

7
The result reflects a clear seesaw pattern with increasing range of fluctuation. The predicted
value for number of bikes (bicycles) hires was an apparent correction of the greater variation
in the previous two periods. A linear trend line from the data was obtained as
Number of bikes hired= 104 .23∗Period +31830 . The coefficient of determination implied
that a mere 5.65% variation of bike hiring was explained by linear dependence on the period.
The result also points towards the requirement of further investigation to identify relevant
predictors with greater impact (Frumkin, 2015).
Docking machines redistribute bikes that customers leave back at various places throughout
London. Hence, the management should look forward to arrange more bikes at the beginning
of every alternate day. So, TfL should look forward to redistribute the docking machines
according to the fluctuating demand pattern of bikes. Optimized distribution of loads will
help the company in saving money by appointing correct man power (Carlberg, 2015).
Paraphrase This Document
Need a fresh take? Get an instant paraphrase of this document with our AI Paraphraser

8
Task 4
A. Average numbers of bikes hired per day (Monday to Sunday) for the population were
calculated (Grech, 2018). Table 3 presents daily average of bikes hired, and the
corresponding bar diagram illustrates the data in the table. From Table 3 it can be noted that
people were hiring bikes mostly on Sundays, Mondays, and Saturdays. Director of operations
in Transport for London's should look towards arranging for more bikes on these particular
days of a week compared to other weekdays.
Table 2: Average number of bikes hired per day (Monday to Sunday)
Day Average of Number of Bicycles
Monday 31733.57
Tuesday 30510.30
Wednesday 25491.34
Thursday 23791.32
Friday 29313.86
Saturday 31605.84
Sunday 32551.00
Grand Total 29279.92
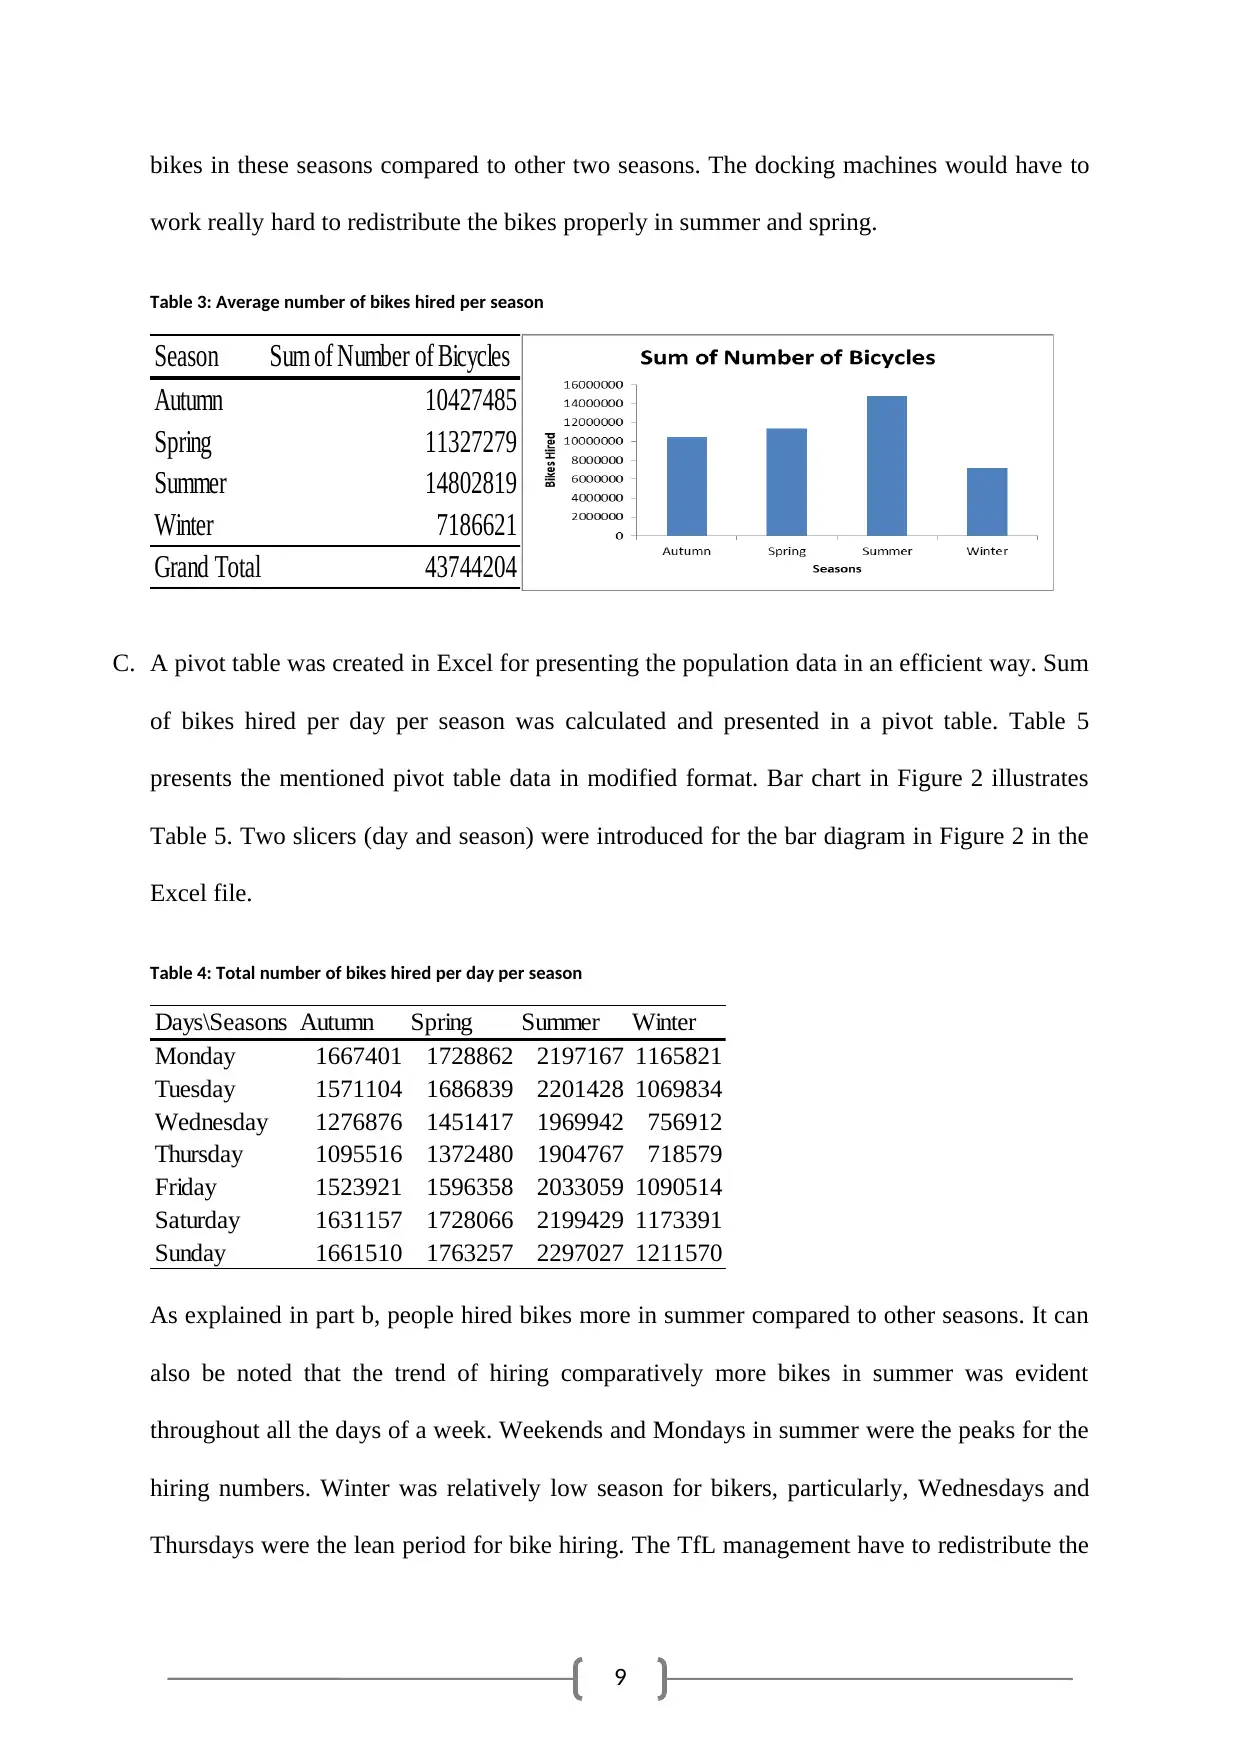
B. Total numbers of bikes hired per season for the population were calculated. Table 4 presents
sum of bikes hired, and the corresponding bar diagram illustrates the data in the table. From
Table 4 it can be noted that people were hiring bikes mostly in summer and in spring.
Director of operations in Transport for London's should look towards arranging for more
Task 4
A. Average numbers of bikes hired per day (Monday to Sunday) for the population were
calculated (Grech, 2018). Table 3 presents daily average of bikes hired, and the
corresponding bar diagram illustrates the data in the table. From Table 3 it can be noted that
people were hiring bikes mostly on Sundays, Mondays, and Saturdays. Director of operations
in Transport for London's should look towards arranging for more bikes on these particular
days of a week compared to other weekdays.
Table 2: Average number of bikes hired per day (Monday to Sunday)
Day Average of Number of Bicycles
Monday 31733.57
Tuesday 30510.30
Wednesday 25491.34
Thursday 23791.32
Friday 29313.86
Saturday 31605.84
Sunday 32551.00
Grand Total 29279.92
B. Total numbers of bikes hired per season for the population were calculated. Table 4 presents
sum of bikes hired, and the corresponding bar diagram illustrates the data in the table. From
Table 4 it can be noted that people were hiring bikes mostly in summer and in spring.
Director of operations in Transport for London's should look towards arranging for more
9
bikes in these seasons compared to other two seasons. The docking machines would have to
work really hard to redistribute the bikes properly in summer and spring.
Table 3: Average number of bikes hired per season
Season Sum of Number of Bicycles
Autumn 10427485
Spring 11327279
Summer 14802819
Winter 7186621
Grand Total 43744204
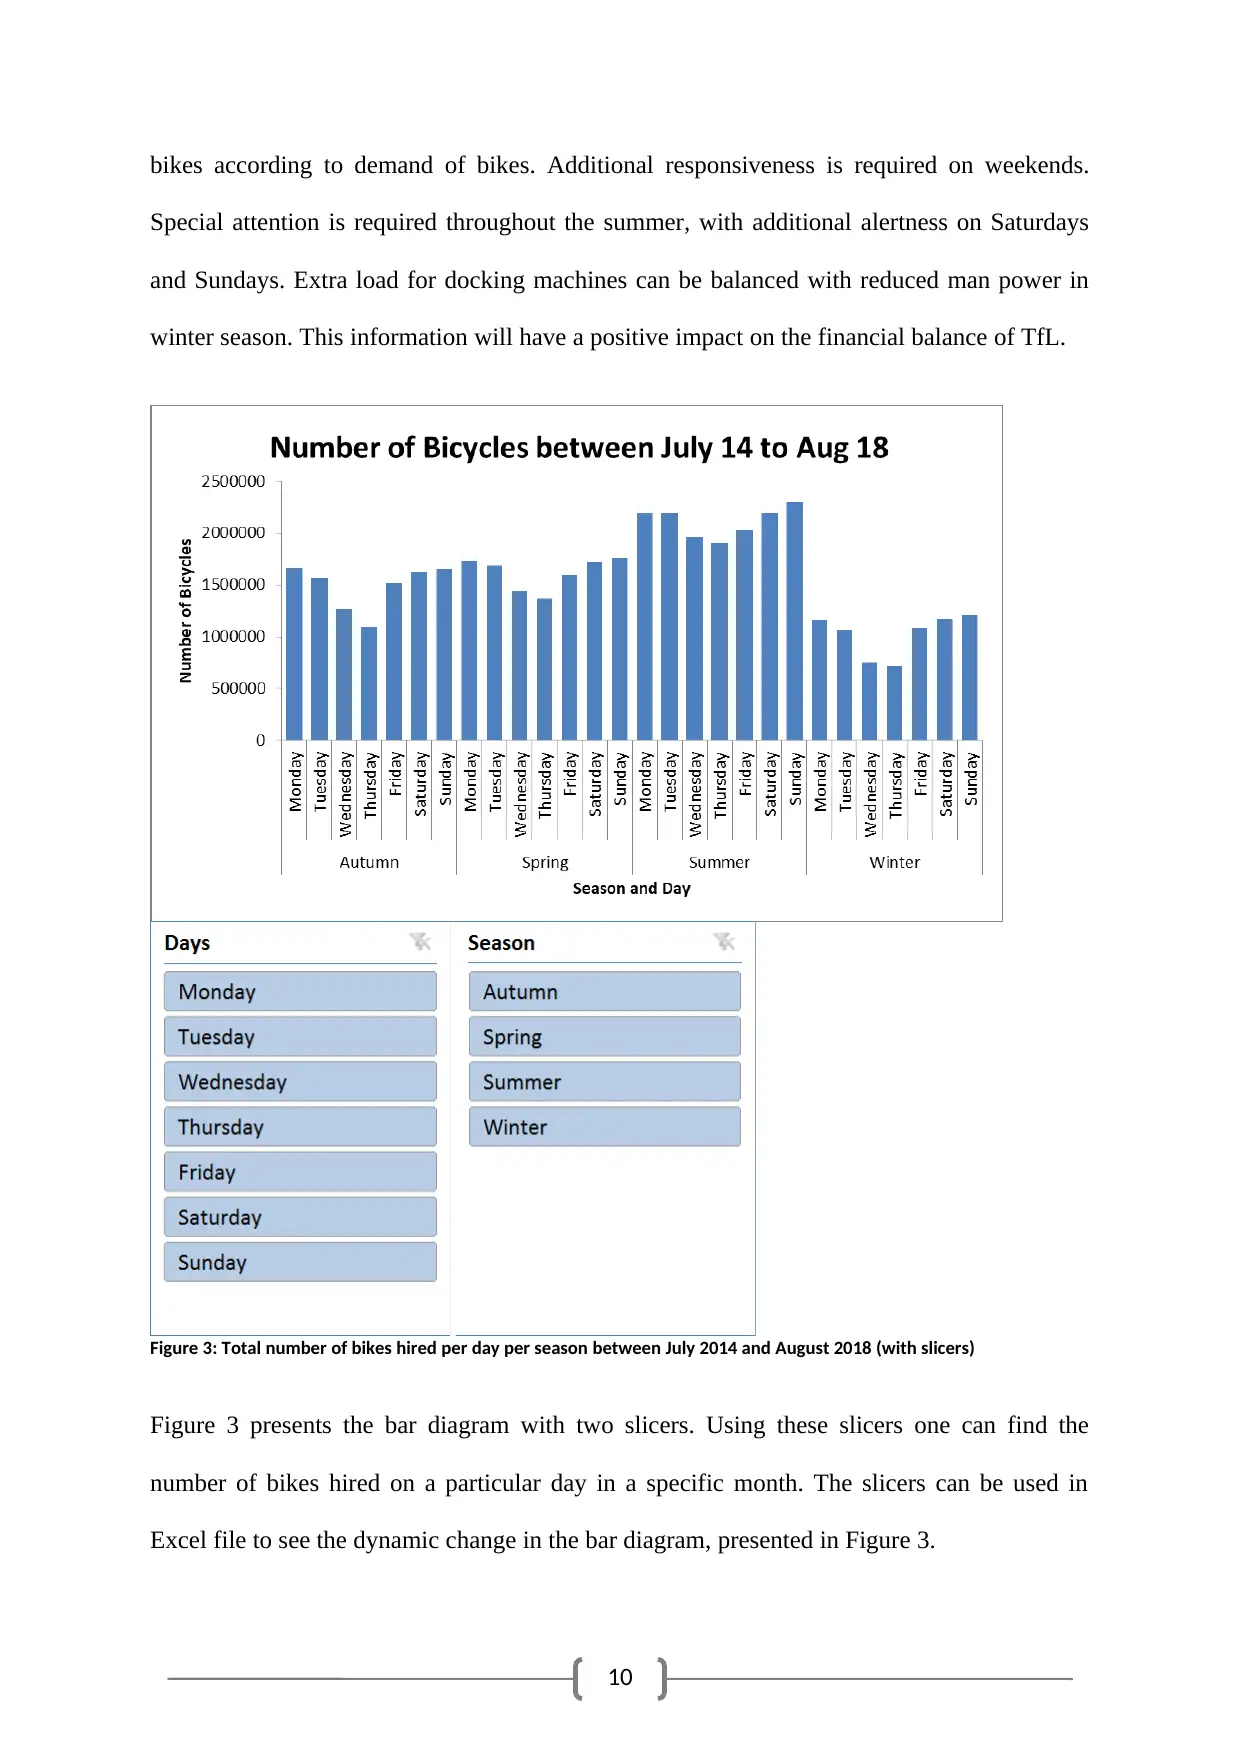
C. A pivot table was created in Excel for presenting the population data in an efficient way. Sum
of bikes hired per day per season was calculated and presented in a pivot table. Table 5
presents the mentioned pivot table data in modified format. Bar chart in Figure 2 illustrates
Table 5. Two slicers (day and season) were introduced for the bar diagram in Figure 2 in the
Excel file.
Table 4: Total number of bikes hired per day per season
Days\Seasons Autumn Spring Summer Winter
Monday 1667401 1728862 2197167 1165821
Tuesday 1571104 1686839 2201428 1069834
Wednesday 1276876 1451417 1969942 756912
Thursday 1095516 1372480 1904767 718579
Friday 1523921 1596358 2033059 1090514
Saturday 1631157 1728066 2199429 1173391
Sunday 1661510 1763257 2297027 1211570
As explained in part b, people hired bikes more in summer compared to other seasons. It can
also be noted that the trend of hiring comparatively more bikes in summer was evident
throughout all the days of a week. Weekends and Mondays in summer were the peaks for the
hiring numbers. Winter was relatively low season for bikers, particularly, Wednesdays and
Thursdays were the lean period for bike hiring. The TfL management have to redistribute the
bikes in these seasons compared to other two seasons. The docking machines would have to
work really hard to redistribute the bikes properly in summer and spring.
Table 3: Average number of bikes hired per season
Season Sum of Number of Bicycles
Autumn 10427485
Spring 11327279
Summer 14802819
Winter 7186621
Grand Total 43744204
C. A pivot table was created in Excel for presenting the population data in an efficient way. Sum
of bikes hired per day per season was calculated and presented in a pivot table. Table 5
presents the mentioned pivot table data in modified format. Bar chart in Figure 2 illustrates
Table 5. Two slicers (day and season) were introduced for the bar diagram in Figure 2 in the
Excel file.
Table 4: Total number of bikes hired per day per season
Days\Seasons Autumn Spring Summer Winter
Monday 1667401 1728862 2197167 1165821
Tuesday 1571104 1686839 2201428 1069834
Wednesday 1276876 1451417 1969942 756912
Thursday 1095516 1372480 1904767 718579
Friday 1523921 1596358 2033059 1090514
Saturday 1631157 1728066 2199429 1173391
Sunday 1661510 1763257 2297027 1211570
As explained in part b, people hired bikes more in summer compared to other seasons. It can
also be noted that the trend of hiring comparatively more bikes in summer was evident
throughout all the days of a week. Weekends and Mondays in summer were the peaks for the
hiring numbers. Winter was relatively low season for bikers, particularly, Wednesdays and
Thursdays were the lean period for bike hiring. The TfL management have to redistribute the
⊘ This is a preview!⊘
Do you want full access?
Subscribe today to unlock all pages.
Trusted by 1+ million students worldwide
10
bikes according to demand of bikes. Additional responsiveness is required on weekends.
Special attention is required throughout the summer, with additional alertness on Saturdays
and Sundays. Extra load for docking machines can be balanced with reduced man power in
winter season. This information will have a positive impact on the financial balance of TfL.
Figure 3: Total number of bikes hired per day per season between July 2014 and August 2018 (with slicers)
Figure 3 presents the bar diagram with two slicers. Using these slicers one can find the
number of bikes hired on a particular day in a specific month. The slicers can be used in
Excel file to see the dynamic change in the bar diagram, presented in Figure 3.
Paraphrase This Document
Need a fresh take? Get an instant paraphrase of this document with our AI Paraphraser
11
Task 5
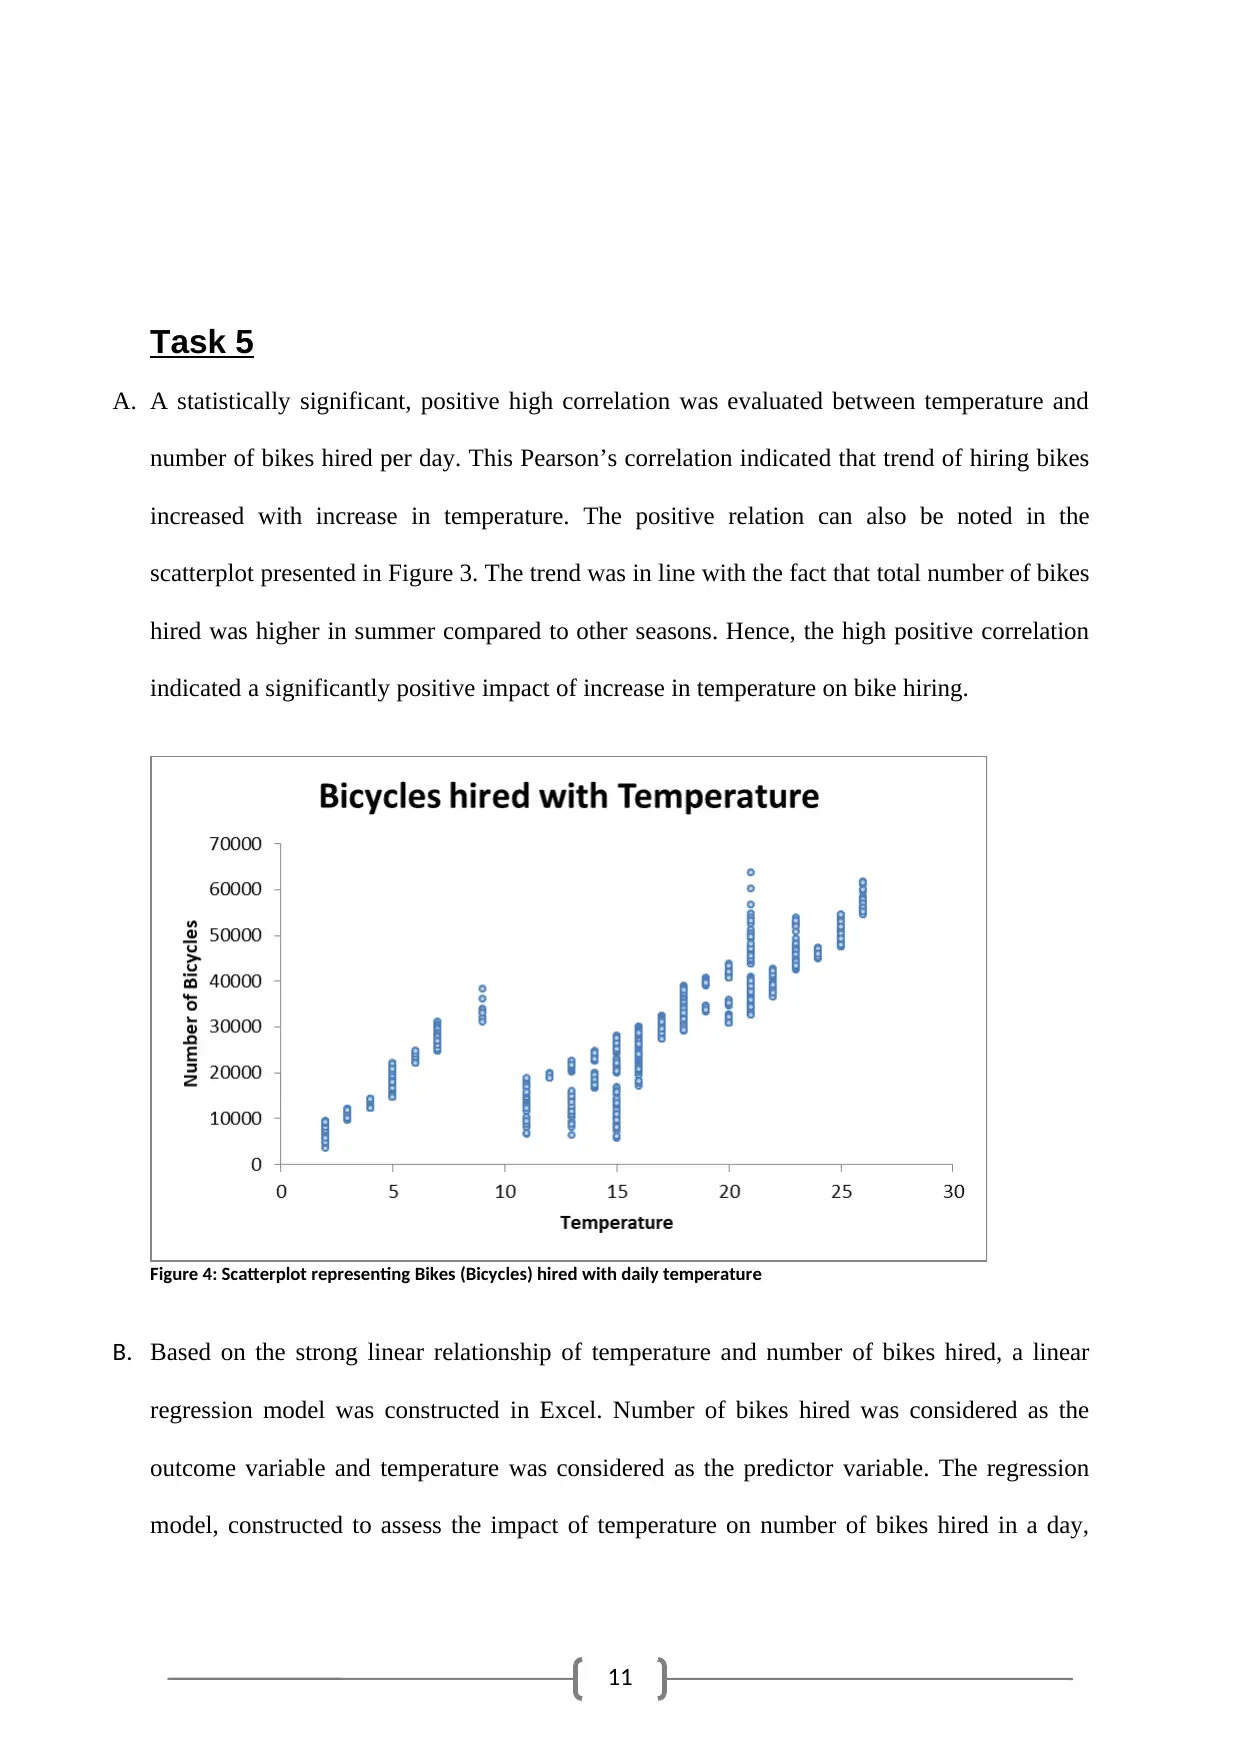
A. A statistically significant, positive high correlation was evaluated between temperature and
number of bikes hired per day. This Pearson’s correlation indicated that trend of hiring bikes
increased with increase in temperature. The positive relation can also be noted in the
scatterplot presented in Figure 3. The trend was in line with the fact that total number of bikes
hired was higher in summer compared to other seasons. Hence, the high positive correlation
indicated a significantly positive impact of increase in temperature on bike hiring.
Figure 4: Scatterplot representing Bikes (Bicycles) hired with daily temperature
B. Based on the strong linear relationship of temperature and number of bikes hired, a linear
regression model was constructed in Excel. Number of bikes hired was considered as the
outcome variable and temperature was considered as the predictor variable. The regression
model, constructed to assess the impact of temperature on number of bikes hired in a day,
Task 5
A. A statistically significant, positive high correlation was evaluated between temperature and
number of bikes hired per day. This Pearson’s correlation indicated that trend of hiring bikes
increased with increase in temperature. The positive relation can also be noted in the
scatterplot presented in Figure 3. The trend was in line with the fact that total number of bikes
hired was higher in summer compared to other seasons. Hence, the high positive correlation
indicated a significantly positive impact of increase in temperature on bike hiring.
Figure 4: Scatterplot representing Bikes (Bicycles) hired with daily temperature
B. Based on the strong linear relationship of temperature and number of bikes hired, a linear
regression model was constructed in Excel. Number of bikes hired was considered as the
outcome variable and temperature was considered as the predictor variable. The regression
model, constructed to assess the impact of temperature on number of bikes hired in a day,
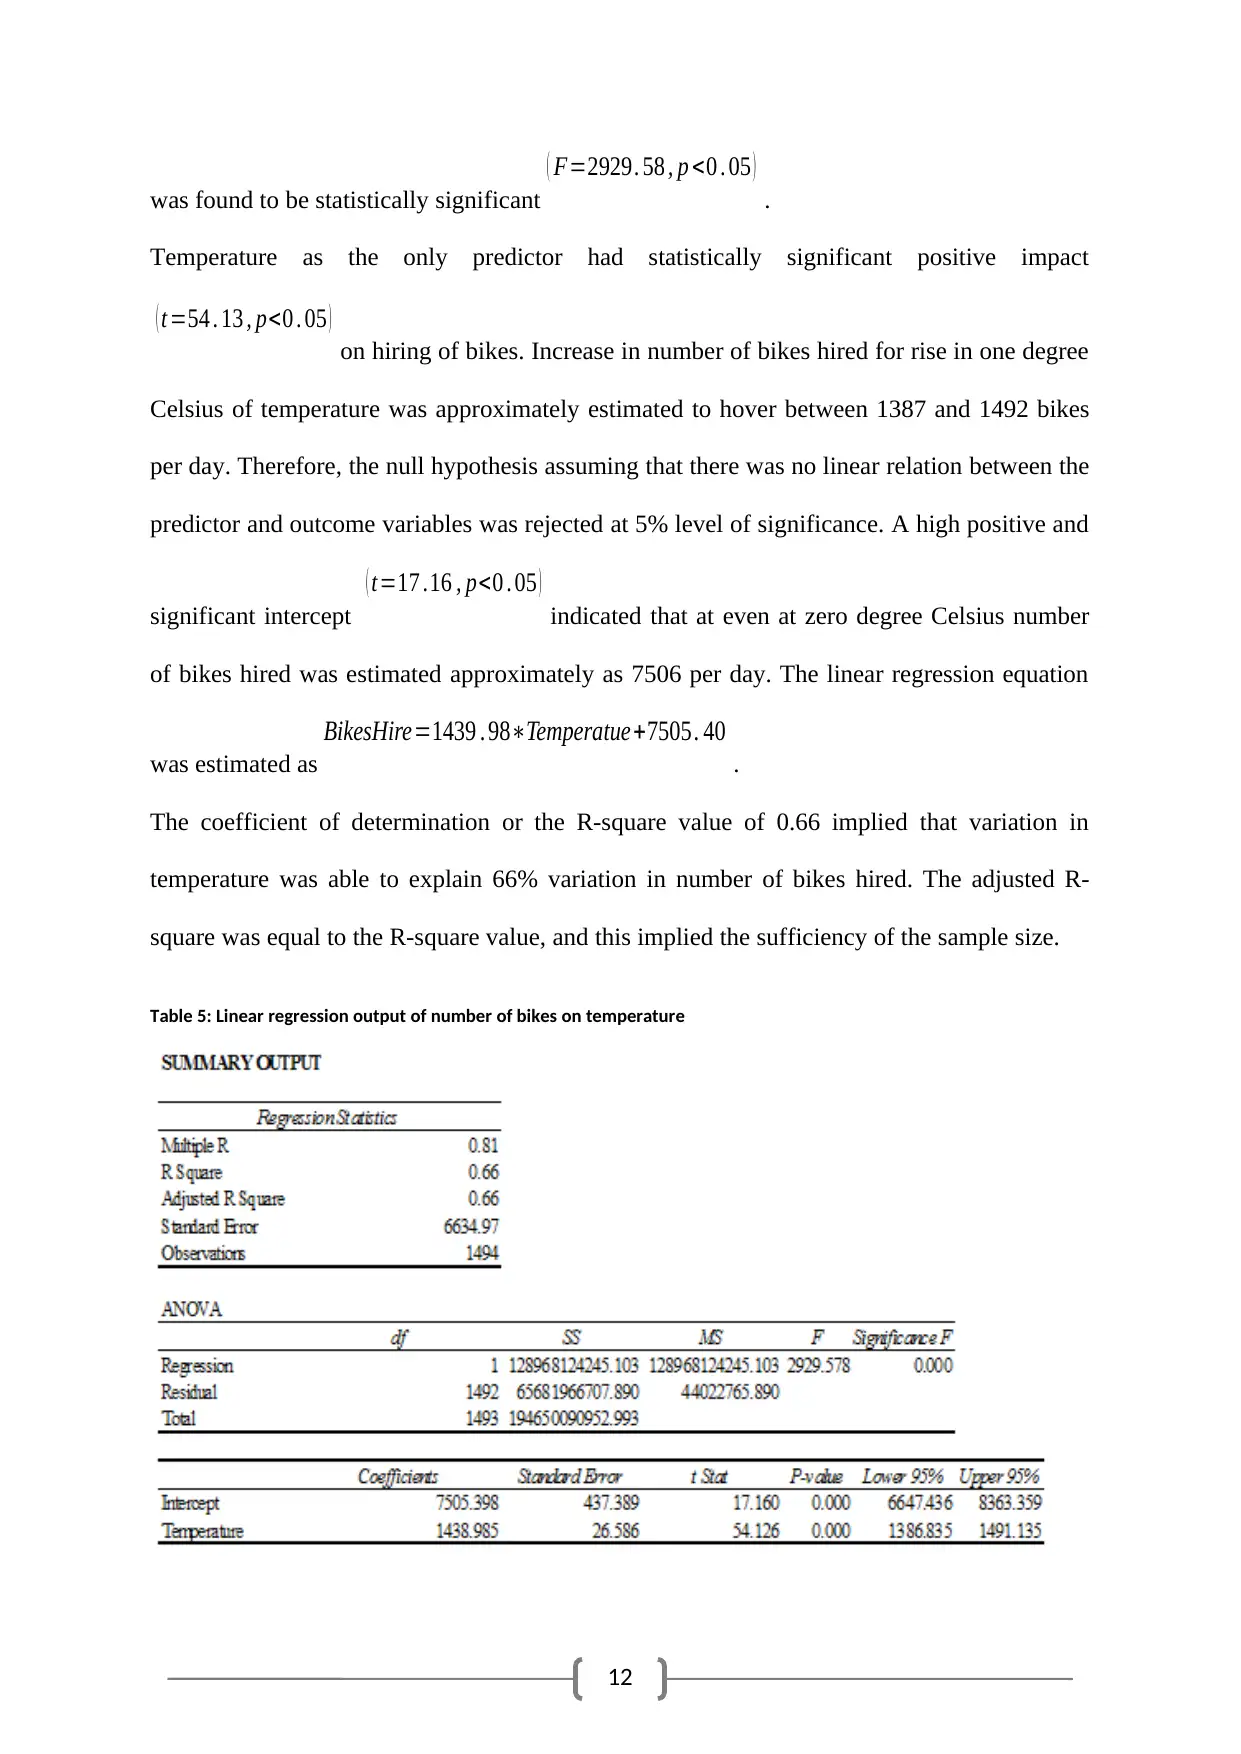
12
was found to be statistically significant
( F=2929. 58 , p <0 . 05 )
.
Temperature as the only predictor had statistically significant positive impact
( t=54 . 13 , p<0 . 05 )
on hiring of bikes. Increase in number of bikes hired for rise in one degree
Celsius of temperature was approximately estimated to hover between 1387 and 1492 bikes
per day. Therefore, the null hypothesis assuming that there was no linear relation between the
predictor and outcome variables was rejected at 5% level of significance. A high positive and
significant intercept
( t=17 .16 , p<0 . 05 )
indicated that at even at zero degree Celsius number
of bikes hired was estimated approximately as 7506 per day. The linear regression equation
was estimated as
BikesHire=1439 . 98∗Temperatue+7505. 40
.
The coefficient of determination or the R-square value of 0.66 implied that variation in
temperature was able to explain 66% variation in number of bikes hired. The adjusted R-
square was equal to the R-square value, and this implied the sufficiency of the sample size.
Table 5: Linear regression output of number of bikes on temperature
⊘ This is a preview!⊘
Do you want full access?
Subscribe today to unlock all pages.
Trusted by 1+ million students worldwide
1 out of 15


Your All-in-One AI-Powered Toolkit for Academic Success.
+13062052269
info@desklib.com
Available 24*7 on WhatsApp / Email
![[object Object]](/_next/static/media/star-bottom.7253800d.svg)
Unlock your academic potential
Copyright © 2020–2025 A2Z Services. All Rights Reserved. Developed and managed by ZUCOL.