Results and Analysis of Quality Management in Semiconductor Manufacturing Industry
Added on 2023-06-05
28 Pages8626 Words383 Views
Chapter 4: Results and analysis
4.1 Introduction
All results from the questionnaire that were carried out by respondents was presented in an excel file in form of a
table. In order to have sufficient evidence, the original copies were filled. This was done in case further research
was necessary. The Questionnaire was attached in the appendix for reference purposes.
4.2 Results Summary
Thirteen statements were prepared for the questionnaire (Appendix A). The statements are directly related to
process management as well as the contributing attributes that could have an impact on product quality. In
making the statements, critical consideration was made especially in accordance to conceptual framework (Figure
3.1) to prove that effective quality management is important in the Semiconductor Manufacturing Industry as well
as show that the factors could cause variations in the process. The Likert scale format was utilized to design each
statement while providing options that range from "strongly disagree" to "strongly agree" as well as from scale1 to
5. For the purposes of displaying statistical results as well as conducting the analysis, the response provided by
the respondents was tabulated and charts created. This was done to better comprehend and understand before
handling the discussion in chapter five.
4.2.1 Demographics information
The study was positively conducted and the participants gave their responses within 2 weeks. Questionnaires
were given out in forms of hard copies to 100 individuals from the bottom management up to the senior
management of the organization of interest. The ages of the employees lie between 20 and 59 years. Since 100
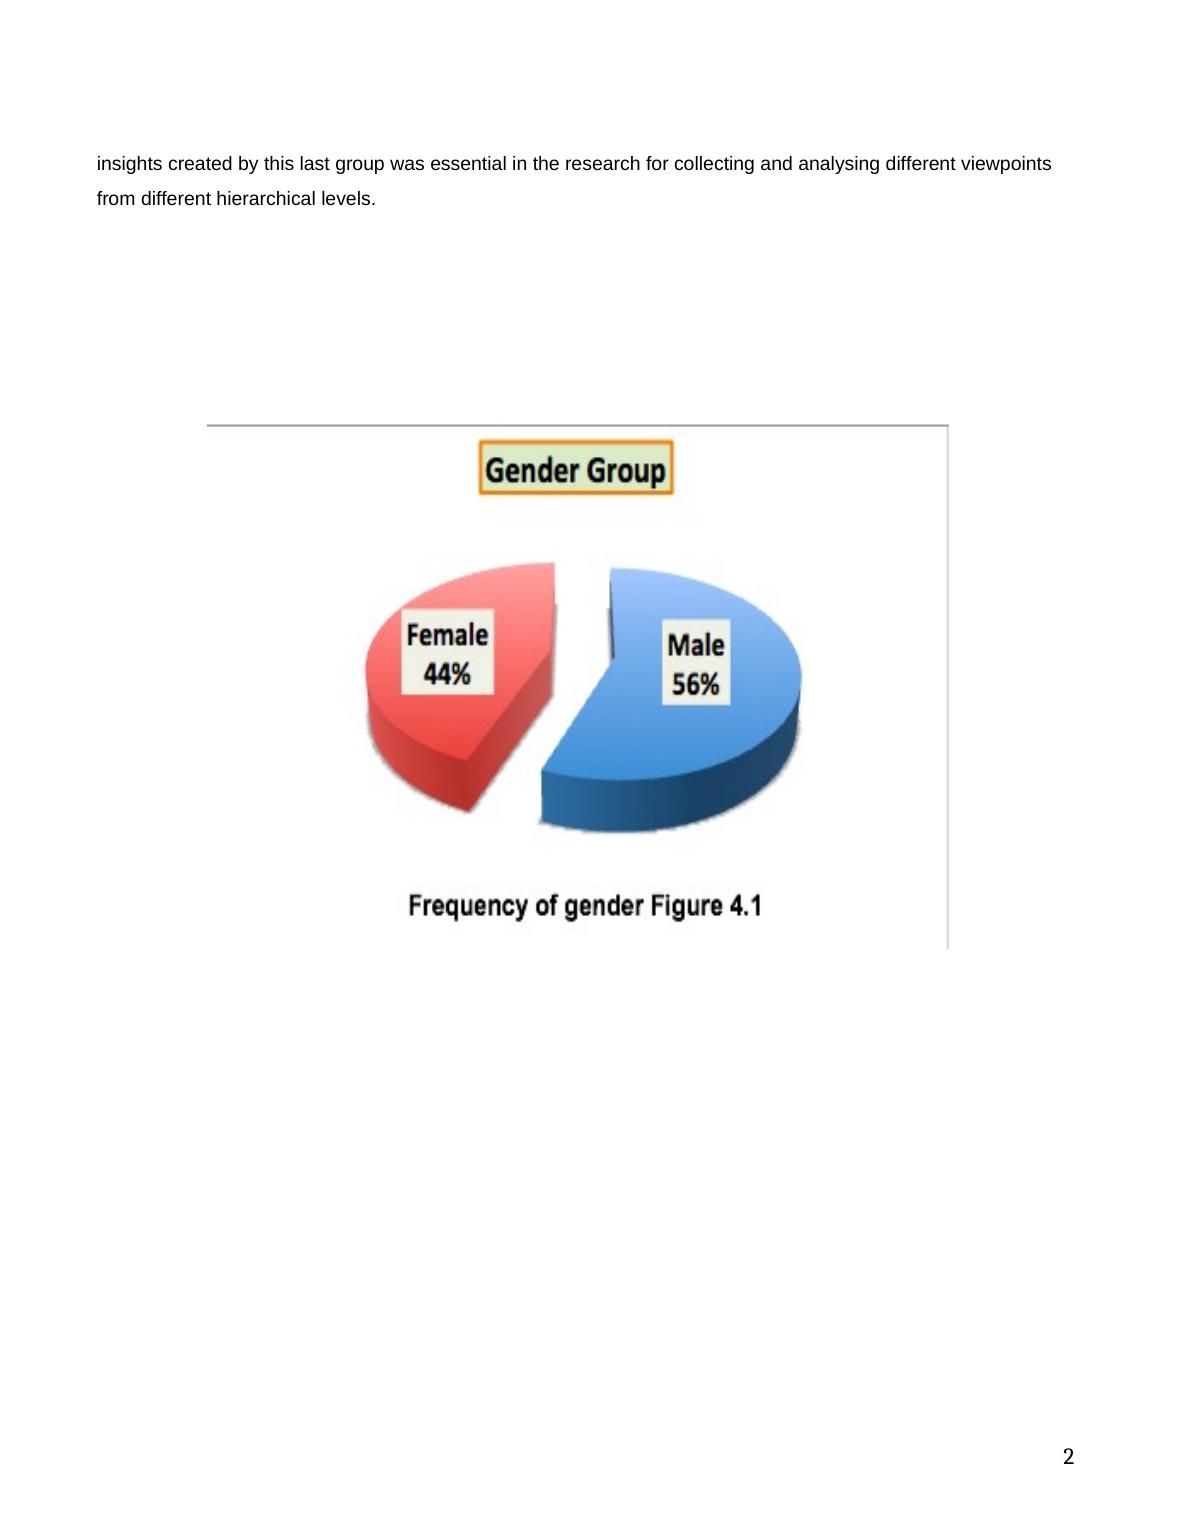
participants gave their responses, this translates to a responsive rate of 100%. As shown in the chart below
(Figure 4.1), males are the majority with 56% responsive rate compare to the females who had a responsive rate
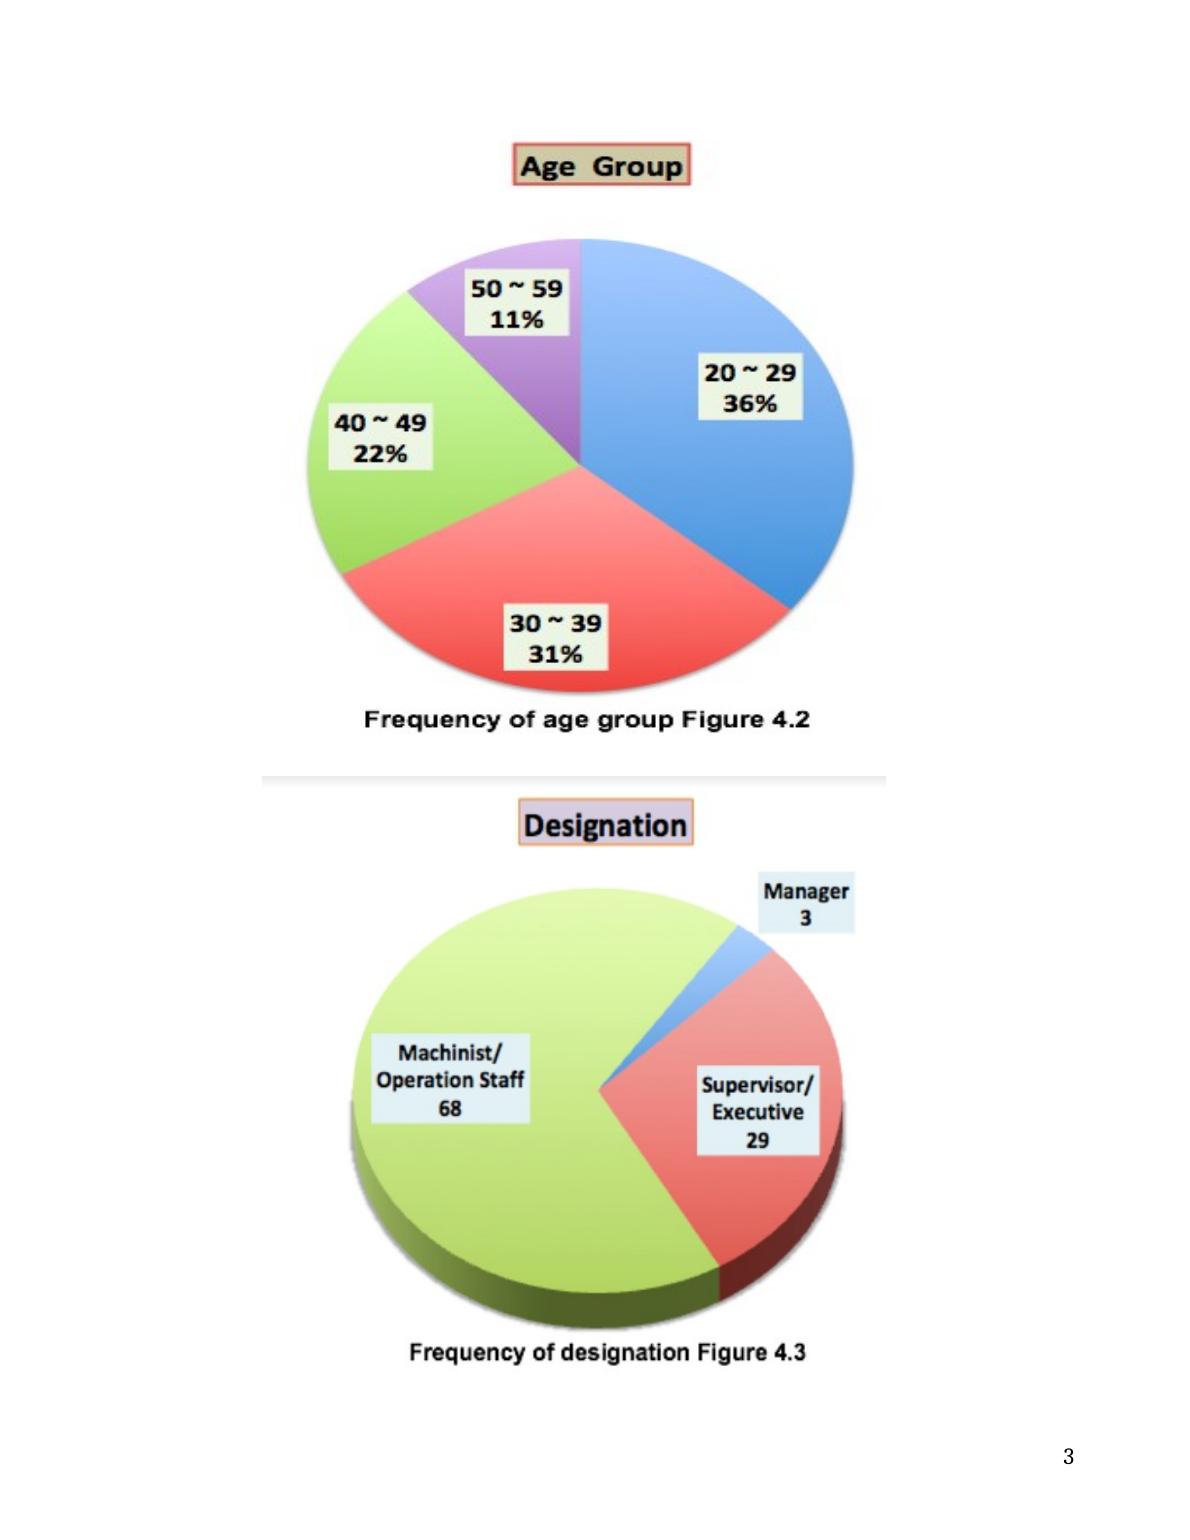
of 44%. This indicates that the company of interests is particular male dominated. As shown in figure 4.2 many of
the respondents are between the ages of 20 and 29 and followed by those of the ages of 30 to 39 which shows
the young workforce of the company has a higher percentage compared to the older work force. Many of these
young individuals are college graduates who do not have sufficient experience in matter to do with quality
management. Most of the respondents were obtained from the ground level workers like operators, machinist, as
well as technicians who are always working in the manufacturing line (Figure 4.3). The respondents in the middle
management like production supervisors, quality and manufacturing engineers, as well as office executives
comprise of approximately 29% of the participants. The other respondents came from the management. The
1
4.1 Introduction
All results from the questionnaire that were carried out by respondents was presented in an excel file in form of a
table. In order to have sufficient evidence, the original copies were filled. This was done in case further research
was necessary. The Questionnaire was attached in the appendix for reference purposes.
4.2 Results Summary
Thirteen statements were prepared for the questionnaire (Appendix A). The statements are directly related to
process management as well as the contributing attributes that could have an impact on product quality. In
making the statements, critical consideration was made especially in accordance to conceptual framework (Figure
3.1) to prove that effective quality management is important in the Semiconductor Manufacturing Industry as well
as show that the factors could cause variations in the process. The Likert scale format was utilized to design each
statement while providing options that range from "strongly disagree" to "strongly agree" as well as from scale1 to
5. For the purposes of displaying statistical results as well as conducting the analysis, the response provided by
the respondents was tabulated and charts created. This was done to better comprehend and understand before
handling the discussion in chapter five.
4.2.1 Demographics information
The study was positively conducted and the participants gave their responses within 2 weeks. Questionnaires
were given out in forms of hard copies to 100 individuals from the bottom management up to the senior
management of the organization of interest. The ages of the employees lie between 20 and 59 years. Since 100
participants gave their responses, this translates to a responsive rate of 100%. As shown in the chart below
(Figure 4.1), males are the majority with 56% responsive rate compare to the females who had a responsive rate
of 44%. This indicates that the company of interests is particular male dominated. As shown in figure 4.2 many of
the respondents are between the ages of 20 and 29 and followed by those of the ages of 30 to 39 which shows
the young workforce of the company has a higher percentage compared to the older work force. Many of these
young individuals are college graduates who do not have sufficient experience in matter to do with quality
management. Most of the respondents were obtained from the ground level workers like operators, machinist, as
well as technicians who are always working in the manufacturing line (Figure 4.3). The respondents in the middle
management like production supervisors, quality and manufacturing engineers, as well as office executives
comprise of approximately 29% of the participants. The other respondents came from the management. The
1
insights created by this last group was essential in the research for collecting and analysing different viewpoints
from different hierarchical levels.
2
from different hierarchical levels.
2
3
4.2.2 Cronbach’s Alpha reliability test
Establishing the performance of Cronbach's Alpha Reliability Test is essential in determining whether a number of
particular items in a questionnaire tend to measure up with similar features or rather, similar constructs. With this
information, an analysis can be conducted to establish whether a correlation is possible. Cronbach’s Alpha is
applied in the study for the purpose of analysing the results to make sure that they are reliable and consistent. It
can be noted that having a high rate of Cronbach’s Alpha means that there is a descent reliability in the variables
to be measured (Gliem & Gliem, 2003). For the purposes of this study, one hundred participants are used to
ensure that the reliability coefficient for the variable goes beyond the 0.700 mark.
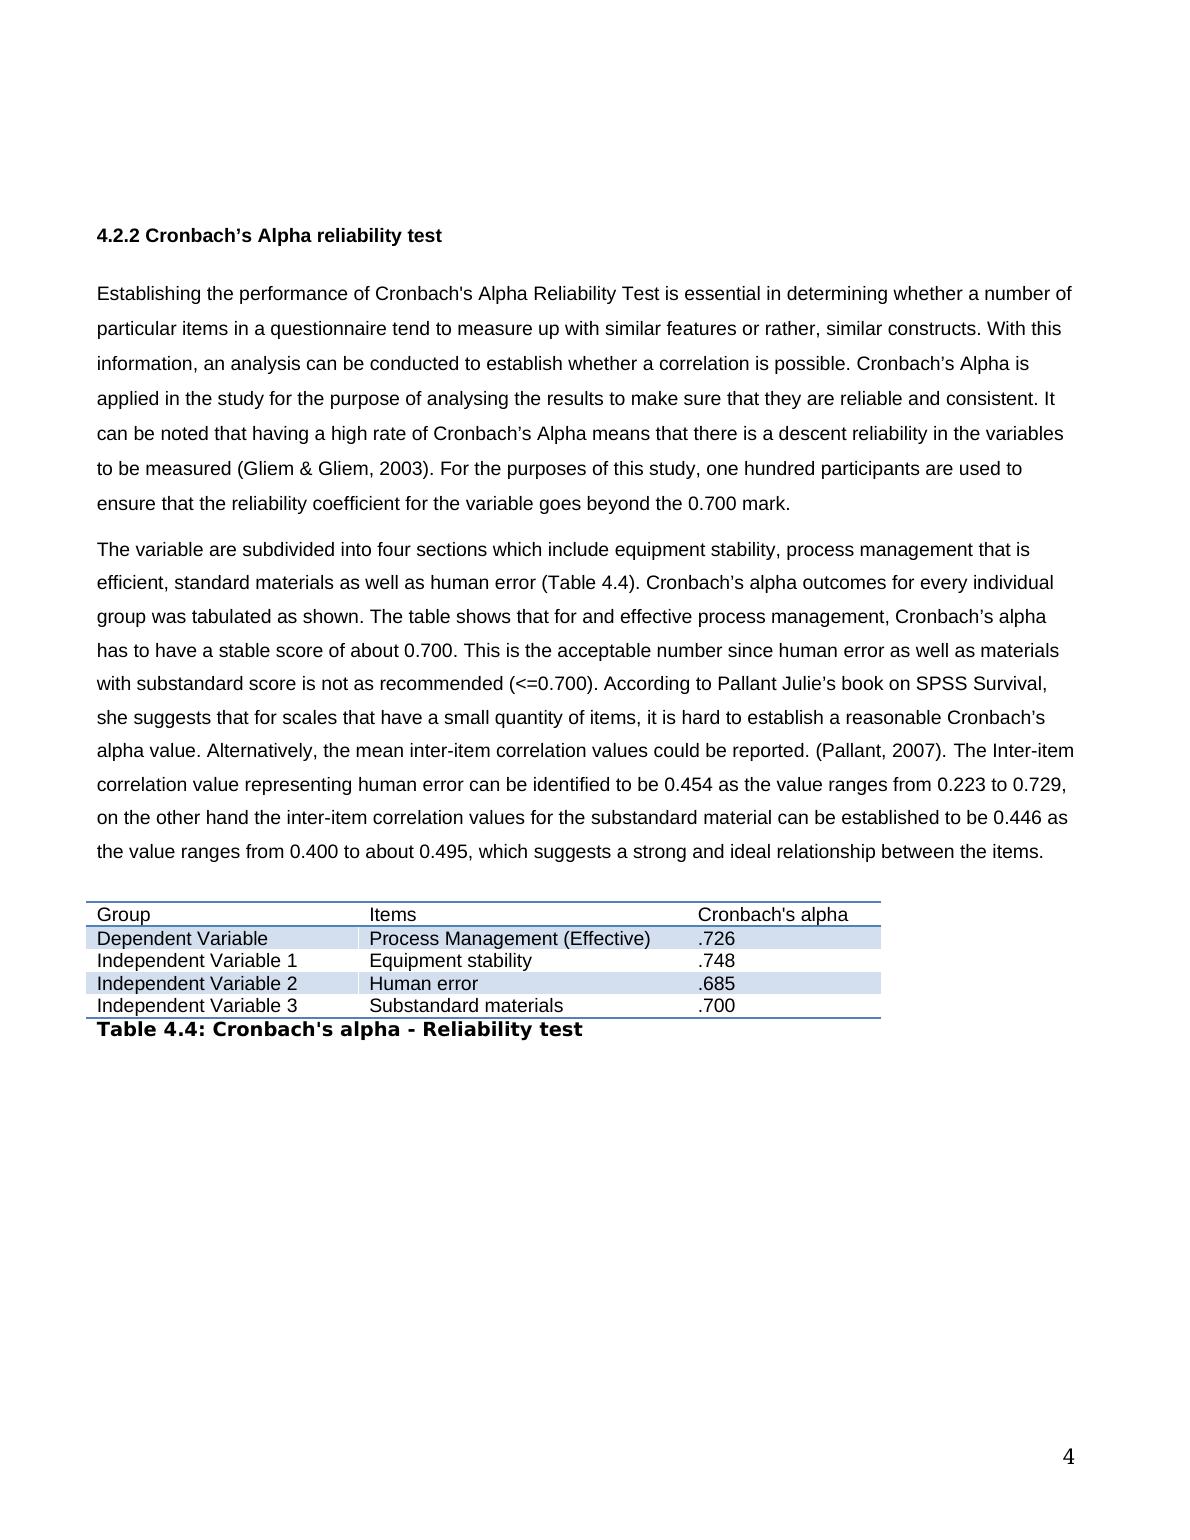
The variable are subdivided into four sections which include equipment stability, process management that is
efficient, standard materials as well as human error (Table 4.4). Cronbach’s alpha outcomes for every individual
group was tabulated as shown. The table shows that for and effective process management, Cronbach’s alpha
has to have a stable score of about 0.700. This is the acceptable number since human error as well as materials
with substandard score is not as recommended (<=0.700). According to Pallant Julie’s book on SPSS Survival,
she suggests that for scales that have a small quantity of items, it is hard to establish a reasonable Cronbach’s
alpha value. Alternatively, the mean inter-item correlation values could be reported. (Pallant, 2007). The Inter-item
correlation value representing human error can be identified to be 0.454 as the value ranges from 0.223 to 0.729,
on the other hand the inter-item correlation values for the substandard material can be established to be 0.446 as
the value ranges from 0.400 to about 0.495, which suggests a strong and ideal relationship between the items.
Group Items Cronbach's alpha
Dependent Variable Process Management (Effective) .726
Independent Variable 1 Equipment stability .748
Independent Variable 2 Human error .685
Independent Variable 3 Substandard materials .700
Table 4.4: Cronbach's alpha - Reliability test
4
Establishing the performance of Cronbach's Alpha Reliability Test is essential in determining whether a number of
particular items in a questionnaire tend to measure up with similar features or rather, similar constructs. With this
information, an analysis can be conducted to establish whether a correlation is possible. Cronbach’s Alpha is
applied in the study for the purpose of analysing the results to make sure that they are reliable and consistent. It
can be noted that having a high rate of Cronbach’s Alpha means that there is a descent reliability in the variables
to be measured (Gliem & Gliem, 2003). For the purposes of this study, one hundred participants are used to
ensure that the reliability coefficient for the variable goes beyond the 0.700 mark.
The variable are subdivided into four sections which include equipment stability, process management that is
efficient, standard materials as well as human error (Table 4.4). Cronbach’s alpha outcomes for every individual
group was tabulated as shown. The table shows that for and effective process management, Cronbach’s alpha
has to have a stable score of about 0.700. This is the acceptable number since human error as well as materials
with substandard score is not as recommended (<=0.700). According to Pallant Julie’s book on SPSS Survival,
she suggests that for scales that have a small quantity of items, it is hard to establish a reasonable Cronbach’s
alpha value. Alternatively, the mean inter-item correlation values could be reported. (Pallant, 2007). The Inter-item
correlation value representing human error can be identified to be 0.454 as the value ranges from 0.223 to 0.729,
on the other hand the inter-item correlation values for the substandard material can be established to be 0.446 as
the value ranges from 0.400 to about 0.495, which suggests a strong and ideal relationship between the items.
Group Items Cronbach's alpha
Dependent Variable Process Management (Effective) .726
Independent Variable 1 Equipment stability .748
Independent Variable 2 Human error .685
Independent Variable 3 Substandard materials .700
Table 4.4: Cronbach's alpha - Reliability test
4
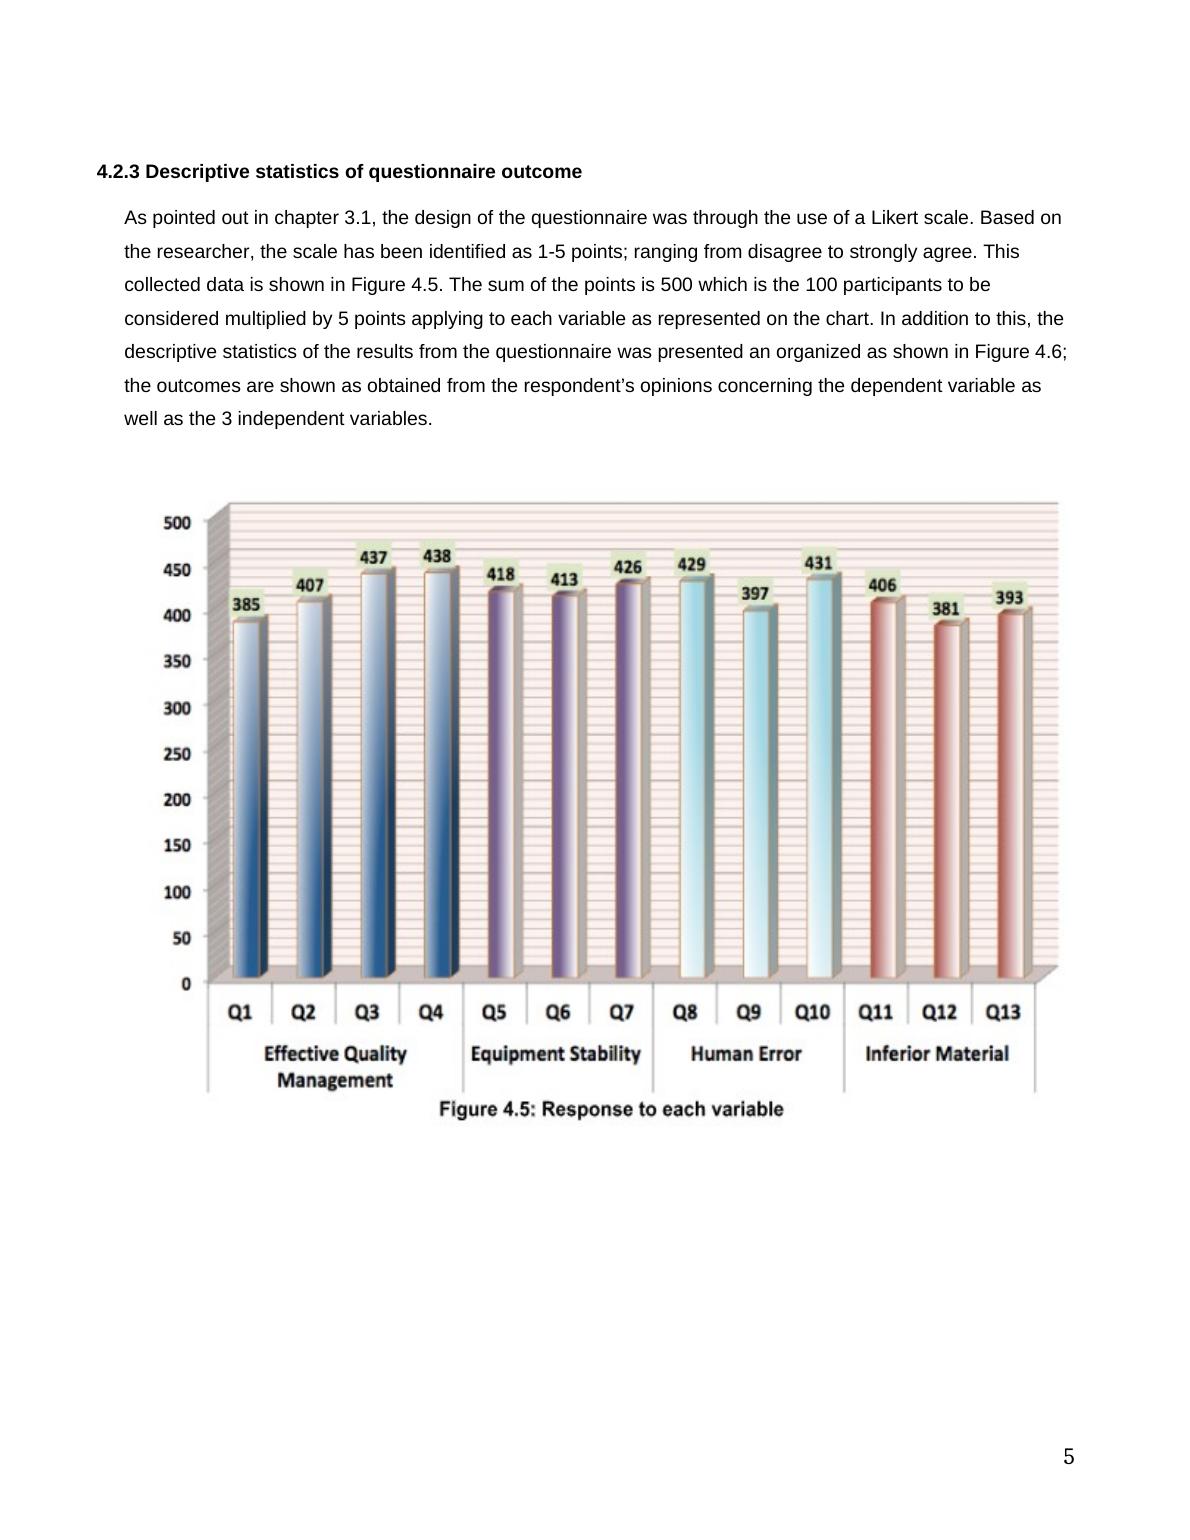
4.2.3 Descriptive statistics of questionnaire outcome
As pointed out in chapter 3.1, the design of the questionnaire was through the use of a Likert scale. Based on
the researcher, the scale has been identified as 1-5 points; ranging from disagree to strongly agree. This
collected data is shown in Figure 4.5. The sum of the points is 500 which is the 100 participants to be
considered multiplied by 5 points applying to each variable as represented on the chart. In addition to this, the
descriptive statistics of the results from the questionnaire was presented an organized as shown in Figure 4.6;
the outcomes are shown as obtained from the respondent’s opinions concerning the dependent variable as
well as the 3 independent variables.
5
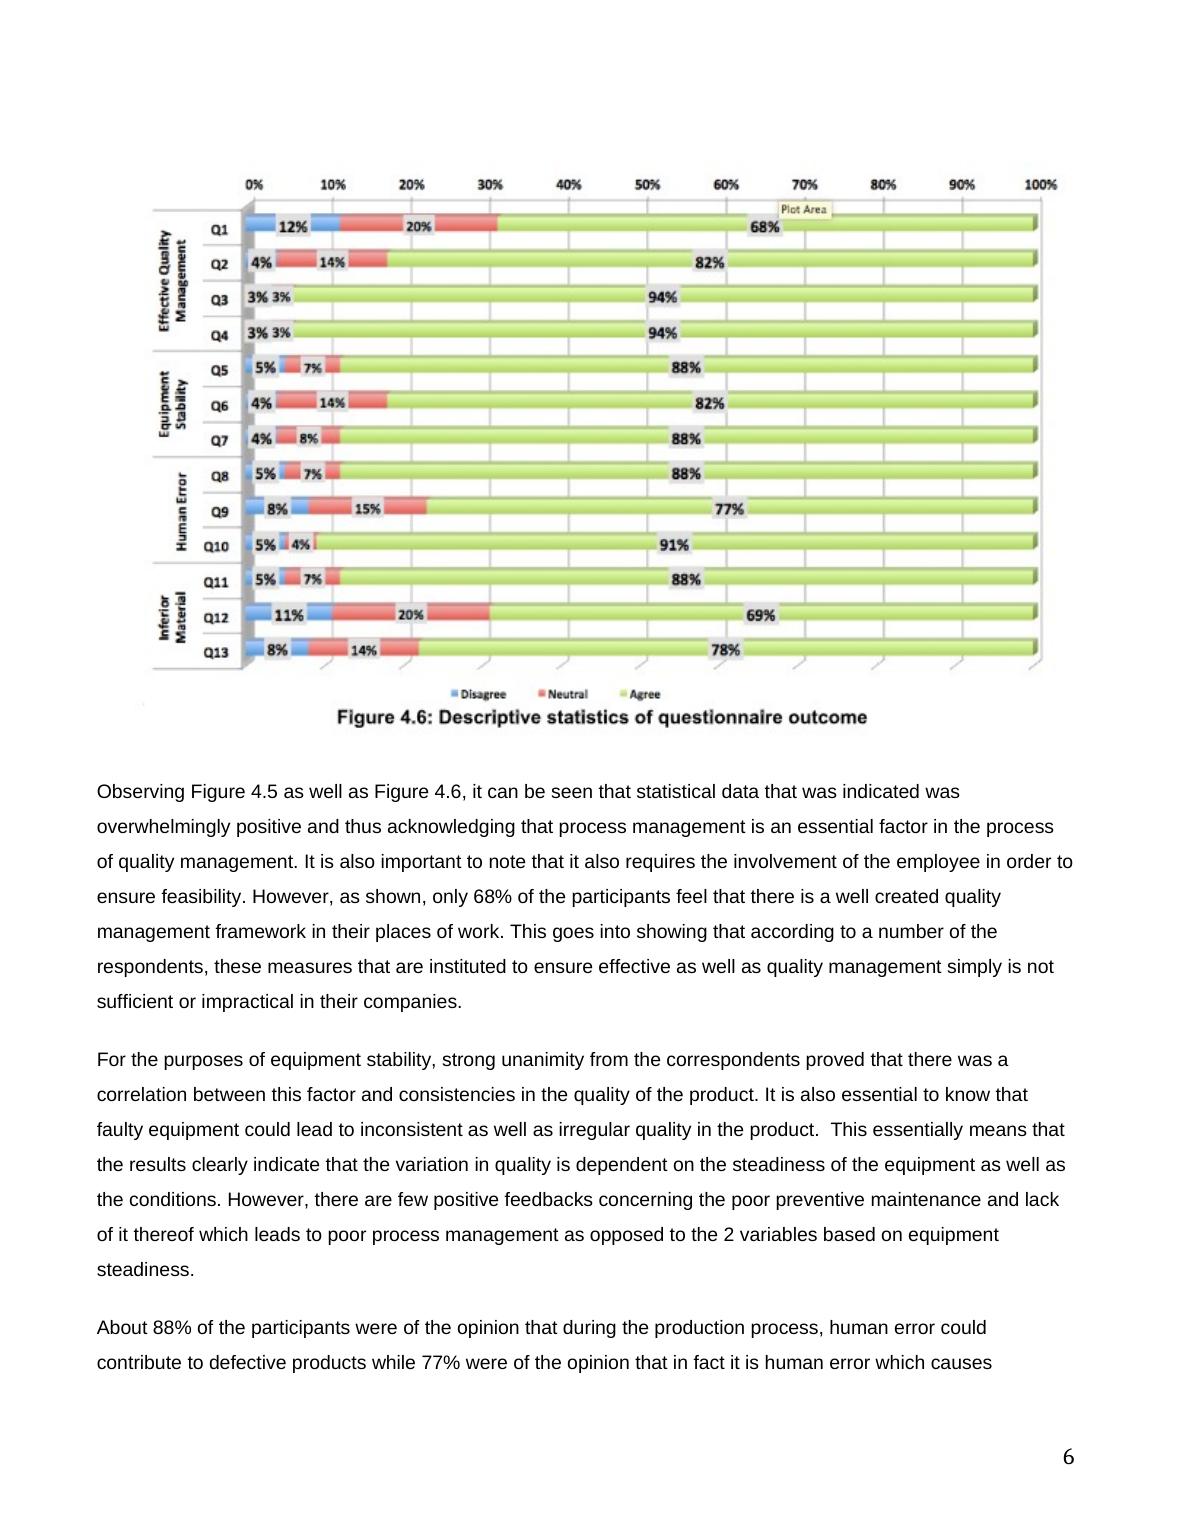
Observing Figure 4.5 as well as Figure 4.6, it can be seen that statistical data that was indicated was
overwhelmingly positive and thus acknowledging that process management is an essential factor in the process
of quality management. It is also important to note that it also requires the involvement of the employee in order to
ensure feasibility. However, as shown, only 68% of the participants feel that there is a well created quality
management framework in their places of work. This goes into showing that according to a number of the
respondents, these measures that are instituted to ensure effective as well as quality management simply is not
sufficient or impractical in their companies.
For the purposes of equipment stability, strong unanimity from the correspondents proved that there was a
correlation between this factor and consistencies in the quality of the product. It is also essential to know that
faulty equipment could lead to inconsistent as well as irregular quality in the product. This essentially means that
the results clearly indicate that the variation in quality is dependent on the steadiness of the equipment as well as
the conditions. However, there are few positive feedbacks concerning the poor preventive maintenance and lack
of it thereof which leads to poor process management as opposed to the 2 variables based on equipment
steadiness.
About 88% of the participants were of the opinion that during the production process, human error could
contribute to defective products while 77% were of the opinion that in fact it is human error which causes
6
End of preview
Want to access all the pages? Upload your documents or become a member.
Related Documents
Website Users and Internal Reliability of Responses (Doc)lg...
|20
|3690
|104
The Level of e-training readiness at Sultan Qaboos University: Basis for a proposed paradigm shiftlg...
|33
|5096
|275
Effect of Multicultural Workforce on Teamwork and Organisational Performance at Amazonlg...
|23
|5516
|58
Research on Knowledge Management at FlightCenter Travel Grouplg...
|19
|3270
|105
Data Handling & Using ICTlg...
|9
|2159
|25
SPSS Data Analysis - Assignmentlg...
|43
|10391
|381