Quantitative Methods Report: Melbourne Housing Market Analysis - 2020
VerifiedAdded on 2023/01/11
|9
|1181
|30
Report
AI Summary
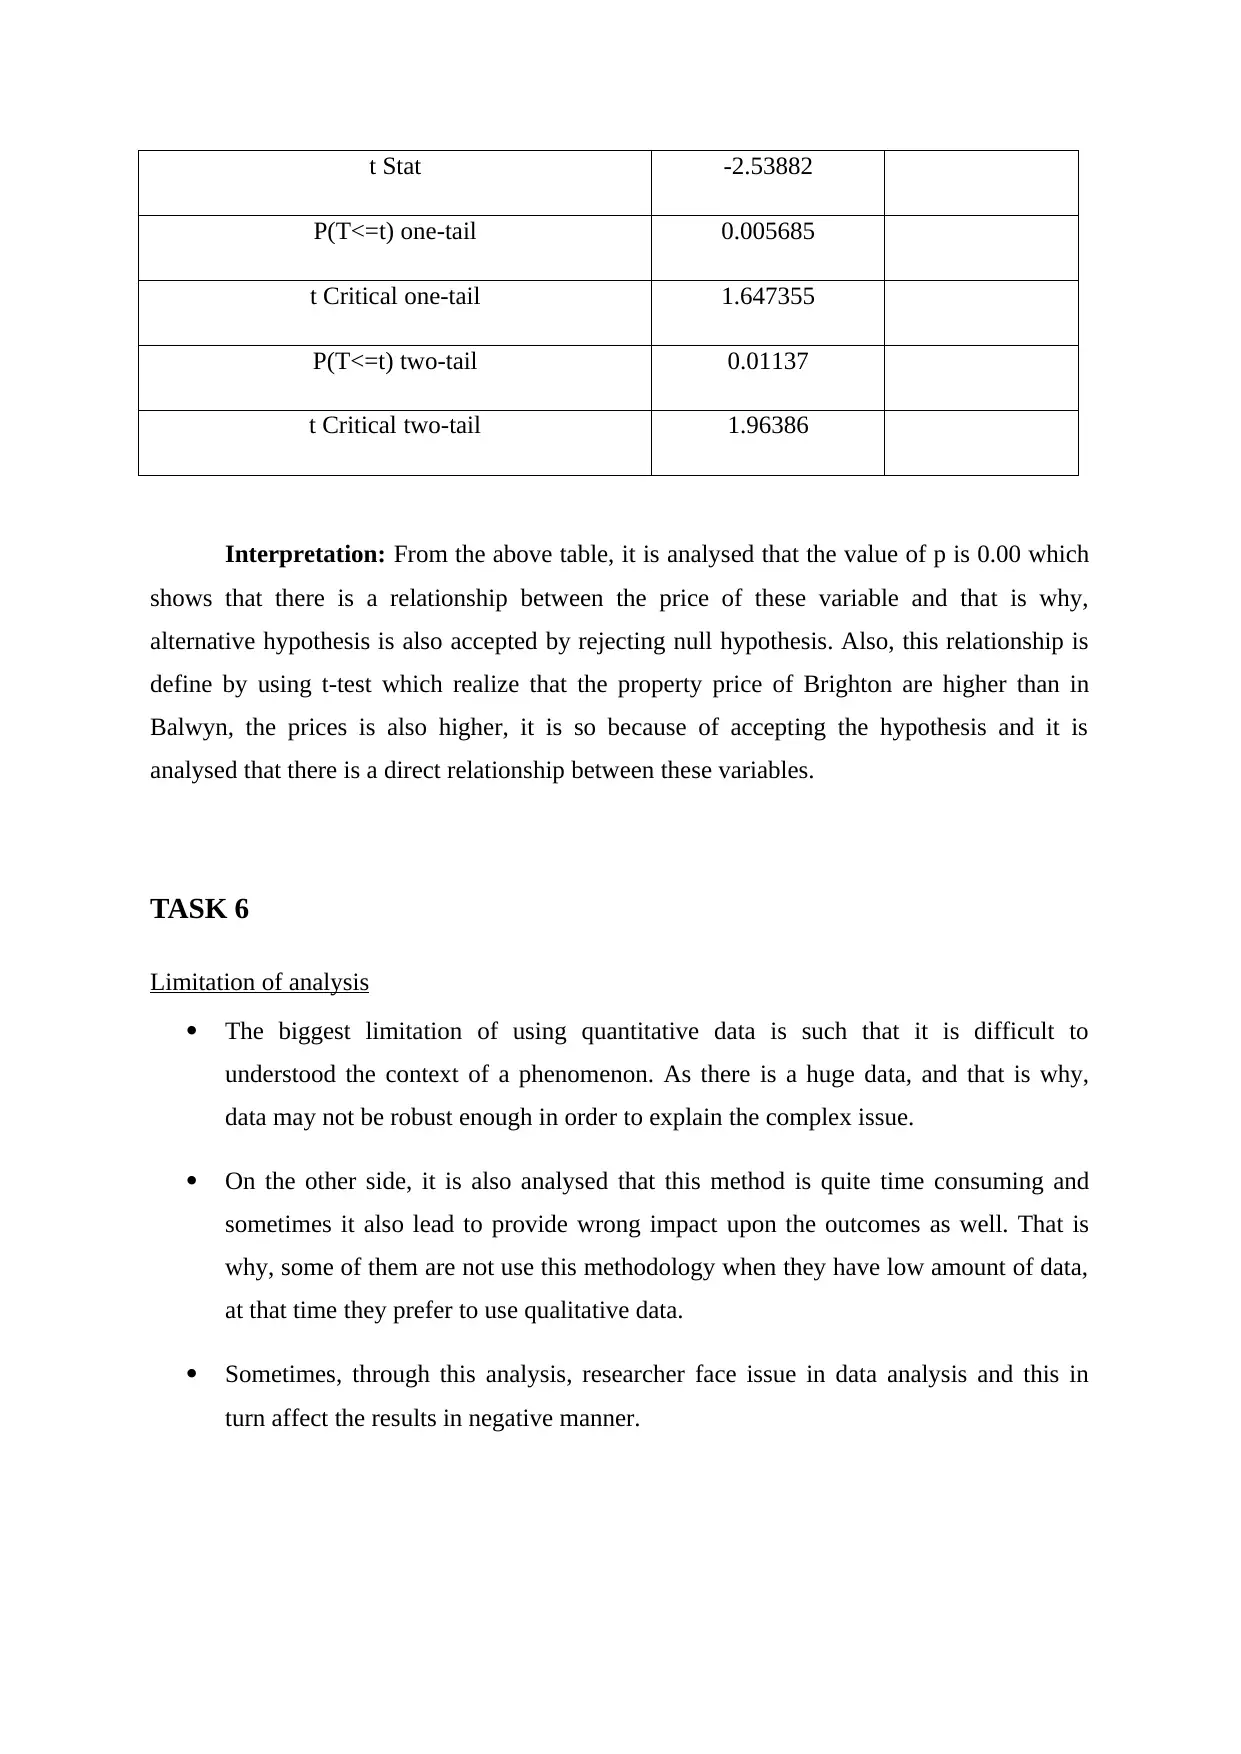
This report presents a quantitative analysis of the Melbourne housing market, examining price trends and market conditions from 2016 to 2018. The analysis utilizes descriptive statistics to evaluate sold prices and identify trends, including mean, median, standard deviation, and skewness. The report also includes hypothesis testing to determine relationships between property prices in different suburbs, specifically Balwyn North and Brighton. Limitations of the analysis are discussed, and recommendations are provided for improving future data collection and analysis, such as considering external factors like interest rates and demographics. The report aims to quantify the problem, generate numeric data, and transfer it into usable statistics to determine the sold price and market trend of Melbourne housing.

Quantitative method
Paraphrase This Document
Need a fresh take? Get an instant paraphrase of this document with our AI Paraphraser

Table of Contents
INTRODUCTION......................................................................................................................2
TASK 1......................................................................................................................................2
Market condition....................................................................................................................2
TASK 2......................................................................................................................................3
Descriptive statistics of sold price for the entire sample........................................................3
Descriptive statistic of sold price for the year of 2016 and 2017...........................................5
TASK 4......................................................................................................................................6
Hypothesis testing..................................................................................................................6
TASK 6......................................................................................................................................7
Limitation of analysis.............................................................................................................7
Recommendations..................................................................................................................8

INTRODUCTION
Quantitative method help to quantify the problem by a way of generating numeric
data so that it can be transferred into the usable statistic as well. In the same way, current data
is based upon the Melbourne housing price through which it is easy to determine the sold
price and market trend. Further study will uses descriptive statistics in order to analyse the
sold price for the year of 2019 & 2017. Lastly, it will help to determine the limitation of
analysis and suggest the ways through which data can be collect in effective manner.
TASK 1
Market condition
Year Quarter Sales
Volume
Average sold
price
Median sold
price
2016 Qtr 1 34 983,583.33 911,000
Qtr 2 2437 1,016,754.17 850,000
Qtr 3 2652 1,049,946.77 892,000
Qtr 4 2898 1,100,147.02 915,000
2017 Qtr 1 1448 1,131,770.61 931,000
Qtr 2 3825 1,056,744.05 900,500
Qtr 3 5176 970,113.09 818,000
Qtr 4 4873 1,003,232.87 830,000
2018 Qtr 1 3383 963,900.26 805,000
Interpretation: As per the above, it is analysed that the market condition of the real
estate market in Melbourne is increase because the sales volume in the first quarter is only 34
but it is increases in the 1st quarter of 2018 up to 3383.
⊘ This is a preview!⊘
Do you want full access?
Subscribe today to unlock all pages.

Trusted by 1+ million students worldwide

From the above it is analysed that the mean and median value of property is not
increase from 2018 to 2017 first quarter and thus, it is stated that the average value is higher
in 2017 i.e. 1,131,770.61, but on 2018 the value is 963,9009.26.
So it is identified from the table that sale of the real estate market in Melbourne is
increases because in 2016 the sales is limited but at the starting quarter of 2018, the sales is
increases by 3383.
Limitation:
This is not applied to the heterogeneous data and as a result, it may somehow mislead
the data as well.
It is handle by the experts who have a knowledge and have an ability to handle the
statistically data in efficient manner.
This method is not beneficial to understand the issue in great depth and also determine
the ways to solve problem which are highlighted.
TASK 2
Descriptive statistics of sold price for the entire sample
Descriptive statistics
Paraphrase This Document
Need a fresh take? Get an instant paraphrase of this document with our AI Paraphraser

Particulars Price
Mean 1050173
Standard Error 3886.11
Median 870000
Mode 1100000
Standard Deviation 641467.1
Sample Variance 4.11E+11
Kurtosis 13.0972
Skewness 2.588969
Range 11115000
Minimum 85000
Maximum 11200000
Sum 2.86E+10
Count 27247
Confidence Level (95.0%) 7616.973
From the above, it is analysed from the table that there are around 27247 sample
which are selected randomly in order to determine the overall price of the house. Such that
from the observation, it is analysed that the mean is 1050173 and the standard deviation
shows that the value of fluctuate from the 64 thousand. Also the skewness value also shows a
positive sign which means that the tail is extending towards more positive value (price).

Descriptive statistic of sold price for the year of 2016 and 2017.
Descriptive statistics
Particulars Price
Mean 1055272.172
Standard Error 4210.435039
Median 880000
Mode 1100000
Standard Deviation 646449.1955
Sample Variance 4.17897E+11
Kurtosis 13.28896816
Skewness 2.584521271
Range 11115000
Minimum 85000
Maximum 11200000
Descriptive statistics
Particulars Price
Mean 1055272.172
Standard Error 4210.435039
Median 880000
Mode 1100000
Standard Deviation 646449.1955
Sample Variance 4.17897E+11
Kurtosis 13.28896816
Skewness 2.584521271
Range 11115000
Minimum 85000
Maximum 11200000
⊘ This is a preview!⊘
Do you want full access?
Subscribe today to unlock all pages.

Trusted by 1+ million students worldwide

Sum 24875930921
Count 23573
Confidence Level (95.0%) 8252.724558
Under this, there are around 23573 sample size are used in order to determine the sold
price. Such that through the above table, it is analysed that the average sold price for the year
2016 and 2017 is 1055272.172, also the median in same year is 880000 which shows that at
the end of 2017, the price are suddenly increases. Also, the standard deviation shows that the
price is varied from 646449 with the average price of houses.
TASK 4
Hypothesis testing
For this, it is suggested to use t-Test: Two-Sample Assuming Equal Variances which in
turn determine the relationship between two variable. Such that:
Null Hypothesis: There is no relationship between Balwyn North and Brighton
Alternative Hypothesis: There is a relationship between Balwyn North and Brighton
Balwyn North Brighton
Mean 1787316 1984227
Variance 3.73E+11 1.43E+12
Observations 295 317
Pooled Variance 9.19E+11
Hypothesized Mean Difference 0
df 610
Paraphrase This Document
Need a fresh take? Get an instant paraphrase of this document with our AI Paraphraser

t Stat -2.53882
P(T<=t) one-tail 0.005685
t Critical one-tail 1.647355
P(T<=t) two-tail 0.01137
t Critical two-tail 1.96386
Interpretation: From the above table, it is analysed that the value of p is 0.00 which
shows that there is a relationship between the price of these variable and that is why,
alternative hypothesis is also accepted by rejecting null hypothesis. Also, this relationship is
define by using t-test which realize that the property price of Brighton are higher than in
Balwyn, the prices is also higher, it is so because of accepting the hypothesis and it is
analysed that there is a direct relationship between these variables.
TASK 6
Limitation of analysis
The biggest limitation of using quantitative data is such that it is difficult to
understood the context of a phenomenon. As there is a huge data, and that is why,
data may not be robust enough in order to explain the complex issue.
On the other side, it is also analysed that this method is quite time consuming and
sometimes it also lead to provide wrong impact upon the outcomes as well. That is
why, some of them are not use this methodology when they have low amount of data,
at that time they prefer to use qualitative data.
Sometimes, through this analysis, researcher face issue in data analysis and this in
turn affect the results in negative manner.

Recommendations
In order to improve the results, it is recommended that there is a need to evaluate the
results in better manner by consider some factor like, demographics, Interest rate
which help to analyse the external environment.
Also, it is recommended to the client to use the quantitative tool and technique which
in turn assist to analyse the answer in better manner. Such that it will help to generate
quick results.
Moreover, it is also suggested to include more key element in the research which
assist to analyse the results in better way. So, with the help of these, company is able
to meet the define aim and analyse the current trend as well.
⊘ This is a preview!⊘
Do you want full access?
Subscribe today to unlock all pages.

Trusted by 1+ million students worldwide
1 out of 9
Related Documents
Your All-in-One AI-Powered Toolkit for Academic Success.
+13062052269
info@desklib.com
Available 24*7 on WhatsApp / Email
Unlock your academic potential
Copyright © 2020–2026 A2Z Services. All Rights Reserved. Developed and managed by ZUCOL.


