Quantitative Analysis
VerifiedAdded on 2023/01/17
|12
|1176
|100
AI Summary
This document discusses quantitative analysis and provides graphical representations and comparisons of tourist arrivals in Australia from the top 10 markets in 2012, 2015, and 2018. It also includes histograms for two variables, a numerical summary report, and correlation analysis. Additionally, it covers deaths in custody over 2001-2013 and probability calculations for acceptance and assignment marking time.
Contribute Materials
Your contribution can guide someone’s learning journey. Share your
documents today.
Quantitative Analysis
Student’s Name:
University Affiliation:
1
Student’s Name:
University Affiliation:
1
Secure Best Marks with AI Grader
Need help grading? Try our AI Grader for instant feedback on your assignments.
Problem 1
Part a
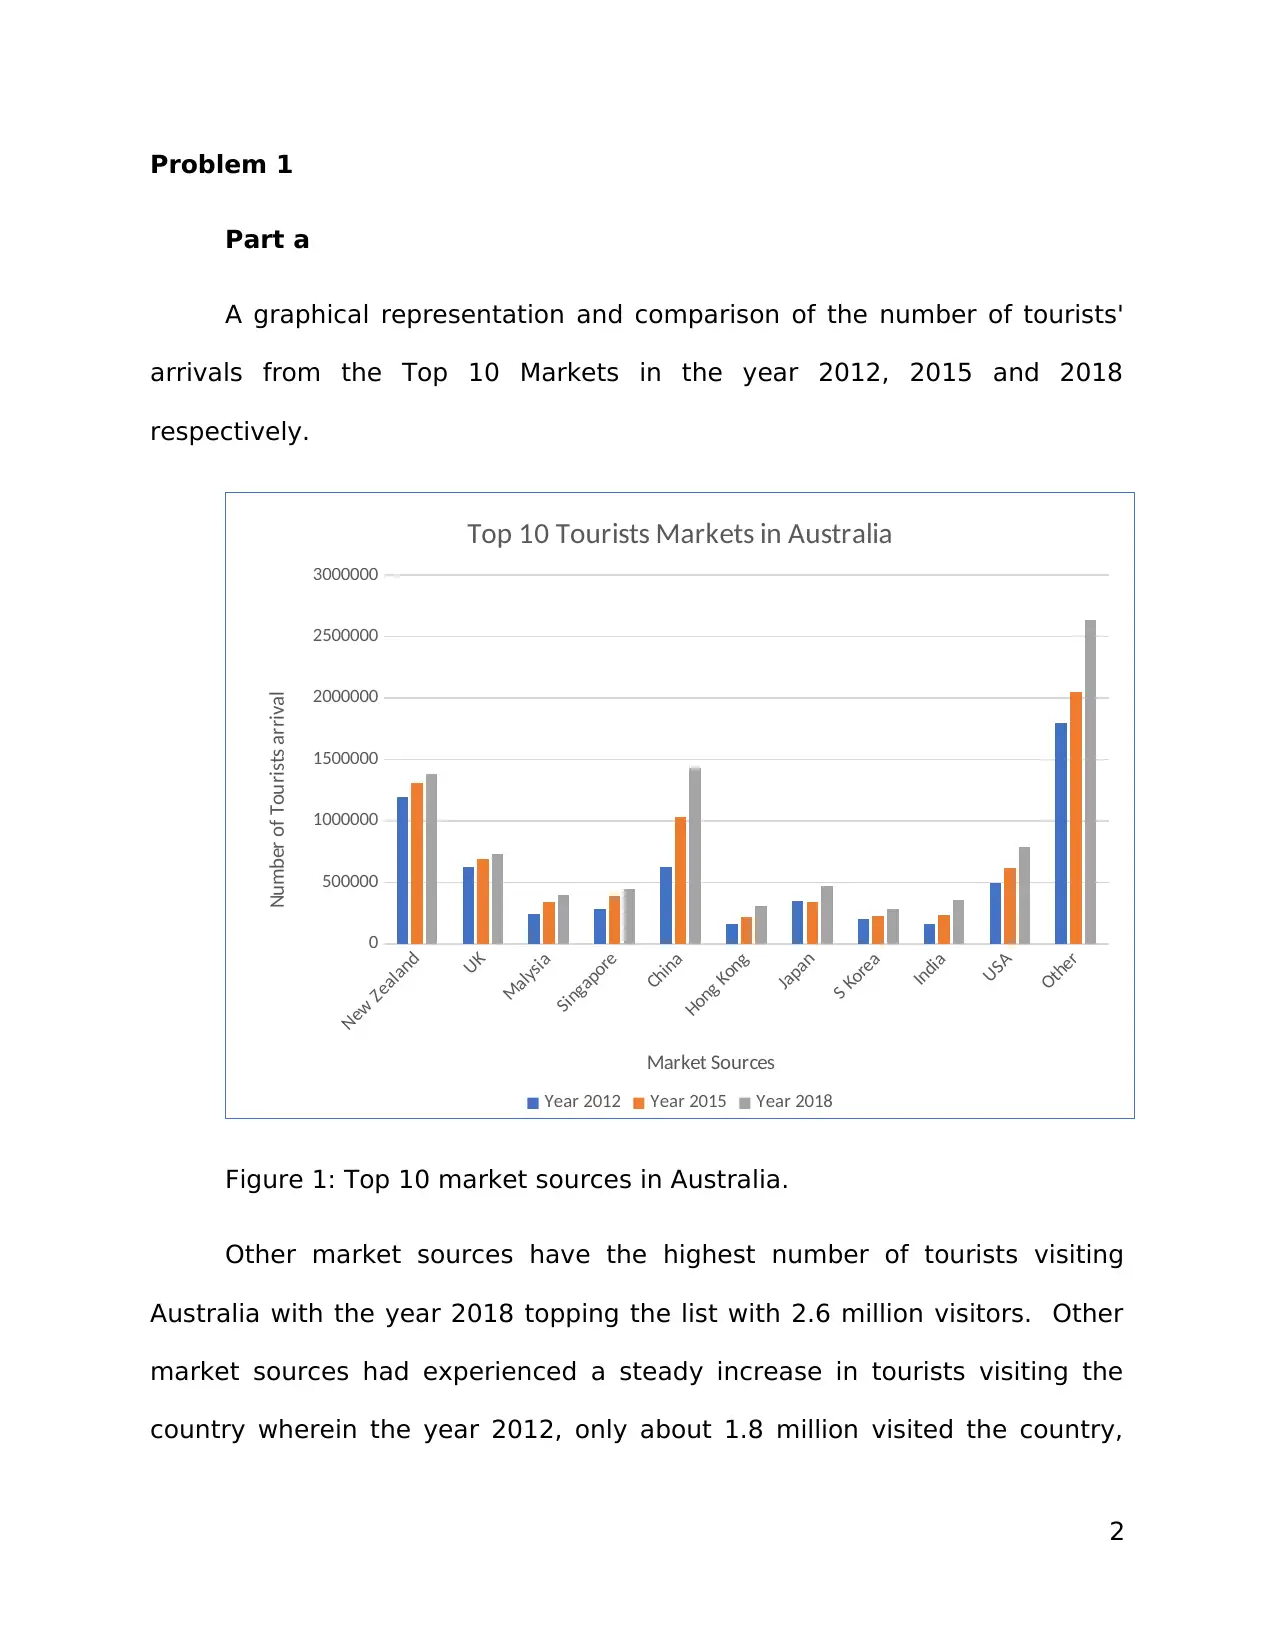
A graphical representation and comparison of the number of tourists'
arrivals from the Top 10 Markets in the year 2012, 2015 and 2018
respectively.
New Zealand
UK
Malysia
Singapore
China
Hong Kong
Japan
S Korea
India
USA
Other
0
500000
1000000
1500000
2000000
2500000
3000000
Top 10 Tourists Markets in Australia
Year 2012 Year 2015 Year 2018
Market Sources
Number of Tourists arrival
Figure 1: Top 10 market sources in Australia.
Other market sources have the highest number of tourists visiting
Australia with the year 2018 topping the list with 2.6 million visitors. Other
market sources had experienced a steady increase in tourists visiting the
country wherein the year 2012, only about 1.8 million visited the country,
2
Part a
A graphical representation and comparison of the number of tourists'
arrivals from the Top 10 Markets in the year 2012, 2015 and 2018
respectively.
New Zealand
UK
Malysia
Singapore
China
Hong Kong
Japan
S Korea
India
USA
Other
0
500000
1000000
1500000
2000000
2500000
3000000
Top 10 Tourists Markets in Australia
Year 2012 Year 2015 Year 2018
Market Sources
Number of Tourists arrival
Figure 1: Top 10 market sources in Australia.
Other market sources have the highest number of tourists visiting
Australia with the year 2018 topping the list with 2.6 million visitors. Other
market sources had experienced a steady increase in tourists visiting the
country wherein the year 2012, only about 1.8 million visited the country,
2
and in 2015 the number increased to 2.05 million tourists respectively. Hong
Kong recorded a total of 689,400 tourists which was the least followed by
South Korea with a total of 720,200 tourists. Other markets top the markets
within the periods with a total of 6,480,700 tourists followed by the New
Zealand market with 3,889,900 visitors and the third is Chia with a total of
3,092,200 visitors.
Part b
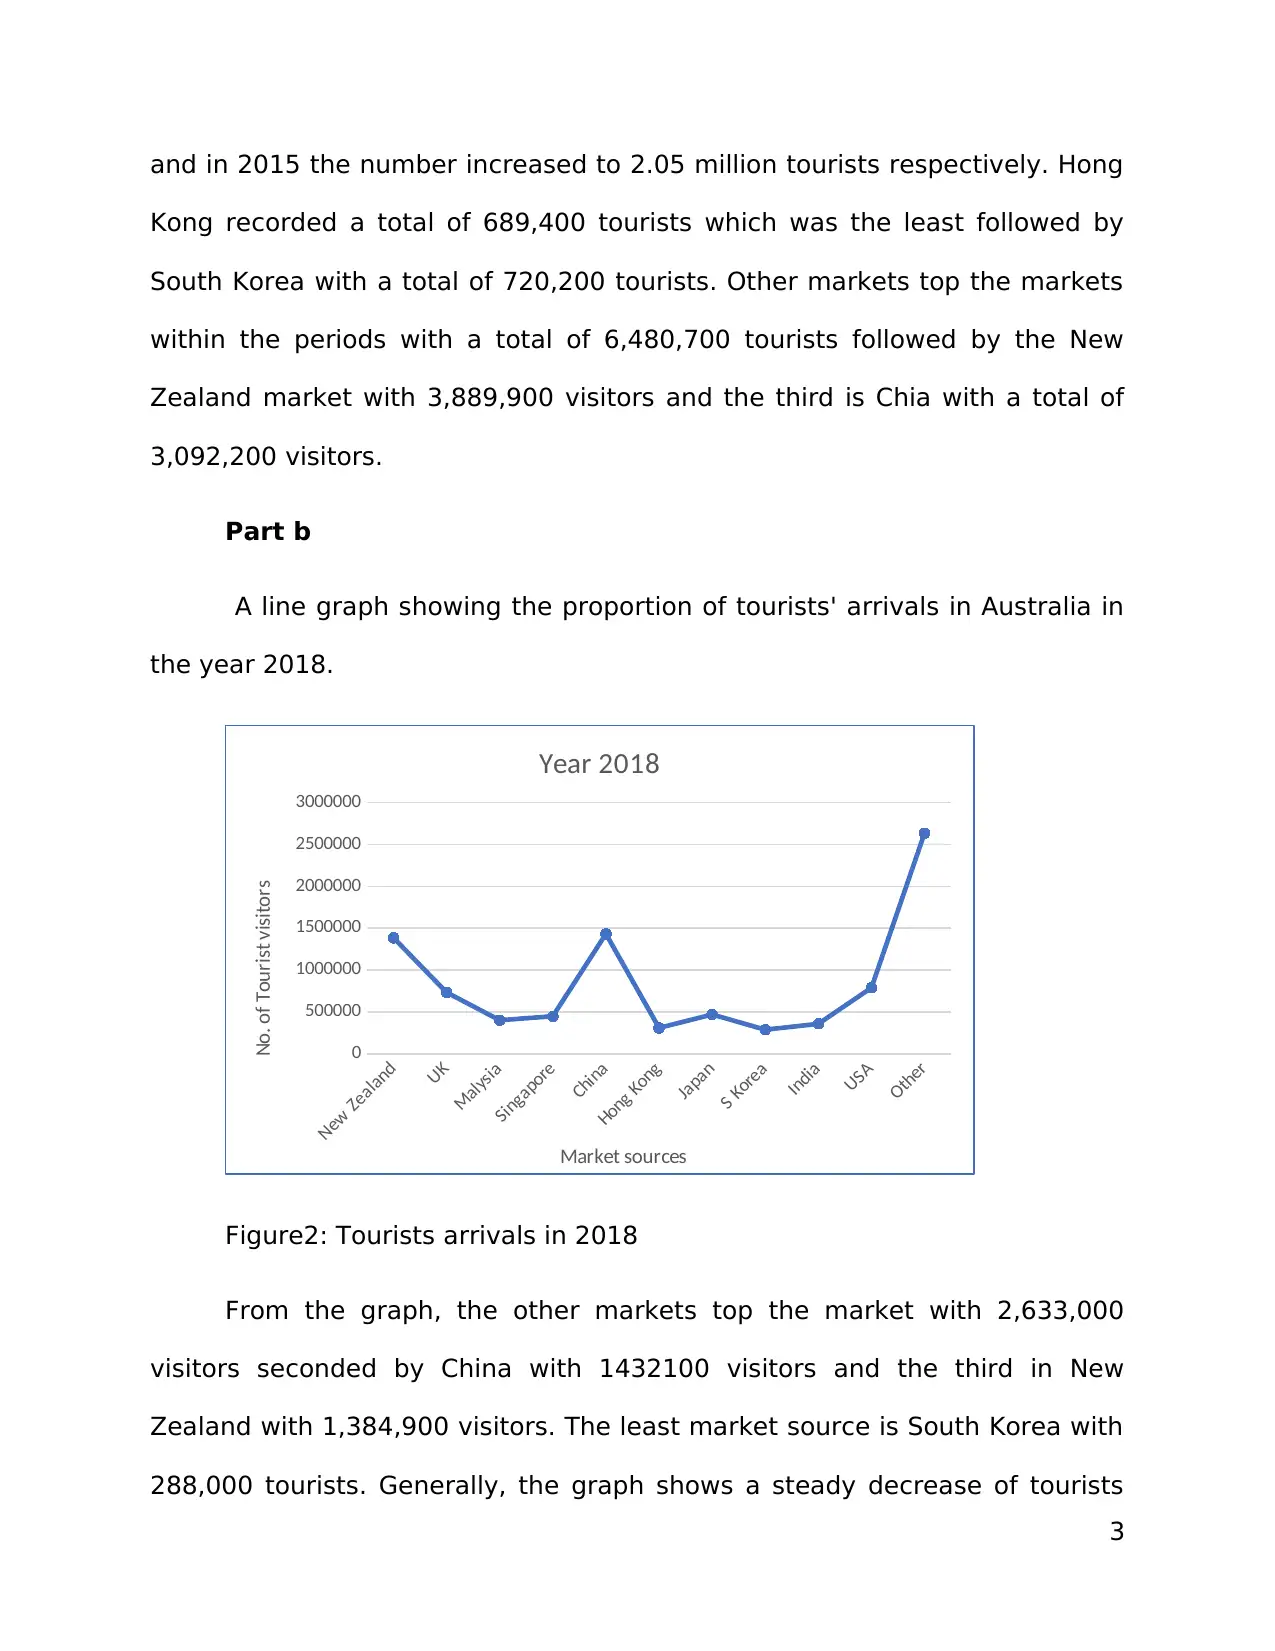
A line graph showing the proportion of tourists' arrivals in Australia in
the year 2018.
New Zealand
UK
Malysia
Singapore
China
Hong Kong
Japan
S Korea
India
USA
Other
0
500000
1000000
1500000
2000000
2500000
3000000
Year 2018
Market sources
No. of Tourist visitors
Figure2: Tourists arrivals in 2018
From the graph, the other markets top the market with 2,633,000
visitors seconded by China with 1432100 visitors and the third in New
Zealand with 1,384,900 visitors. The least market source is South Korea with
288,000 tourists. Generally, the graph shows a steady decrease of tourists
3
Kong recorded a total of 689,400 tourists which was the least followed by
South Korea with a total of 720,200 tourists. Other markets top the markets
within the periods with a total of 6,480,700 tourists followed by the New
Zealand market with 3,889,900 visitors and the third is Chia with a total of
3,092,200 visitors.
Part b
A line graph showing the proportion of tourists' arrivals in Australia in
the year 2018.
New Zealand
UK
Malysia
Singapore
China
Hong Kong
Japan
S Korea
India
USA
Other
0
500000
1000000
1500000
2000000
2500000
3000000
Year 2018
Market sources
No. of Tourist visitors
Figure2: Tourists arrivals in 2018
From the graph, the other markets top the market with 2,633,000
visitors seconded by China with 1432100 visitors and the third in New
Zealand with 1,384,900 visitors. The least market source is South Korea with
288,000 tourists. Generally, the graph shows a steady decrease of tourists
3
visiting Australia from 1.4 million in New Zealand to 0.4 million in Singapore
then rising tremendously to 1.4 in China market and falls to 0.3 in Hong Kong
and becomes barely constant up to USA market and again rises 2.6 in other
markets.
Problem 2
Part a
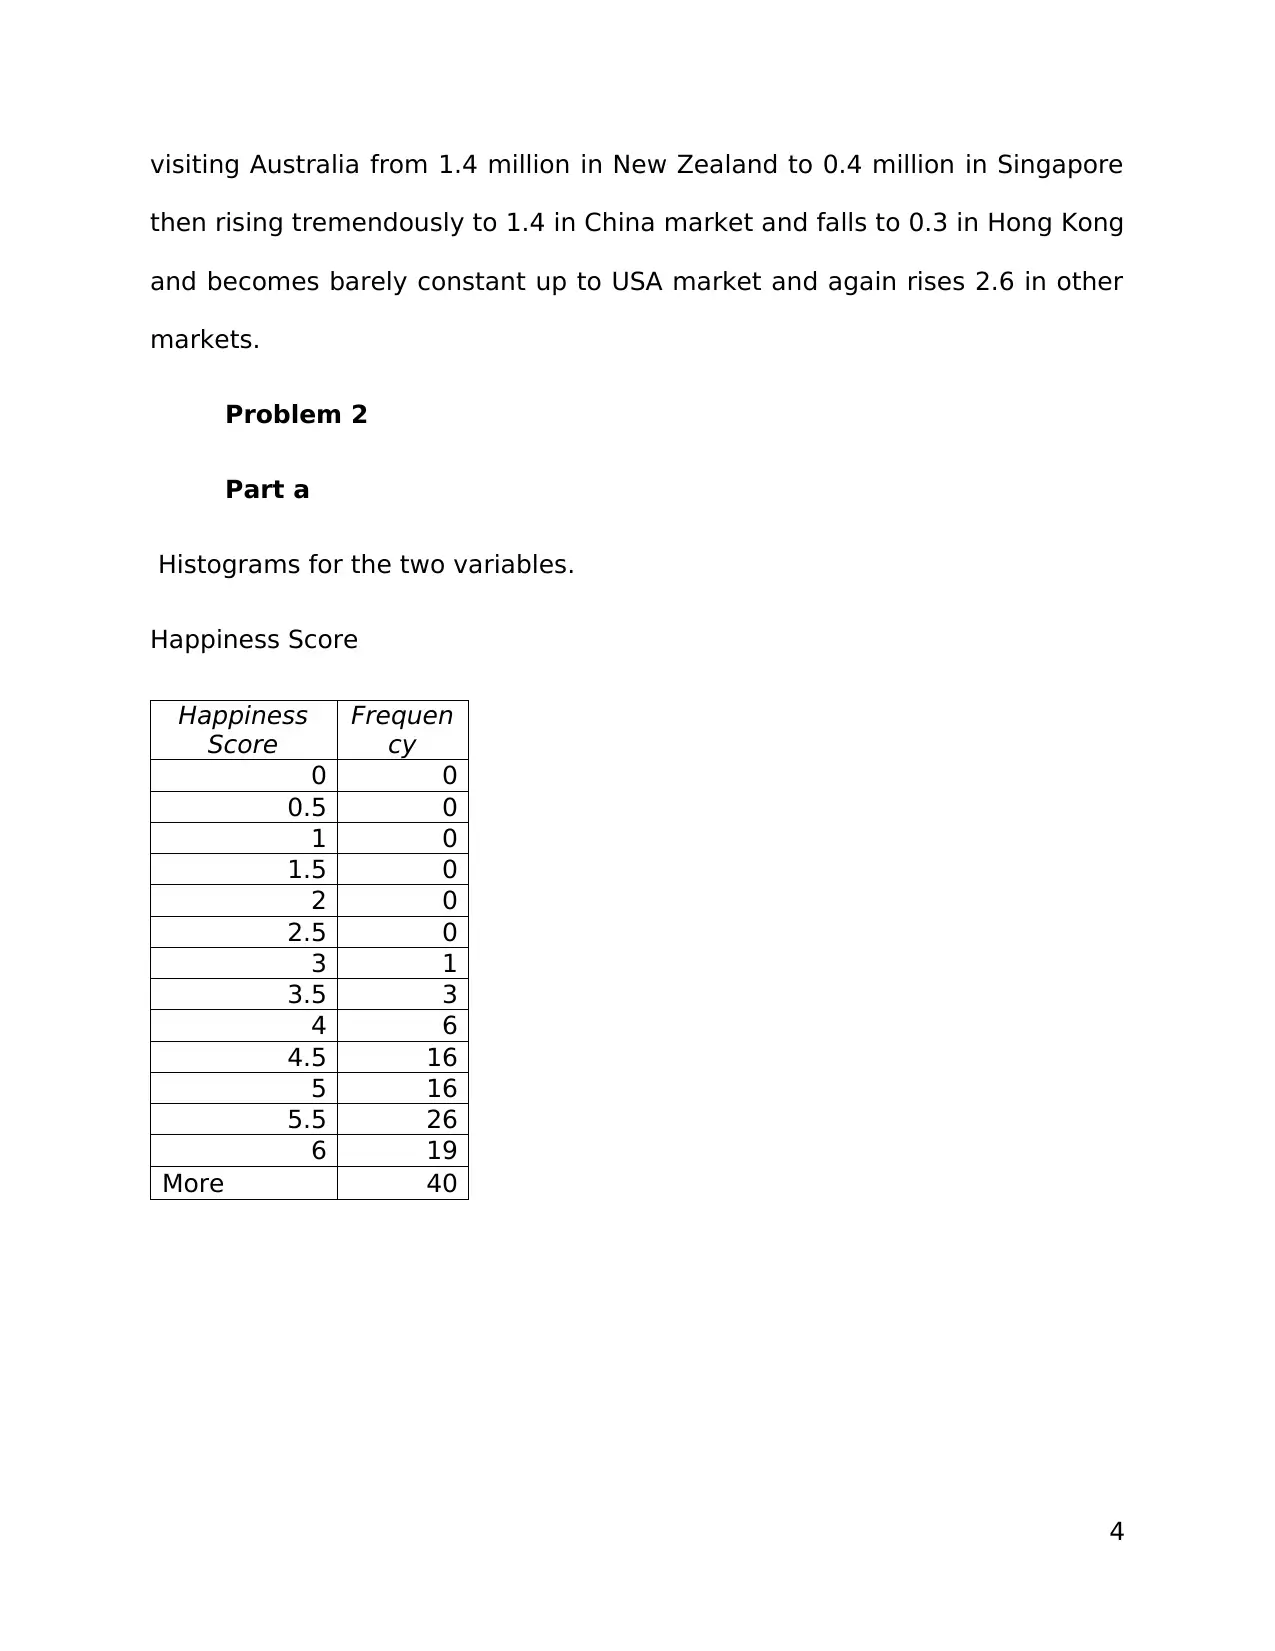
Histograms for the two variables.
Happiness Score
Happiness
Score
Frequen
cy
0 0
0.5 0
1 0
1.5 0
2 0
2.5 0
3 1
3.5 3
4 6
4.5 16
5 16
5.5 26
6 19
More 40
4
then rising tremendously to 1.4 in China market and falls to 0.3 in Hong Kong
and becomes barely constant up to USA market and again rises 2.6 in other
markets.
Problem 2
Part a
Histograms for the two variables.
Happiness Score
Happiness
Score
Frequen
cy
0 0
0.5 0
1 0
1.5 0
2 0
2.5 0
3 1
3.5 3
4 6
4.5 16
5 16
5.5 26
6 19
More 40
4
Secure Best Marks with AI Grader
Need help grading? Try our AI Grader for instant feedback on your assignments.
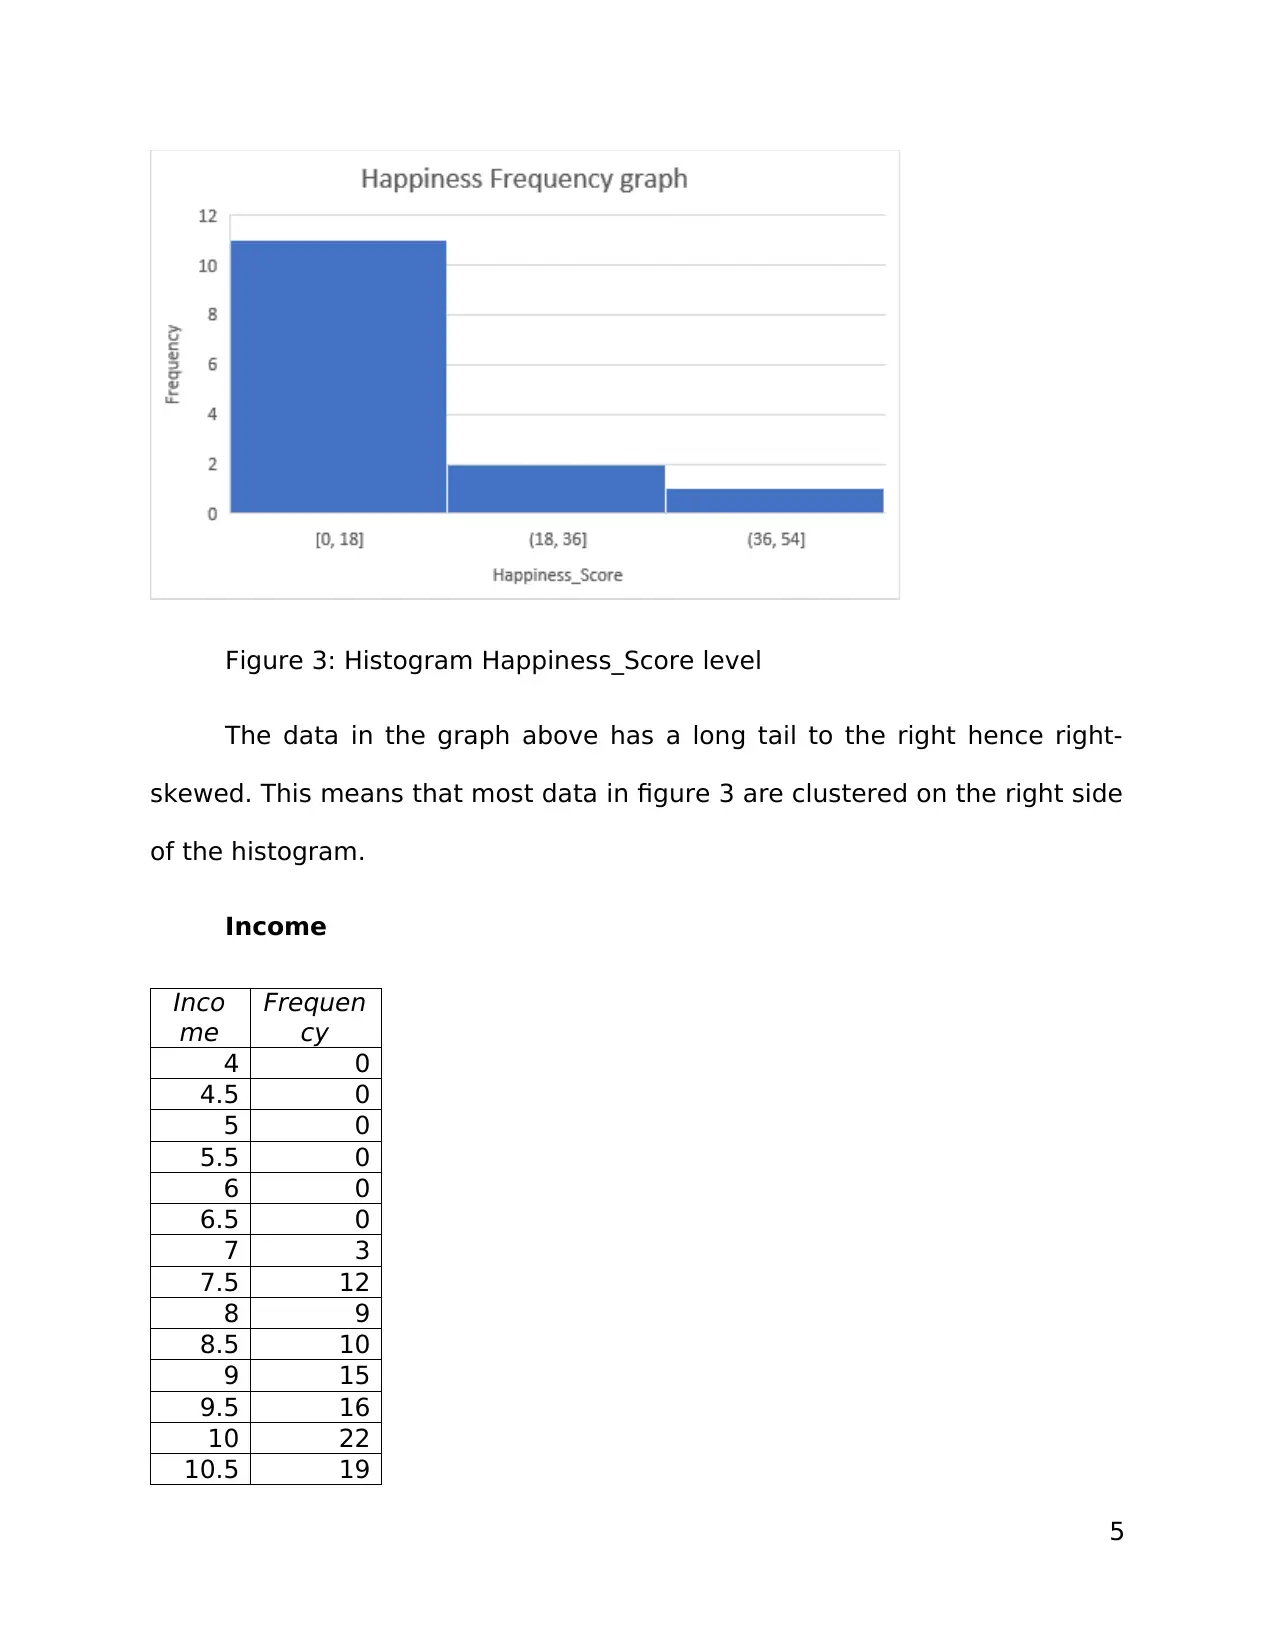
Figure 3: Histogram Happiness_Score level
The data in the graph above has a long tail to the right hence right-
skewed. This means that most data in figure 3 are clustered on the right side
of the histogram.
Income
Inco
me
Frequen
cy
4 0
4.5 0
5 0
5.5 0
6 0
6.5 0
7 3
7.5 12
8 9
8.5 10
9 15
9.5 16
10 22
10.5 19
5
The data in the graph above has a long tail to the right hence right-
skewed. This means that most data in figure 3 are clustered on the right side
of the histogram.
Income
Inco
me
Frequen
cy
4 0
4.5 0
5 0
5.5 0
6 0
6.5 0
7 3
7.5 12
8 9
8.5 10
9 15
9.5 16
10 22
10.5 19
5
11 17
11.5 4
12 0
More 127
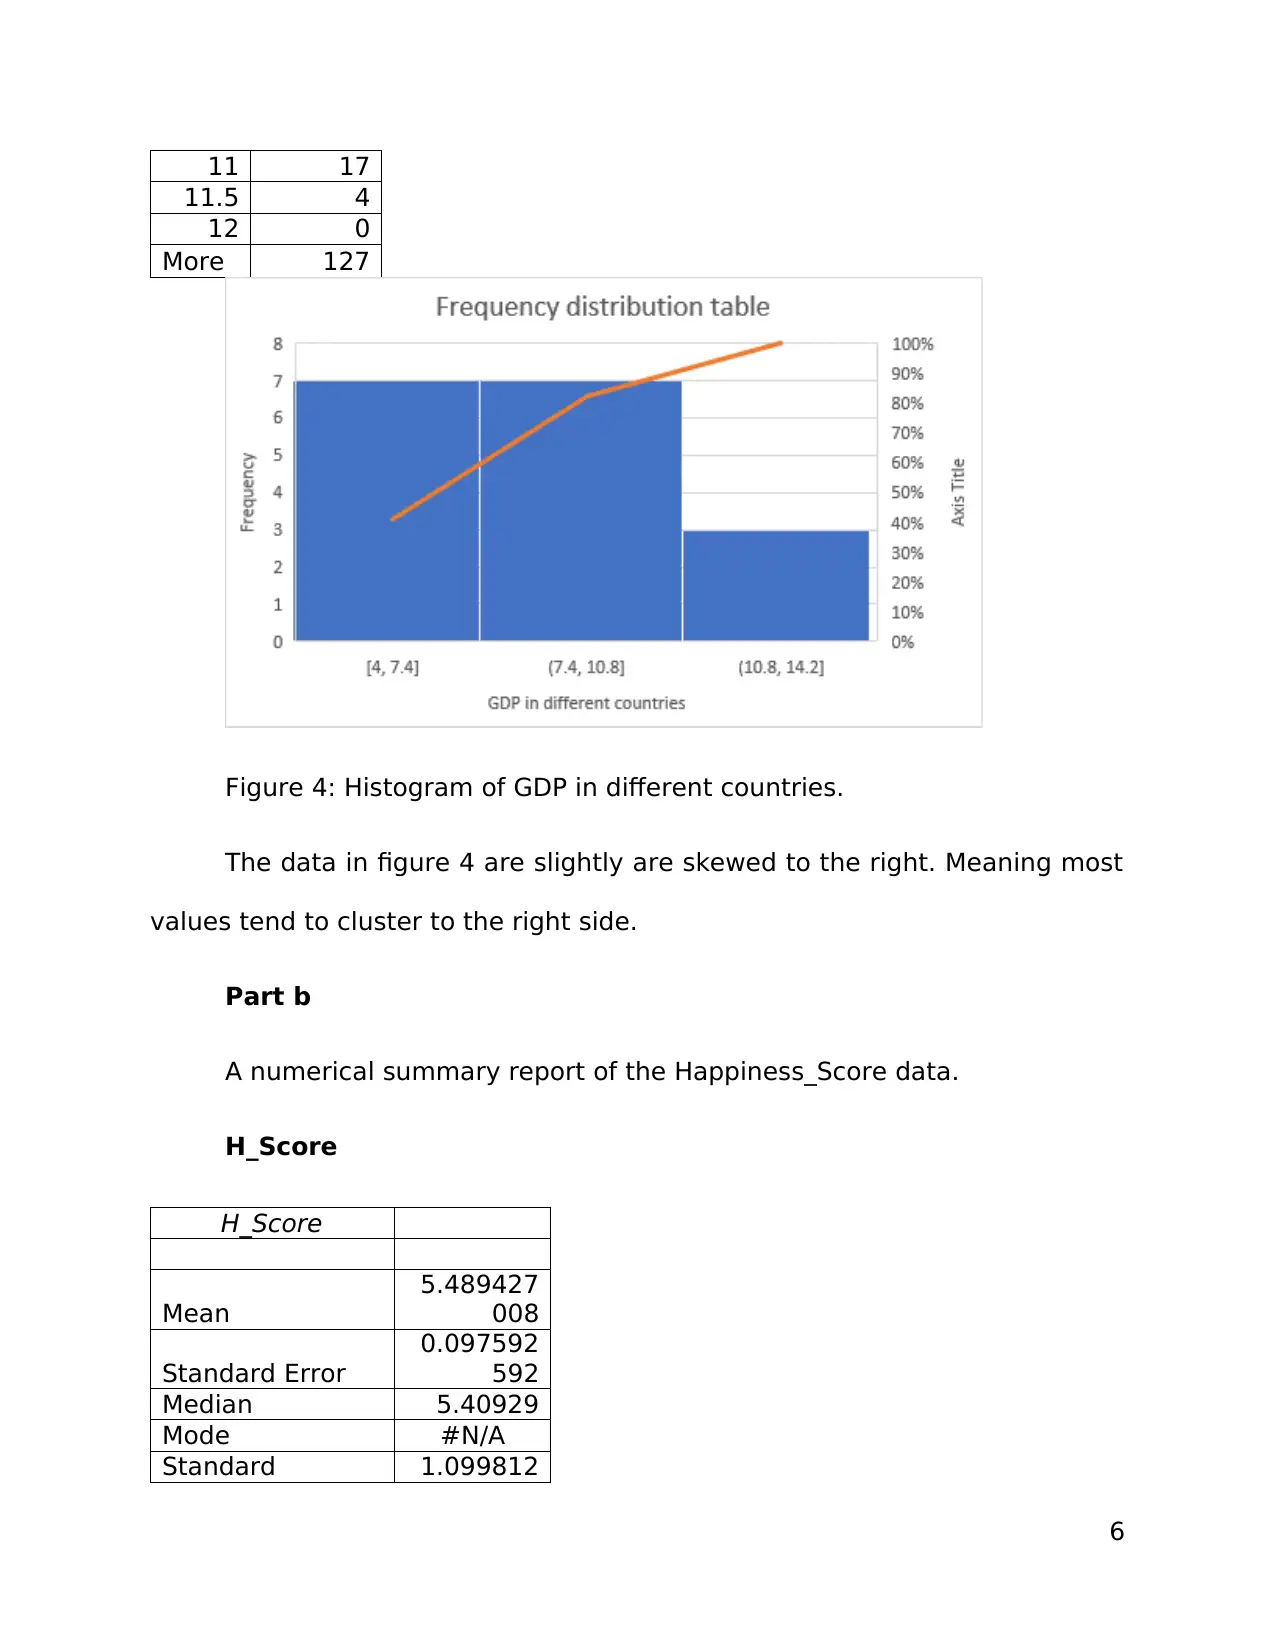
Figure 4: Histogram of GDP in different countries.
The data in figure 4 are slightly are skewed to the right. Meaning most
values tend to cluster to the right side.
Part b
A numerical summary report of the Happiness_Score data.
H_Score
H_Score
Mean
5.489427
008
Standard Error
0.097592
592
Median 5.40929
Mode #N/A
Standard 1.099812
6
11.5 4
12 0
More 127
Figure 4: Histogram of GDP in different countries.
The data in figure 4 are slightly are skewed to the right. Meaning most
values tend to cluster to the right side.
Part b
A numerical summary report of the Happiness_Score data.
H_Score
H_Score
Mean
5.489427
008
Standard Error
0.097592
592
Median 5.40929
Mode #N/A
Standard 1.099812
6
Deviation 656
Sample Variance
1.209587
877
Kurtosis
-
0.539475
91
Skewness
0.039866
696
Range 5.16381
Minimum 2.6943
Maximum 7.85811
Sum
697.1572
3
Count 127
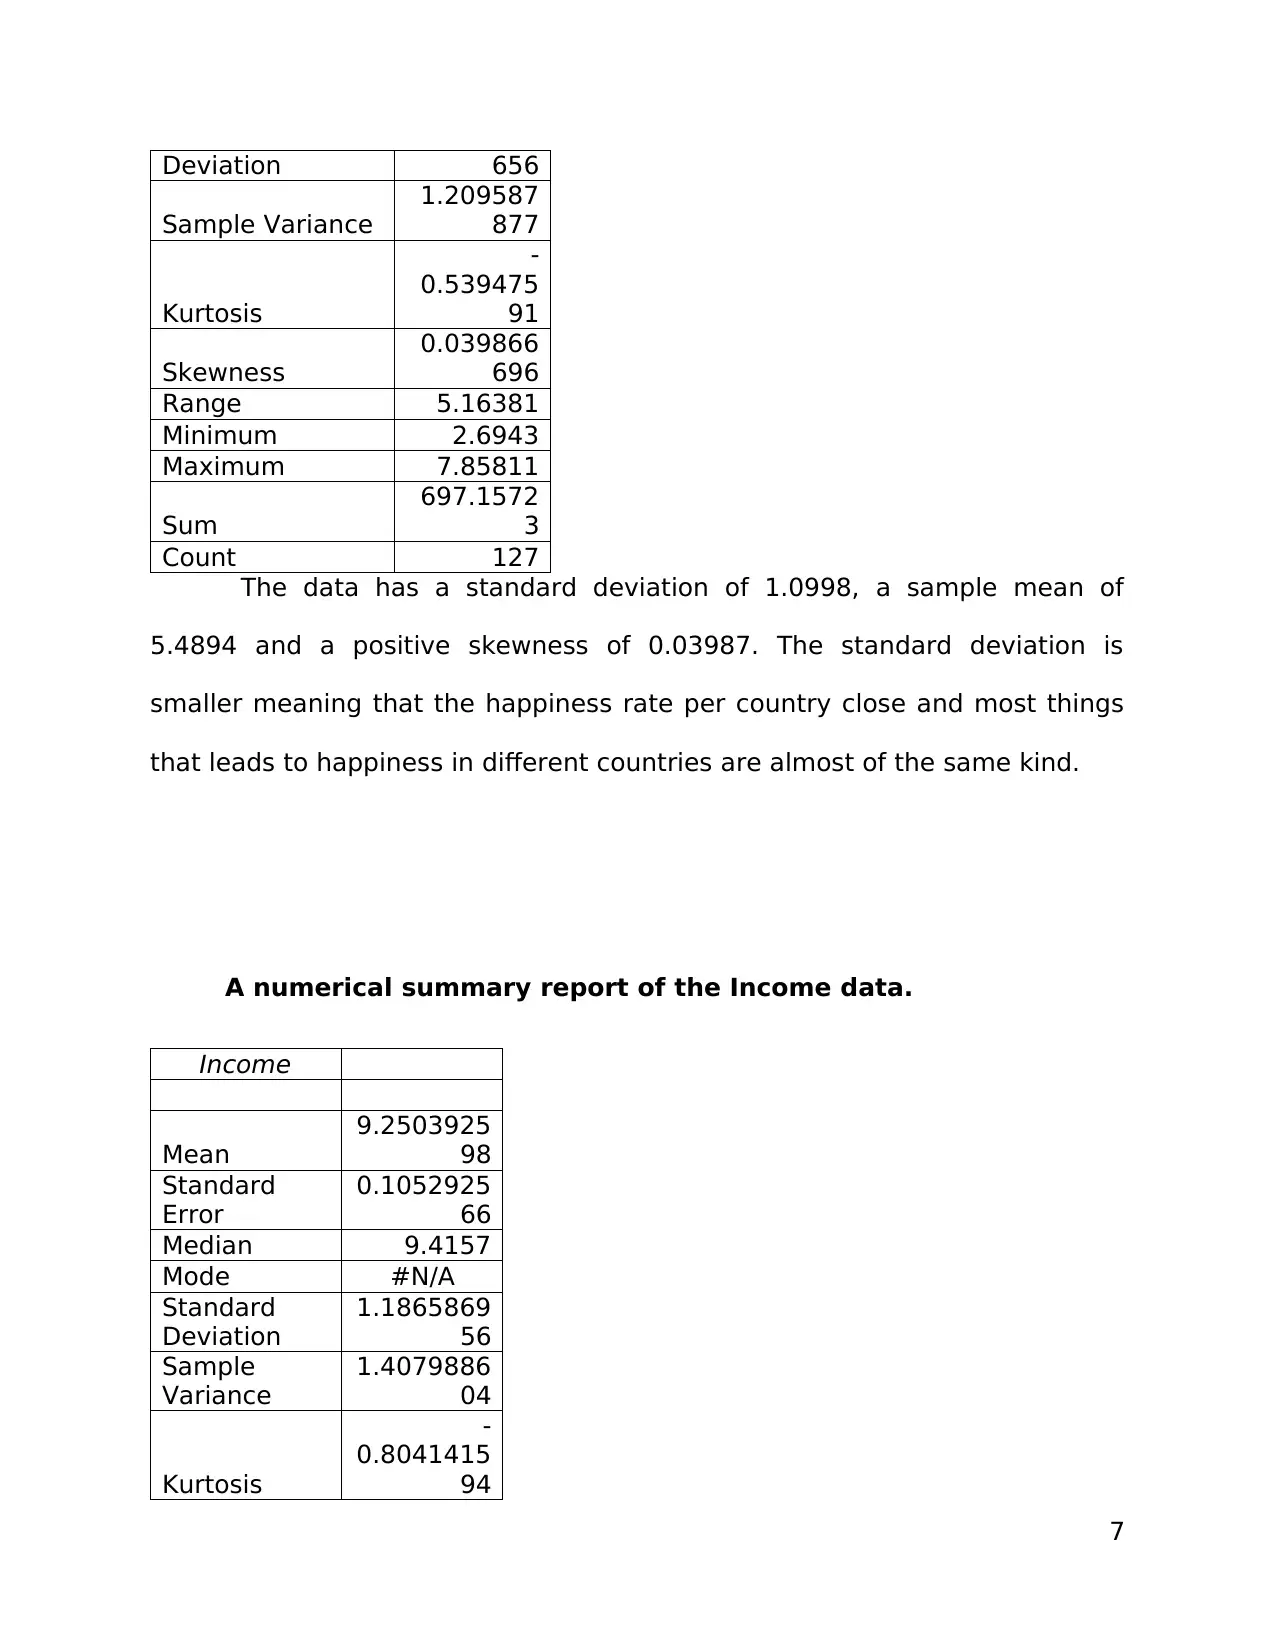
The data has a standard deviation of 1.0998, a sample mean of
5.4894 and a positive skewness of 0.03987. The standard deviation is
smaller meaning that the happiness rate per country close and most things
that leads to happiness in different countries are almost of the same kind.
A numerical summary report of the Income data.
Income
Mean
9.2503925
98
Standard
Error
0.1052925
66
Median 9.4157
Mode #N/A
Standard
Deviation
1.1865869
56
Sample
Variance
1.4079886
04
Kurtosis
-
0.8041415
94
7
Sample Variance
1.209587
877
Kurtosis
-
0.539475
91
Skewness
0.039866
696
Range 5.16381
Minimum 2.6943
Maximum 7.85811
Sum
697.1572
3
Count 127
The data has a standard deviation of 1.0998, a sample mean of
5.4894 and a positive skewness of 0.03987. The standard deviation is
smaller meaning that the happiness rate per country close and most things
that leads to happiness in different countries are almost of the same kind.
A numerical summary report of the Income data.
Income
Mean
9.2503925
98
Standard
Error
0.1052925
66
Median 9.4157
Mode #N/A
Standard
Deviation
1.1865869
56
Sample
Variance
1.4079886
04
Kurtosis
-
0.8041415
94
7
Paraphrase This Document
Need a fresh take? Get an instant paraphrase of this document with our AI Paraphraser
Skewness
-
0.3916180
89
Range 4.91287
Minimum 6.54103
Maximum 11.4539
Sum
1174.7998
6
Count 127
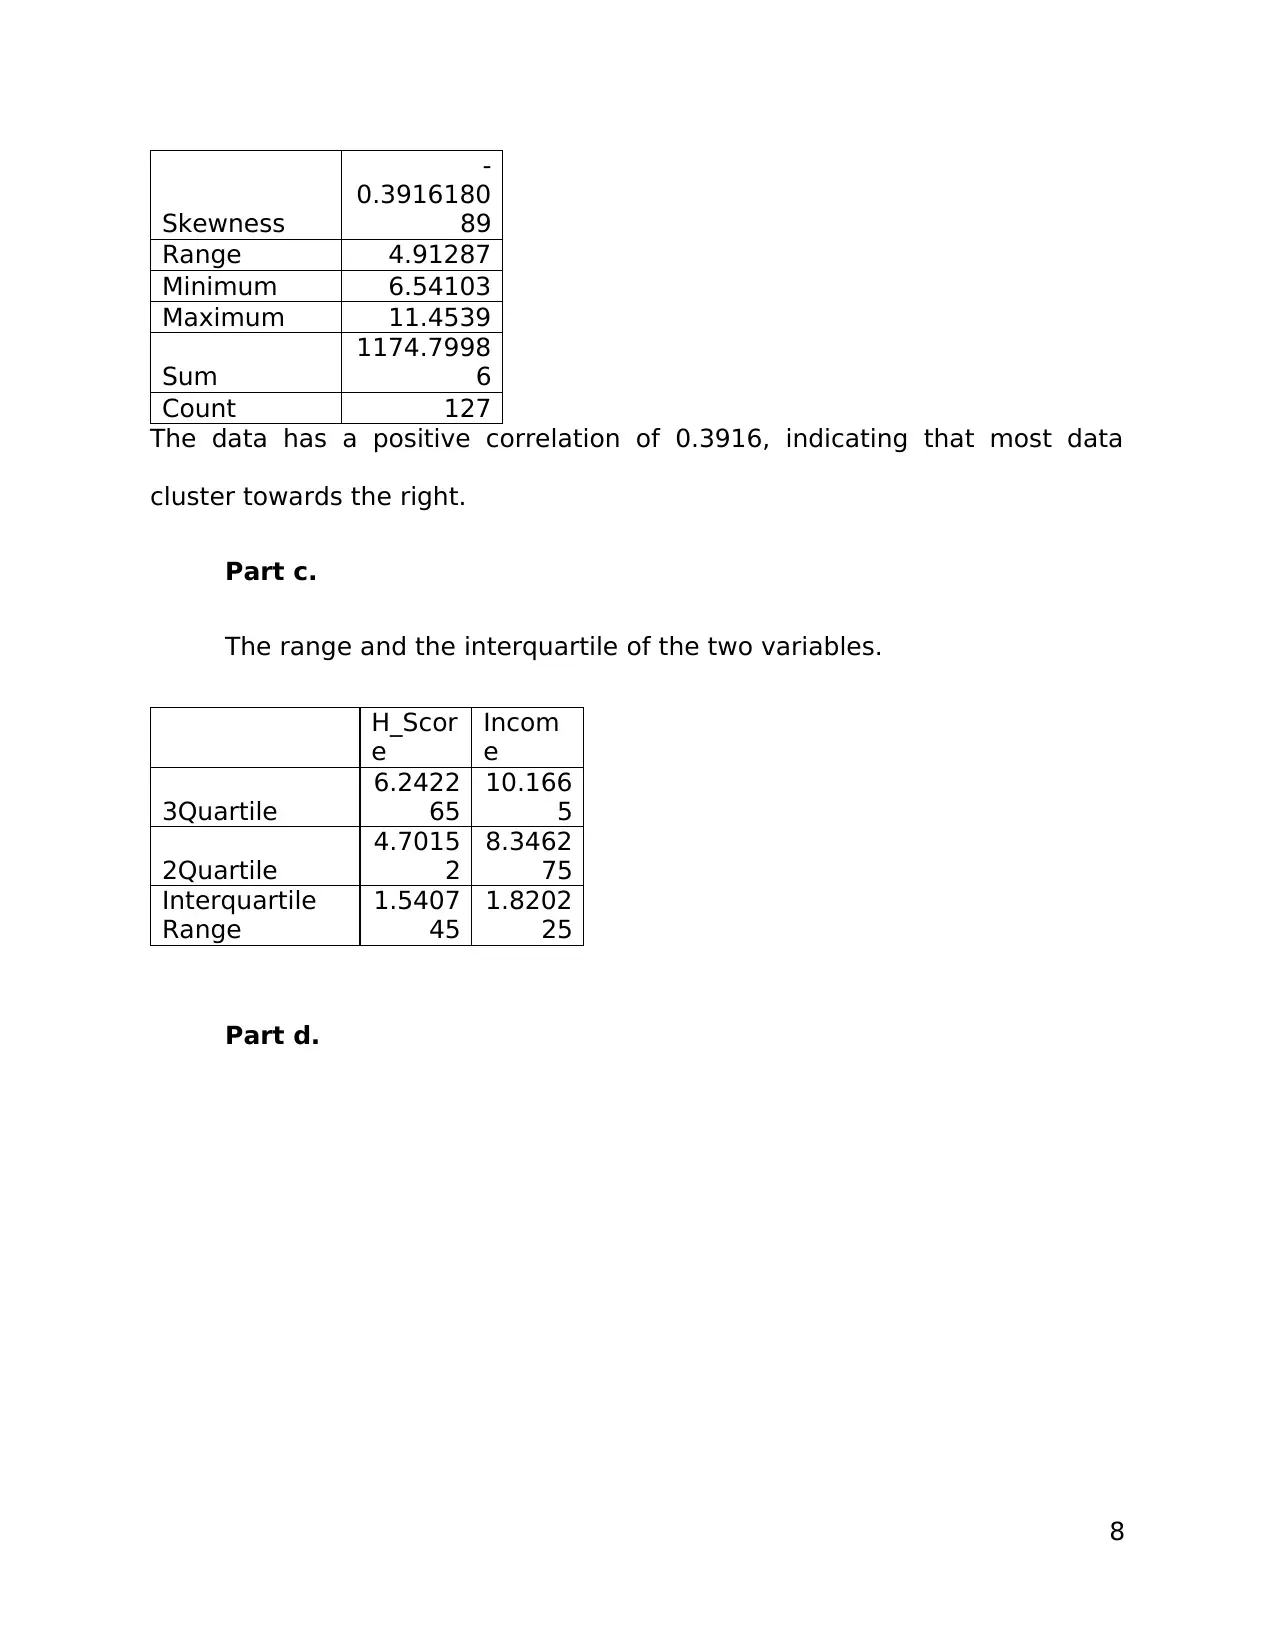
The data has a positive correlation of 0.3916, indicating that most data
cluster towards the right.
Part c.
The range and the interquartile of the two variables.
H_Scor
e
Incom
e
3Quartile
6.2422
65
10.166
5
2Quartile
4.7015
2
8.3462
75
Interquartile
Range
1.5407
45
1.8202
25
Part d.
8
-
0.3916180
89
Range 4.91287
Minimum 6.54103
Maximum 11.4539
Sum
1174.7998
6
Count 127
The data has a positive correlation of 0.3916, indicating that most data
cluster towards the right.
Part c.
The range and the interquartile of the two variables.
H_Scor
e
Incom
e
3Quartile
6.2422
65
10.166
5
2Quartile
4.7015
2
8.3462
75
Interquartile
Range
1.5407
45
1.8202
25
Part d.
8
2 3 4 5 6 7 8 9 10 11 12
0
2
4
6
8
10
12
14
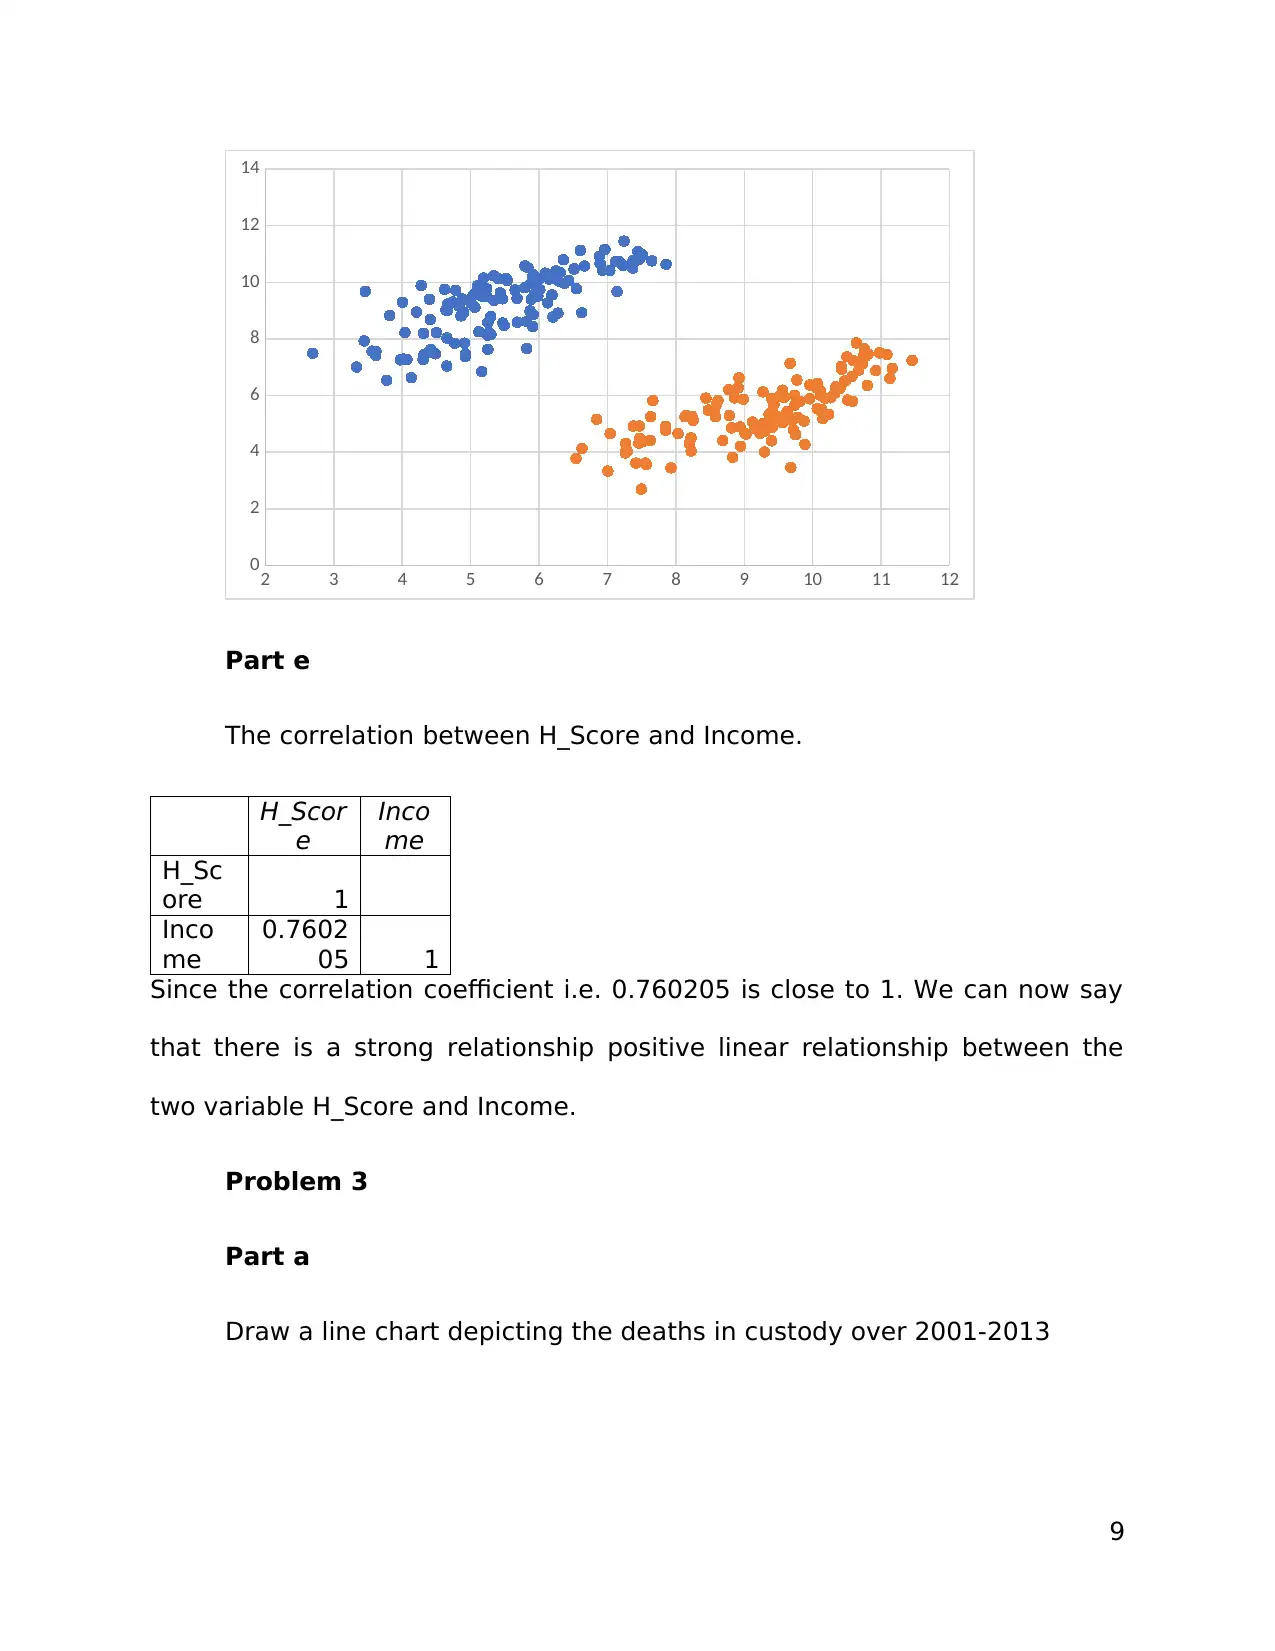
Part e
The correlation between H_Score and Income.
H_Scor
e
Inco
me
H_Sc
ore 1
Inco
me
0.7602
05 1
Since the correlation coefficient i.e. 0.760205 is close to 1. We can now say
that there is a strong relationship positive linear relationship between the
two variable H_Score and Income.
Problem 3
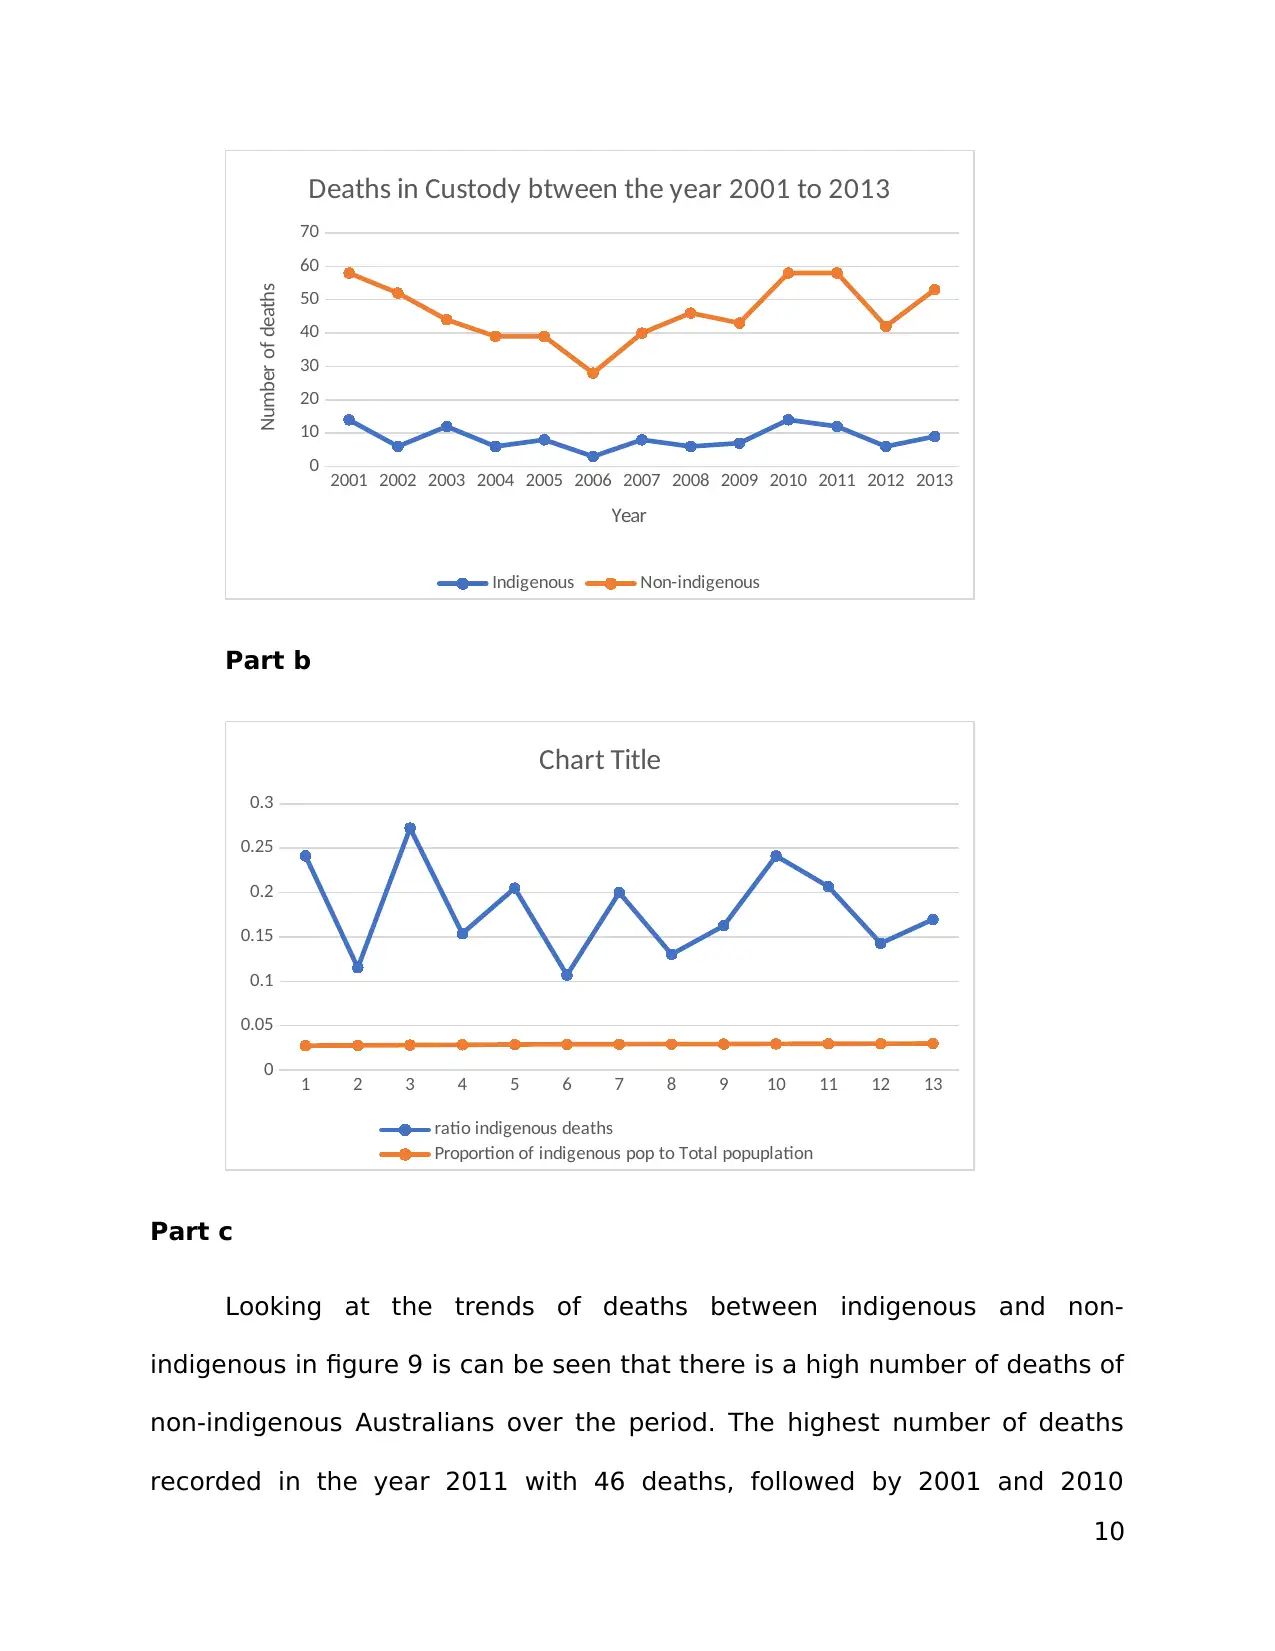
Part a
Draw a line chart depicting the deaths in custody over 2001-2013
9
0
2
4
6
8
10
12
14
Part e
The correlation between H_Score and Income.
H_Scor
e
Inco
me
H_Sc
ore 1
Inco
me
0.7602
05 1
Since the correlation coefficient i.e. 0.760205 is close to 1. We can now say
that there is a strong relationship positive linear relationship between the
two variable H_Score and Income.
Problem 3
Part a
Draw a line chart depicting the deaths in custody over 2001-2013
9
2001 2002 2003 2004 2005 2006 2007 2008 2009 2010 2011 2012 2013
0
10
20
30
40
50
60
70
Deaths in Custody btween the year 2001 to 2013
Indigenous Non-indigenous
Year
Number of deaths
Part b
1 2 3 4 5 6 7 8 9 10 11 12 13
0
0.05
0.1
0.15
0.2
0.25
0.3
Chart Title
ratio indigenous deaths
Proportion of indigenous pop to Total popuplation
Part c
Looking at the trends of deaths between indigenous and non-
indigenous in figure 9 is can be seen that there is a high number of deaths of
non-indigenous Australians over the period. The highest number of deaths
recorded in the year 2011 with 46 deaths, followed by 2001 and 2010
10
0
10
20
30
40
50
60
70
Deaths in Custody btween the year 2001 to 2013
Indigenous Non-indigenous
Year
Number of deaths
Part b
1 2 3 4 5 6 7 8 9 10 11 12 13
0
0.05
0.1
0.15
0.2
0.25
0.3
Chart Title
ratio indigenous deaths
Proportion of indigenous pop to Total popuplation
Part c
Looking at the trends of deaths between indigenous and non-
indigenous in figure 9 is can be seen that there is a high number of deaths of
non-indigenous Australians over the period. The highest number of deaths
recorded in the year 2011 with 46 deaths, followed by 2001 and 2010
10
Secure Best Marks with AI Grader
Need help grading? Try our AI Grader for instant feedback on your assignments.
registering both 44 deaths. The lowest deaths of non-indigenous were
recorded in the year 2006 with 25 deaths. On the other hand, indigenous
deaths recorded low rates over the periods with high deaths occurring
between the year 2001 and 2010, both having 14 deaths.
In figure 10, the ratio of indigenous deaths to the total population is
high over the study period while the proportion of the population fairly
remains constant over the period.
Problem 4
Part a
Given
μ=105, variance=225 σ=2250.5=15 x=135
Z=x-μσ
Z=135-10515
Z=2
Using the normal distribution table to obtain the p(z=2)=0.9972
Yes, the probability of me being accepted to be a member is 99.72%.
Part b.
Solution.
Given μ= 20 minutes, s=5 minutes, n=25 x=10
11
Using the formula Z=x-μs/√n to calculate the z statistic
Z=10-205/5=-10
P(z<-10)=0.8413
Therefore, the p(z>10)=1-0.8413=0.1587
Now the probability that she needs more than 10 hours to mark all the
assignment is 0.1587.
12
Z=10-205/5=-10
P(z<-10)=0.8413
Therefore, the p(z>10)=1-0.8413=0.1587
Now the probability that she needs more than 10 hours to mark all the
assignment is 0.1587.
12
1 out of 12
Your All-in-One AI-Powered Toolkit for Academic Success.
+13062052269
info@desklib.com
Available 24*7 on WhatsApp / Email
![[object Object]](/_next/static/media/star-bottom.7253800d.svg)
Unlock your academic potential
© 2024 | Zucol Services PVT LTD | All rights reserved.