Quantitative Assessment of Crime Rate Data
Added on 2023-01-11
12 Pages2417 Words49 Views
Quantitative assessment crime
rate data
rate data
Contents
SECTION A.....................................................................................................................................1
Summary Statistics......................................................................................................................1
Do states in the south have a higher crime rate?.........................................................................2
Is there a relationship between crime rate and police expenditure?............................................3
Have crime rates increased in 10 years?......................................................................................4
Is youth unemployment higher in the south?...............................................................................5
SECTION B.....................................................................................................................................7
Probability and statistical significance........................................................................................7
How to choose statistical test and theory about the tests.............................................................7
Assumption underlying parametric and non parametric tests......................................................8
Levels of measurement................................................................................................................8
REFERENCES..............................................................................................................................10

SECTION A
Summary Statistics
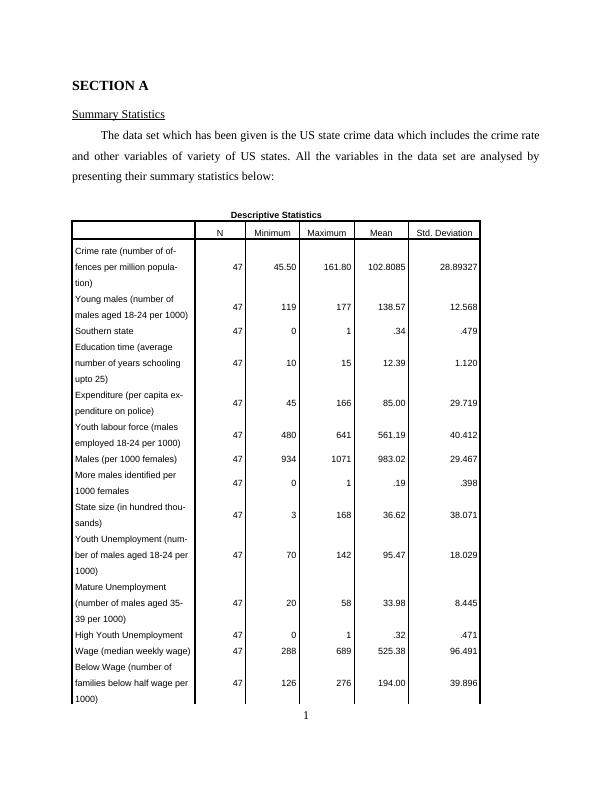
The data set which has been given is the US state crime data which includes the crime rate
and other variables of variety of US states. All the variables in the data set are analysed by
presenting their summary statistics below:
Descriptive Statistics
N Minimum Maximum Mean Std. Deviation
Crime rate (number of of-
fences per million popula-
tion)
47 45.50 161.80 102.8085 28.89327
Young males (number of
males aged 18-24 per 1000) 47 119 177 138.57 12.568
Southern state 47 0 1 .34 .479
Education time (average
number of years schooling
upto 25)
47 10 15 12.39 1.120
Expenditure (per capita ex-
penditure on police) 47 45 166 85.00 29.719
Youth labour force (males
employed 18-24 per 1000) 47 480 641 561.19 40.412
Males (per 1000 females) 47 934 1071 983.02 29.467
More males identified per
1000 females 47 0 1 .19 .398
State size (in hundred thou-
sands) 47 3 168 36.62 38.071
Youth Unemployment (num-
ber of males aged 18-24 per
1000)
47 70 142 95.47 18.029
Mature Unemployment
(number of males aged 35-
39 per 1000)
47 20 58 33.98 8.445
High Youth Unemployment 47 0 1 .32 .471
Wage (median weekly wage) 47 288 689 525.38 96.491
Below Wage (number of
families below half wage per
1000)
47 126 276 194.00 39.896
1
Summary Statistics
The data set which has been given is the US state crime data which includes the crime rate
and other variables of variety of US states. All the variables in the data set are analysed by
presenting their summary statistics below:
Descriptive Statistics
N Minimum Maximum Mean Std. Deviation
Crime rate (number of of-
fences per million popula-
tion)
47 45.50 161.80 102.8085 28.89327
Young males (number of
males aged 18-24 per 1000) 47 119 177 138.57 12.568
Southern state 47 0 1 .34 .479
Education time (average
number of years schooling
upto 25)
47 10 15 12.39 1.120
Expenditure (per capita ex-
penditure on police) 47 45 166 85.00 29.719
Youth labour force (males
employed 18-24 per 1000) 47 480 641 561.19 40.412
Males (per 1000 females) 47 934 1071 983.02 29.467
More males identified per
1000 females 47 0 1 .19 .398
State size (in hundred thou-
sands) 47 3 168 36.62 38.071
Youth Unemployment (num-
ber of males aged 18-24 per
1000)
47 70 142 95.47 18.029
Mature Unemployment
(number of males aged 35-
39 per 1000)
47 20 58 33.98 8.445
High Youth Unemployment 47 0 1 .32 .471
Wage (median weekly wage) 47 288 689 525.38 96.491
Below Wage (number of
families below half wage per
1000)
47 126 276 194.00 39.896
1
End of preview
Want to access all the pages? Upload your documents or become a member.
Related Documents
Applied Research Methodslg...
|11
|2293
|436
SPSS Data Analysis: Relations and Variable Analysislg...
|28
|3462
|497