MITS6002 Business Analytics: Retail Insights, Regression & Class
VerifiedAdded on 2023/03/30
|13
|2128
|357
Report
AI Summary
This report provides a comprehensive analysis of business analytics techniques. It begins with a critical review of the CommBank Retail Business Insights Report FY18, evaluating its visualization quality, presentability, and informational content, followed by key insights derived from the report and suggested improvements. The study then delves into regression analysis, using height and weight data to compute the regression line equation and R-squared value, complemented by Excel-based analysis. Finally, it explores classification methods, differentiating them from prediction, outlining various classification techniques, developing algebraic equations from neural networks, and discussing clustering applications in business analytics, particularly in defect detection and product segmentation.

Running head: QUANTITATIVE BUSINESS ANALYSIS 1
Statistics
Student Name
Professor’s Name
University Name
Date
Statistics
Student Name
Professor’s Name
University Name
Date
Paraphrase This Document
Need a fresh take? Get an instant paraphrase of this document with our AI Paraphraser
QUANTITATIVE BUSINESS ANALYSIS 2
QUESTION 1: CASE STUDY
I. Comment on the Insights Report Based on Overall Features
a. Quality of Visualization
The insights report has a clear concise dashboard that is the face of the
visualization. A single look into the face of the report or the dashboard clearly shows
majority of the vital information needed. It is clear, has color pops and enough white
space thus striking a balance which makes it more attractive to the eye. Moreover, the
insight report summarizes the data that matters in a simple, short language and with
the use of colored visualization tools such as graphs, bar charts etc.
b. Presentability
The insights report utilizes different methods of data presentation. The methods
range from textual to graphical display. Textual display has been used differently in
terms of font size. Larger font sizes indicate the titles and the subtitles while the
smaller fonts are used for detailing and explanations. Graphical displays such as bar
charts and histograms have also been used to summarize the data. Additionally,
percentages in large numerical font sizes have also been used as indicators of the top
KPI’s that are being tracked, and the trends being monitored.
c. Information Provided
The information provided on the insights report is sufficient enough to reach the
desired target. It begins with the title, overview, the various subtitles containing the
required details and the summary of the details in graphical and numerical form. This
makes it easy for the reader to extract the detailed information he/she requires in a
simple and a systematic manner.
QUANTITATIVE BUSINESS ANALYSIS 3
II. Key Information Derived from the Insights Report and how it is Useful in Decision
Making.
The main aim of the insights report is to determine how the Australian retailers
are increasingly embracing innovative mindsets to make sure that they optimally
maximize the opportunities available, make use of technology and improve on customers
experience so that they combat the competitive pressures, improve efficiencies and
maintain or grow their performance. Therefore, the key information that can be derived
from the insight report is the general information and the data collected about the retail
business in the country, the innovation performance about various retail businesses, the
dynamics of innovation, investment on innovation and the returns of innovation.
The general information and the data collected about the retail industry in
Australia will help make the decision of whether the collected data is accurate and
representative of the whole retail industry hence capable of being used for analysis and
reporting. On the other hand, the innovation performance, dynamics of innovation,
investment and returns on innovation will provide information on how various retail
businesses respond to adoption or rejection of innovation techniques. This will help
decide on which between innovation adoption is rejection is worthwhile.
III. Abstract Summarizing the Insights Report
The Australian retail sector is working hard to counter the impact of growing
competition and at the same time respond to the desire to increase efficiency to maintain
and grow their performance. It is doing so by continuously adopting an innovative
mindset to maximize available opportunities, leverage technology and enhance customer
experience. Analysis of a subset of data comprising of 262 retailers collected on behalf of
⊘ This is a preview!⊘
Do you want full access?
Subscribe today to unlock all pages.
Trusted by 1+ million students worldwide
QUANTITATIVE BUSINESS ANALYSIS 4
the Commonwealth bank indicate that retailers who have taken a step in investing on
innovation techniques generate substantial and timely return while those who reject
innovation techniques are yet to gain financial and intangible benefits that come along
with innovation.
IV. Suggested Improvements to the Insight Report.
Besides the insights report being appealing to the eye and quite interactive in
presentation. It would be better if improvements were made on its length. The insight
report provided is long enough to create a boredom among readers. Shorter length would
promote ease and fast retrieval of required information. Besides, the insight report should
have adopted other various methods of presentation such as use pie-charts and box plots
rather than focusing on bar charts and histograms alone. This would make it more
attractive and convenient for the reader.
QUESTION 2: REGRESSION ANALYSIS
I. Example of where regression analysis can be effectively used.
Regression is a statistical technique that in normally used to examine and
determine the relationship between variables. Regression analysis is commonly applied in
businesses to predict and forecast the oncoming or future risks and opportunities for a
given business. For example, regression analysis is used to predict the future demand for
a consumer so that the business can balance its supply in that given time. The technique
can also be used to forecast the foot traffic expected in a given retail avenue and use the
data to determine the rent per square feet for retail premises.
Paraphrase This Document
Need a fresh take? Get an instant paraphrase of this document with our AI Paraphraser
QUANTITATIVE BUSINESS ANALYSIS 5
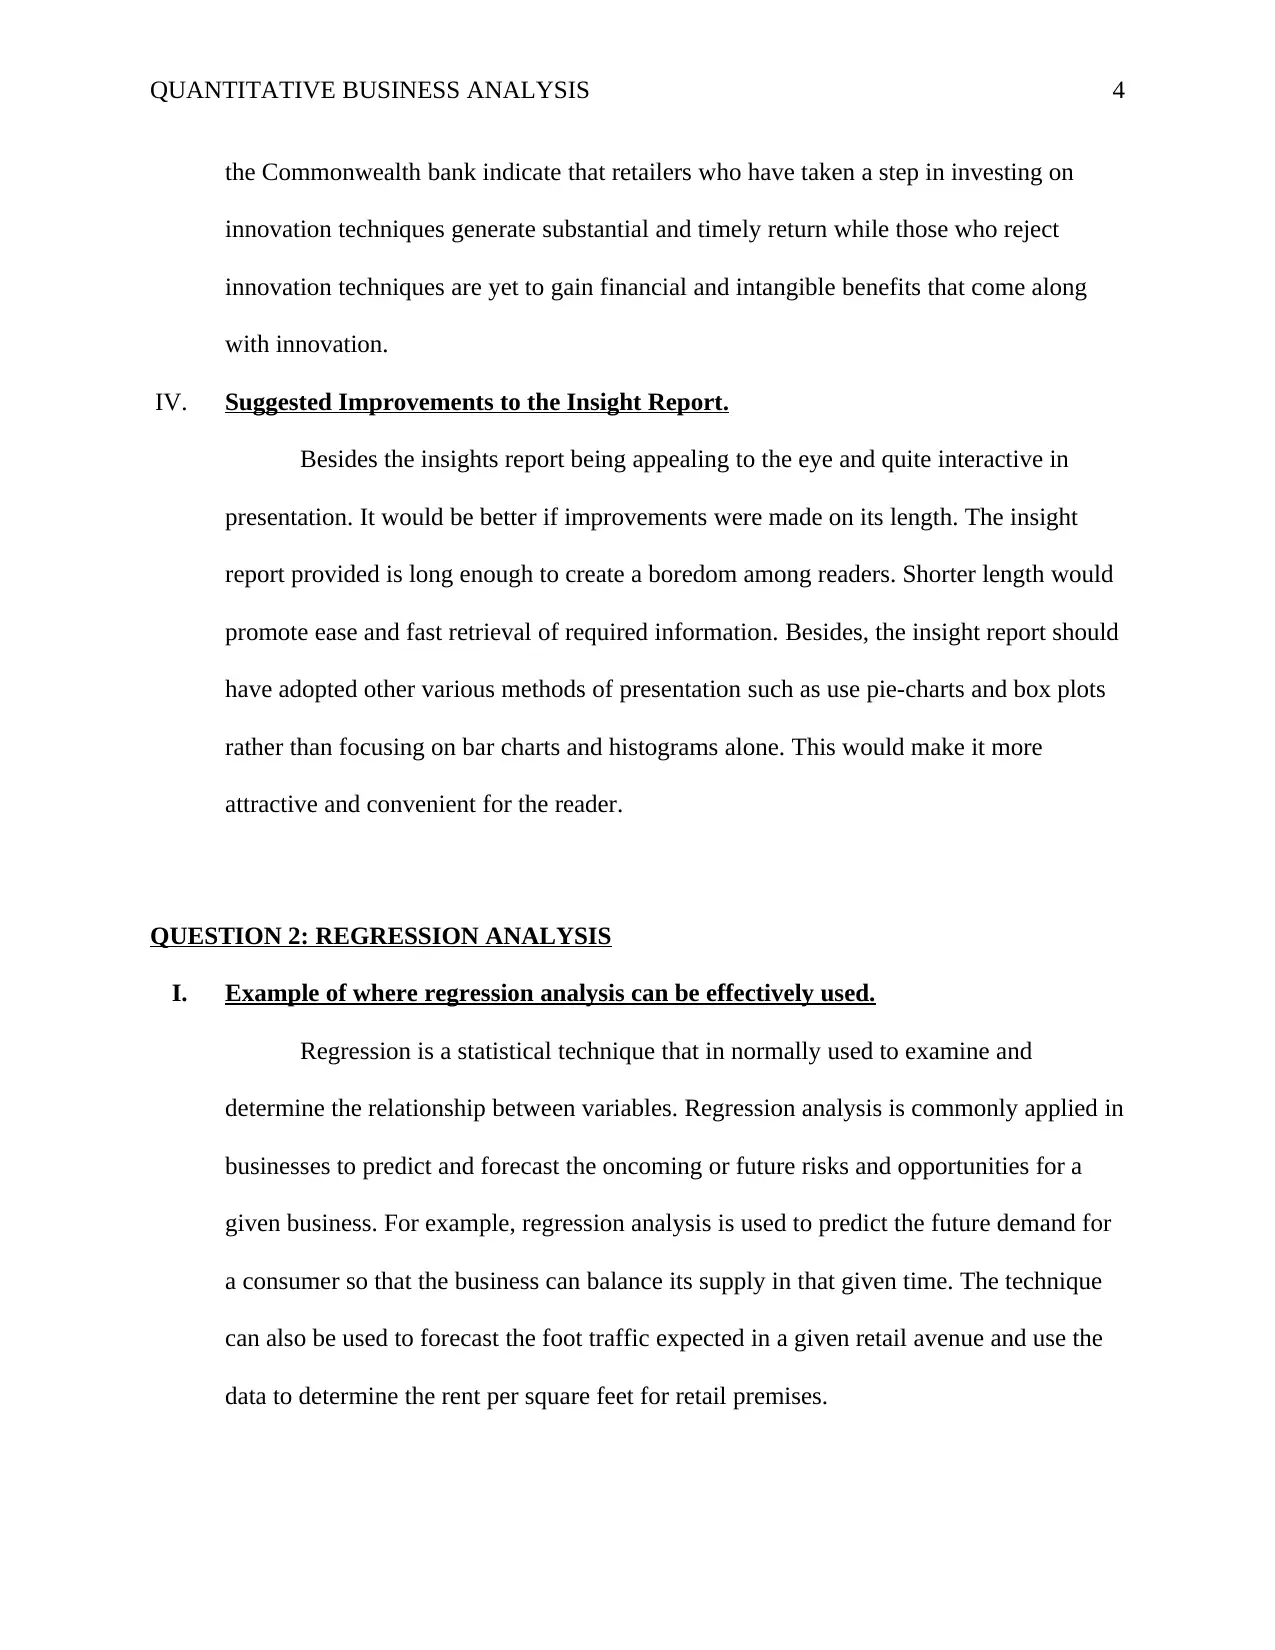
II. Table of Height Against Weight for Students
The table below shows the heights and weights for different students collected to
be used to perform a regression analysis.
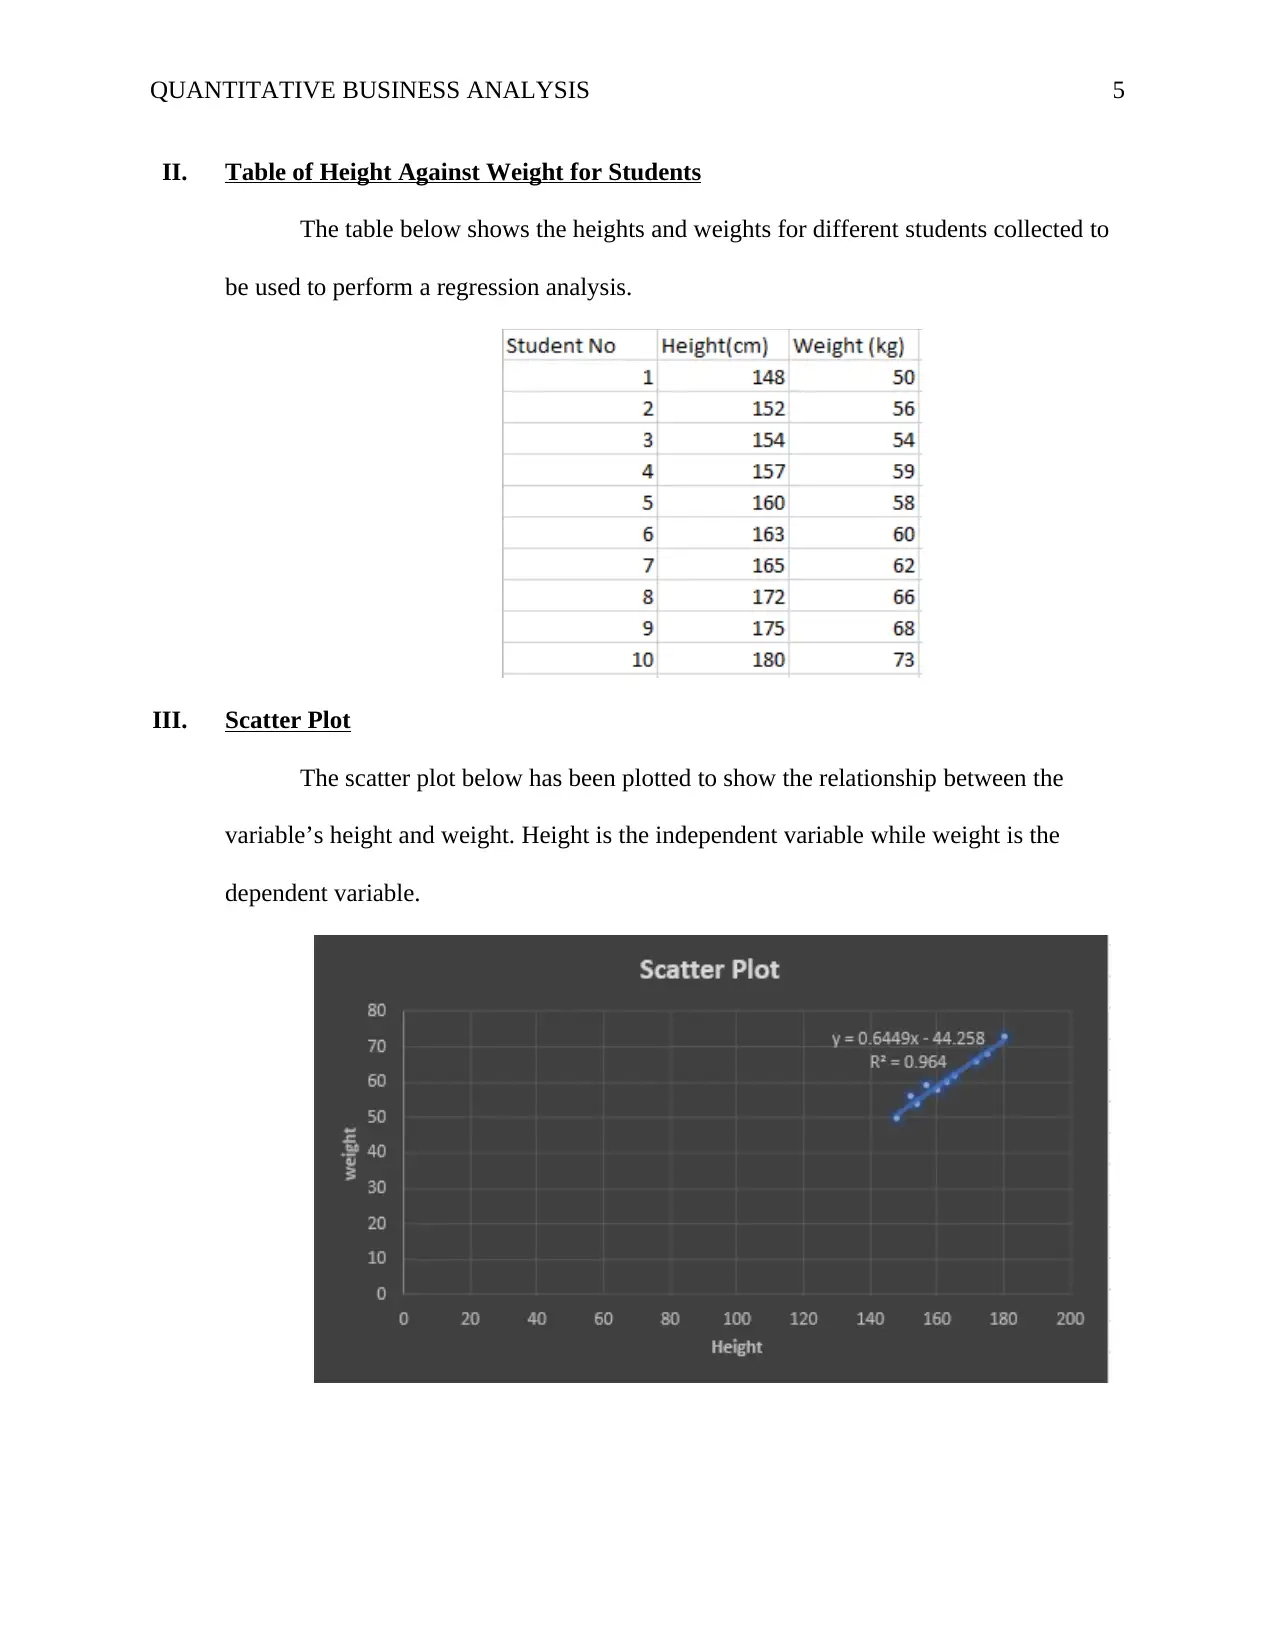
III. Scatter Plot
The scatter plot below has been plotted to show the relationship between the
variable’s height and weight. Height is the independent variable while weight is the
dependent variable.
II. Table of Height Against Weight for Students
The table below shows the heights and weights for different students collected to
be used to perform a regression analysis.
III. Scatter Plot
The scatter plot below has been plotted to show the relationship between the
variable’s height and weight. Height is the independent variable while weight is the
dependent variable.
QUANTITATIVE BUSINESS ANALYSIS 6
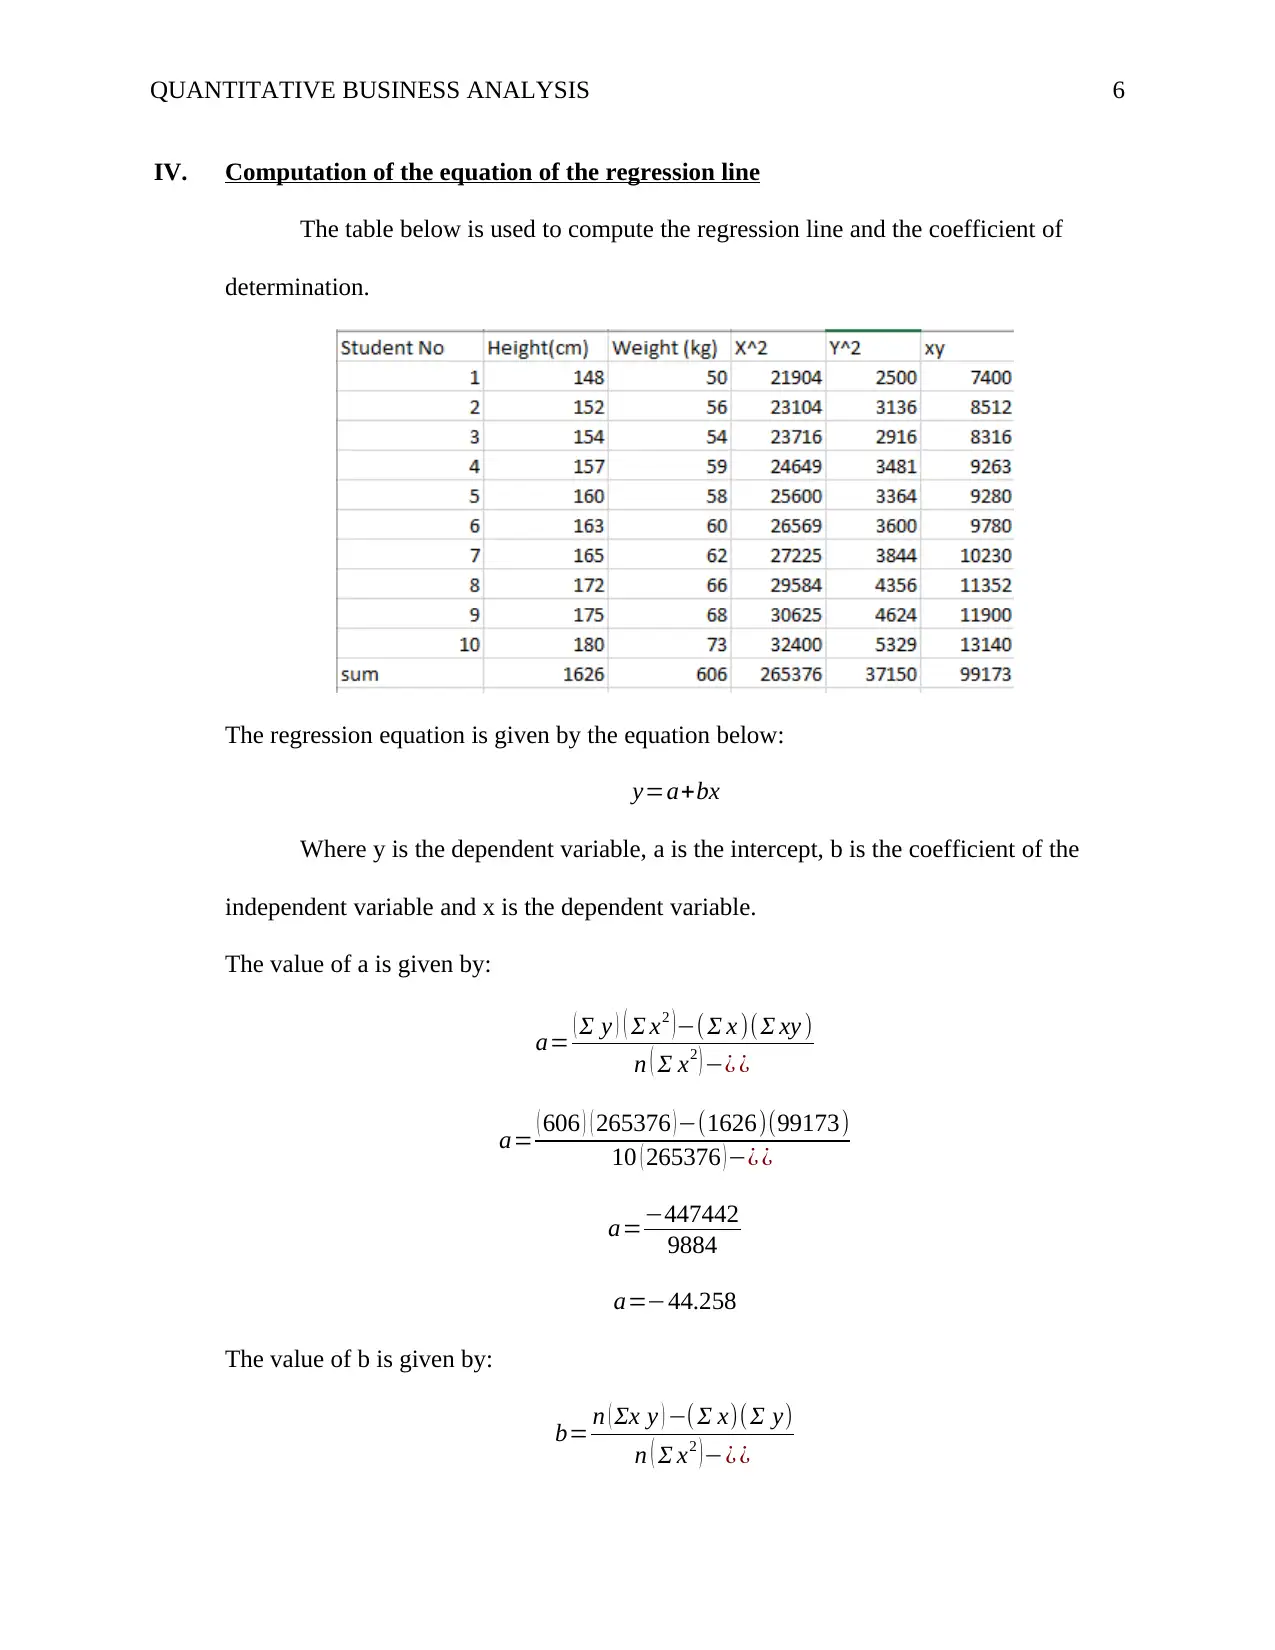
IV. Computation of the equation of the regression line
The table below is used to compute the regression line and the coefficient of
determination.
The regression equation is given by the equation below:
y=a+bx
Where y is the dependent variable, a is the intercept, b is the coefficient of the
independent variable and x is the dependent variable.
The value of a is given by:
a= ( Σ y ) ( Σ x2 )−( Σ x )(Σ xy )
n ( Σ x2 ) −¿ ¿
a= ( 606 ) ( 265376 )−(1626)(99173)
10 ( 265376 )−¿ ¿
a=−447442
9884
a=−44.258
The value of b is given by:
b= n ( Σx y ) −( Σ x)(Σ y)
n ( Σ x2 ) −¿ ¿
⊘ This is a preview!⊘
Do you want full access?
Subscribe today to unlock all pages.
Trusted by 1+ million students worldwide
QUANTITATIVE BUSINESS ANALYSIS 7
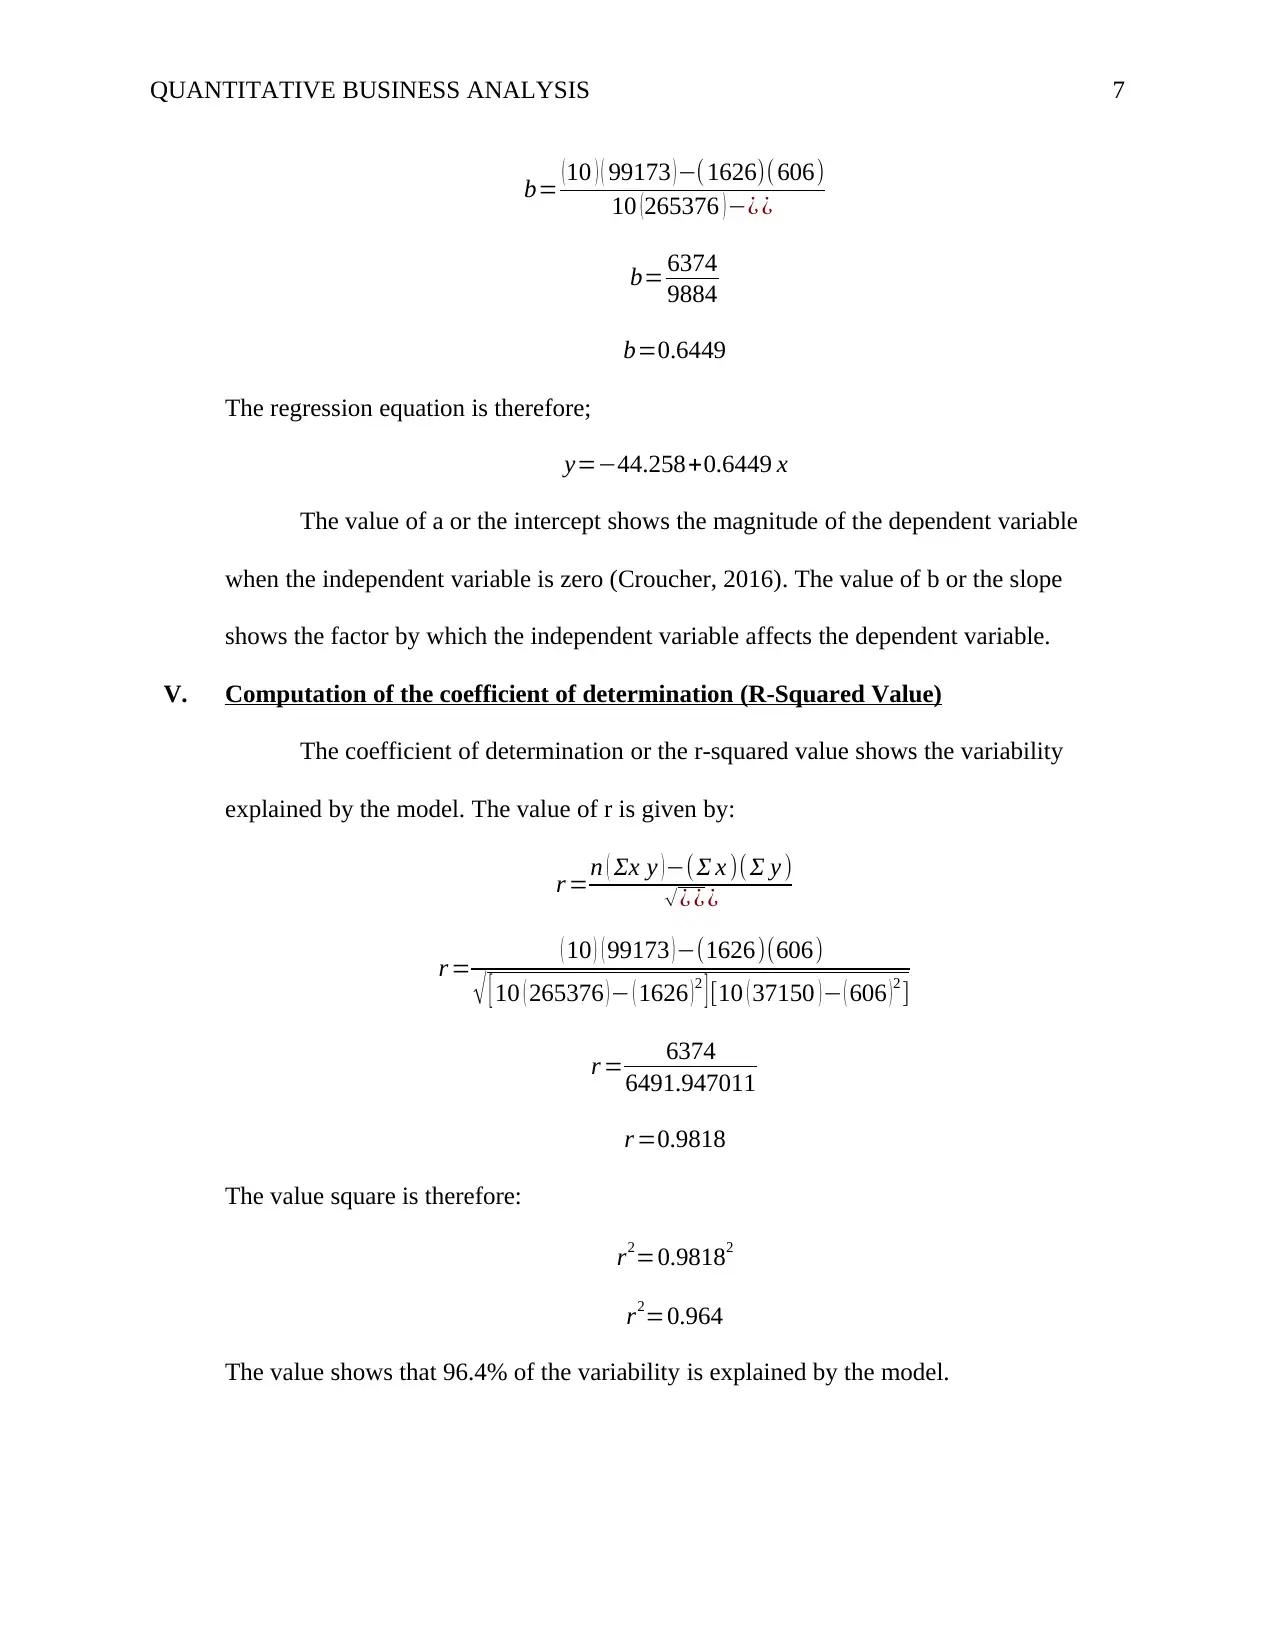
b= (10 ) ( 99173 )−( 1626)(606)
10 (265376 )−¿ ¿
b= 6374
9884
b=0.6449
The regression equation is therefore;
y=−44.258+0.6449 x
The value of a or the intercept shows the magnitude of the dependent variable
when the independent variable is zero (Croucher, 2016). The value of b or the slope
shows the factor by which the independent variable affects the dependent variable.
V. Computation of the coefficient of determination (R-Squared Value)
The coefficient of determination or the r-squared value shows the variability
explained by the model. The value of r is given by:
r =n ( Σx y )−(Σ x )(Σ y )
√¿ ¿ ¿
r = ( 10 ) ( 99173 )−(1626)(606)
√ [ 10 ( 265376 )− ( 1626 )2 ] [10 ( 37150 )− ( 606 )2 ]
r = 6374
6491.947011
r =0.9818
The value square is therefore:
r2=0.98182
r2=0.964
The value shows that 96.4% of the variability is explained by the model.
Paraphrase This Document
Need a fresh take? Get an instant paraphrase of this document with our AI Paraphraser
QUANTITATIVE BUSINESS ANALYSIS 8
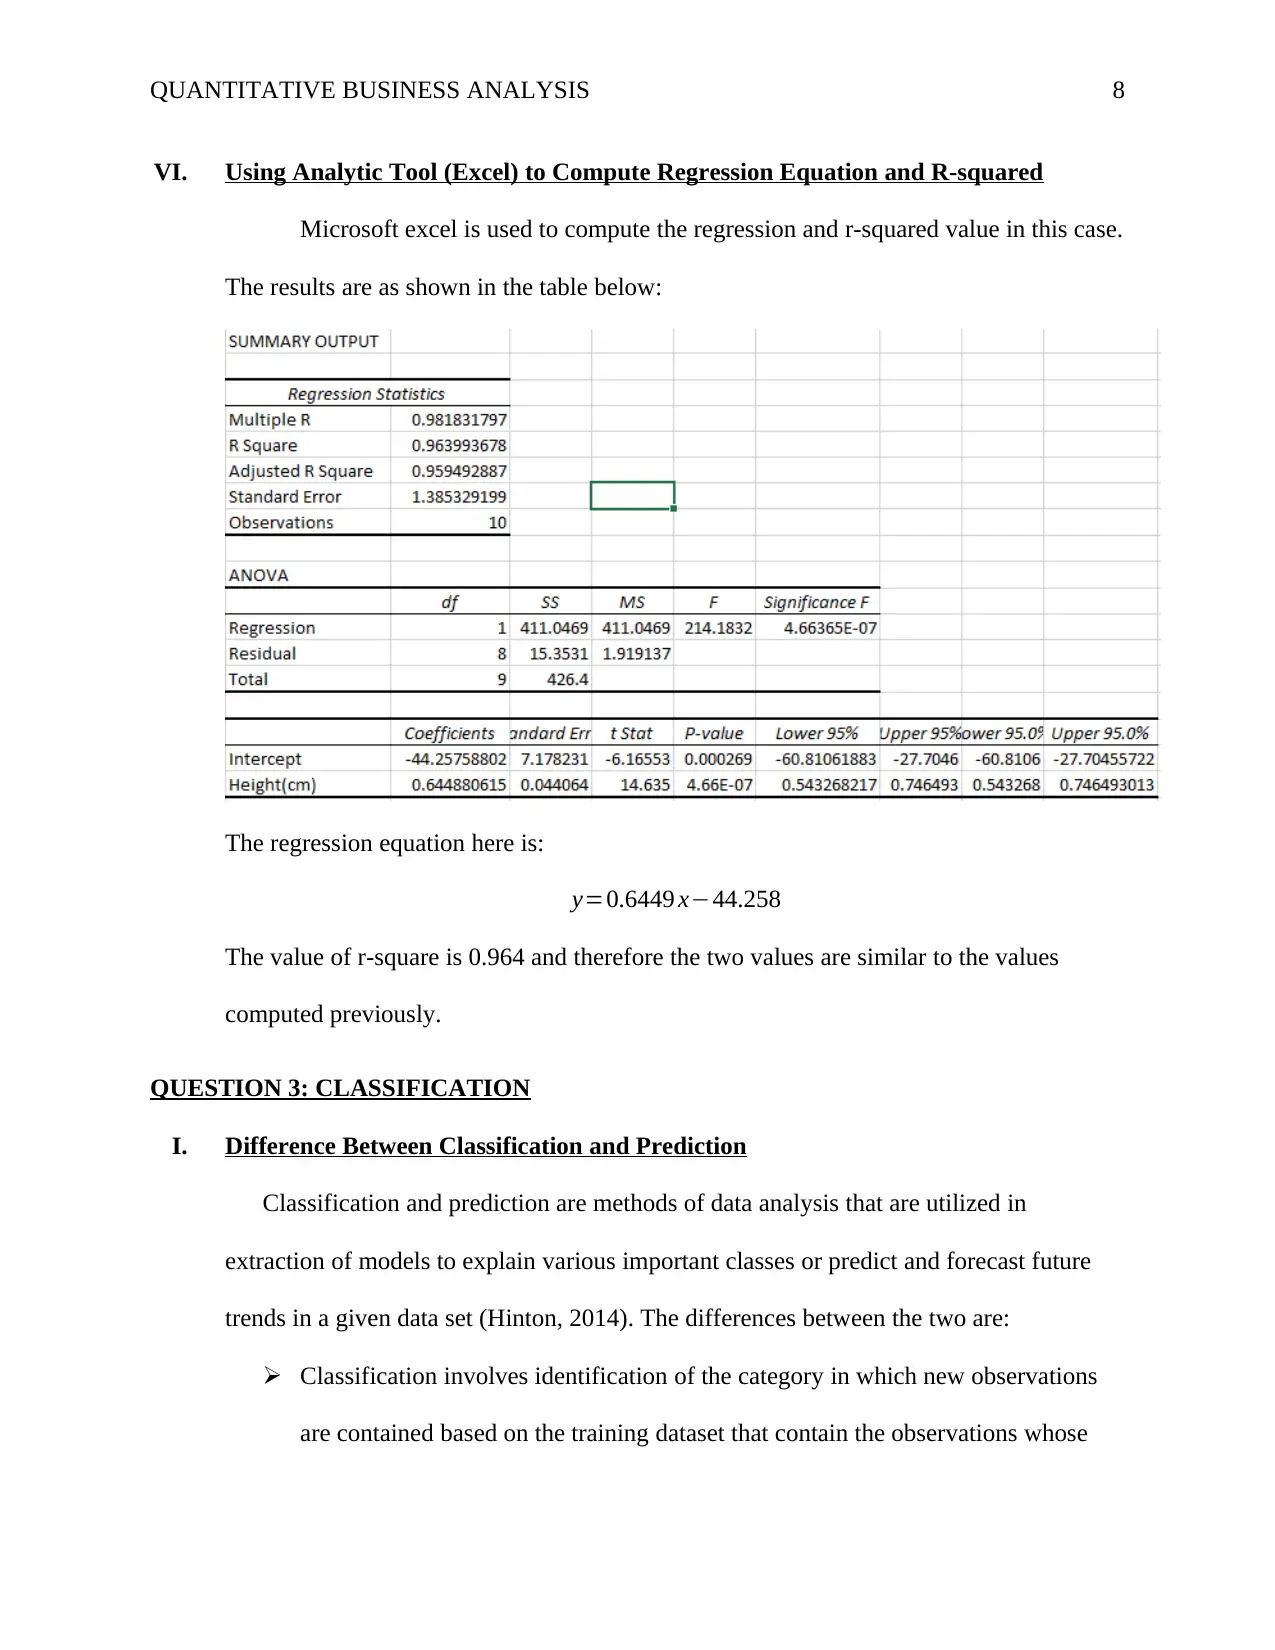
VI. Using Analytic Tool (Excel) to Compute Regression Equation and R-squared
Microsoft excel is used to compute the regression and r-squared value in this case.
The results are as shown in the table below:
The regression equation here is:
y=0.6449 x−44.258
The value of r-square is 0.964 and therefore the two values are similar to the values
computed previously.
QUESTION 3: CLASSIFICATION
I. Difference Between Classification and Prediction
Classification and prediction are methods of data analysis that are utilized in
extraction of models to explain various important classes or predict and forecast future
trends in a given data set (Hinton, 2014). The differences between the two are:
Classification involves identification of the category in which new observations
are contained based on the training dataset that contain the observations whose
QUANTITATIVE BUSINESS ANALYSIS 9
category is known while prediction involves determining the missing numerical
value for a new observation.
The classier or the model in classification is constructed with an aim of
determining categorical labels while in prediction, the model of the predictor is
constructed with the aim of predicting a continuous or ordered value.
The accuracy in classification is dependent of correctly determining the class
label while in prediction the accuracy is dependent on how good a predictor
guesses the predicated attribute value for a new dataset.
II. Methods of Classification
The various methods of classification are:
Decision Tree induction: This method involves studying of decision trees using
tuples that are class-labeled. The decision tree represents a flow chart that
resemble a tree structure with each non-leaf node representing a test performed on
an attribute, the branch representing the test outcome and the leaf or terminal node
representing a class label.
Bayesian Classification: Involves the use of statistical classifiers which have the
capability to predict probabilities of class memberships so that the probability of a
given tuple will be contained in a particular class.
Back propagation classification: This method of classification involves the use
of neural networks. The method involves step by step processing of training tuple
dataset iteratively and making a comparison of the network’s prediction for every
tuple with the approximately known set value.
⊘ This is a preview!⊘
Do you want full access?
Subscribe today to unlock all pages.
Trusted by 1+ million students worldwide
QUANTITATIVE BUSINESS ANALYSIS 10
Association Rule Analysis: The method is commonly used since frequently
occurring trends and their resulting associations rules represent significant
relationships for attributes and class labels.
Genetic Algorithms: This method of classification tries to utilize ideas obtained
from theories of natural evolution.
Fuzzy Set Approach Classification: This method of classification is rule based
and it involves sharp cutoffs for any given set of continuous attributes.
Rough Set Approach Classification: This method of classification is normally
utilized in the discovery of structural relationships within a very “dirty” or noisy
or imprecise data.
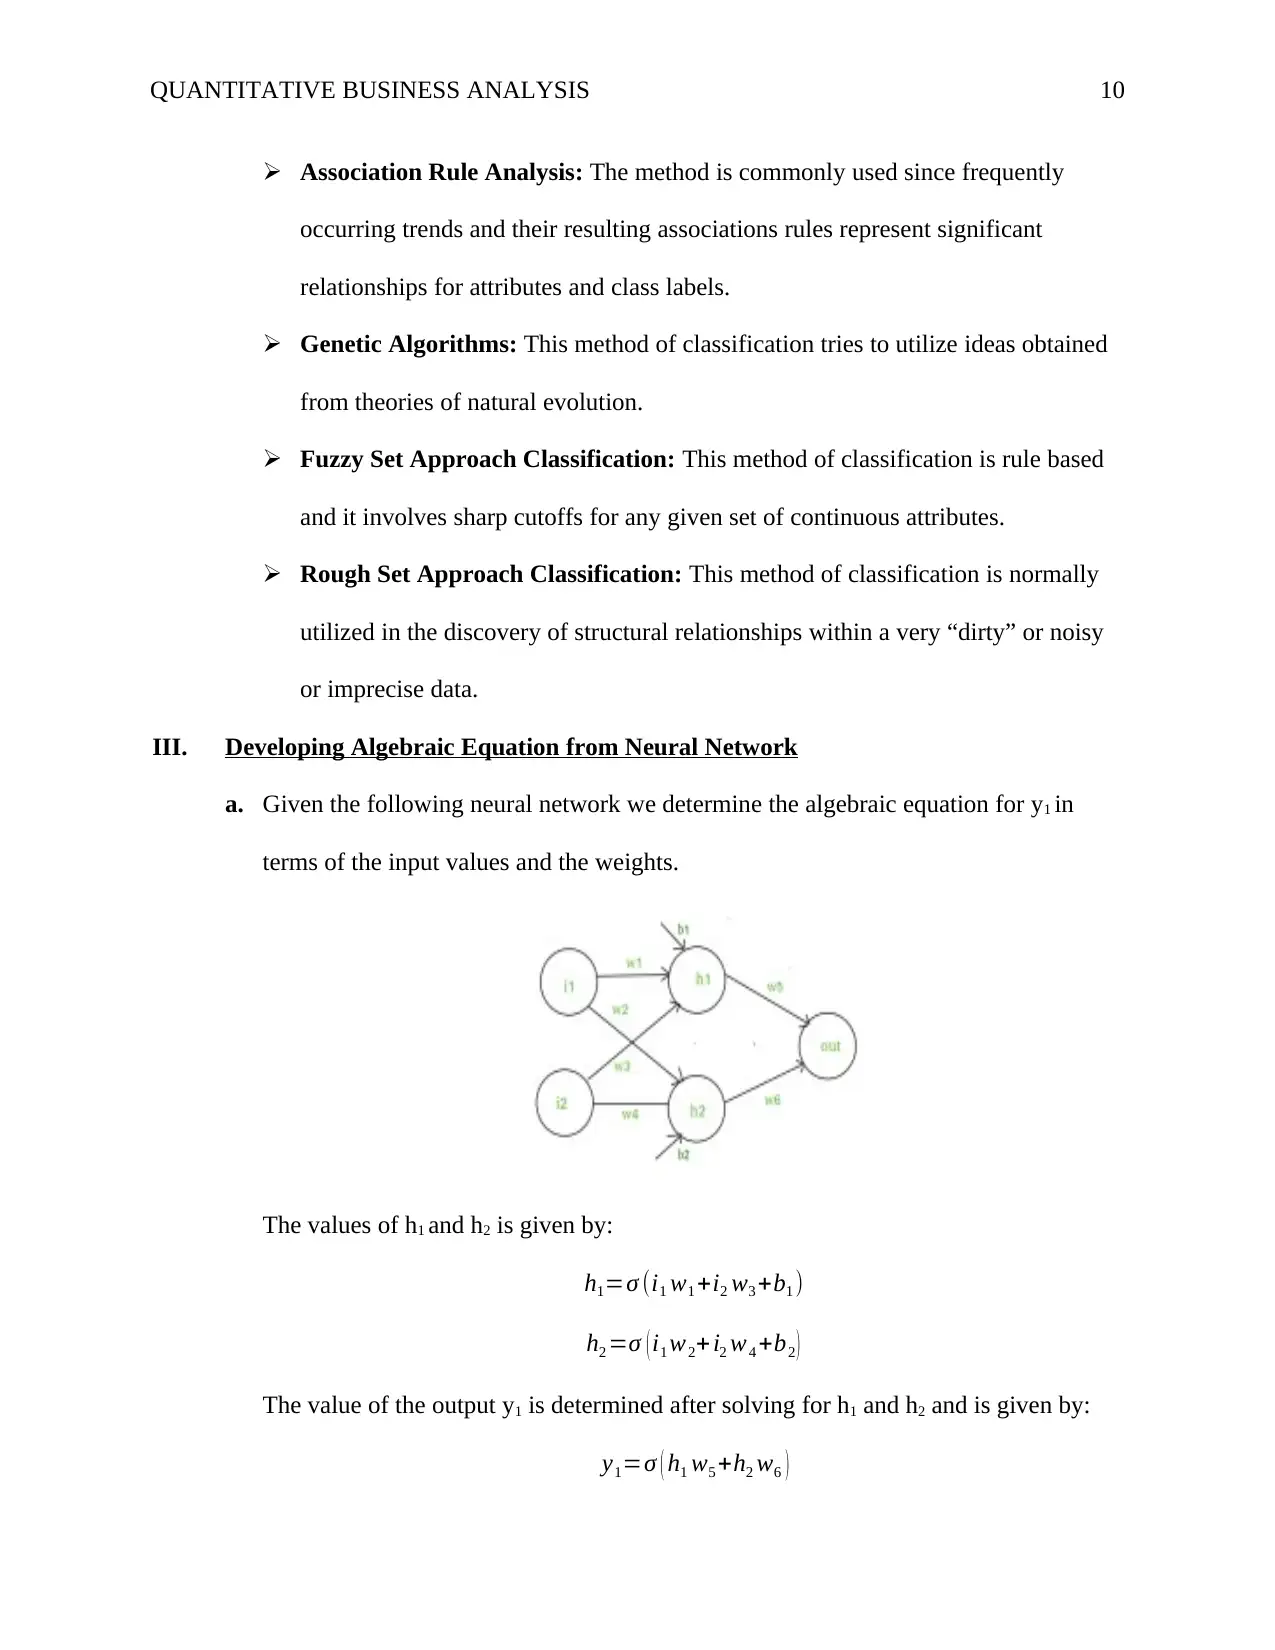
III. Developing Algebraic Equation from Neural Network
a. Given the following neural network we determine the algebraic equation for y1 in
terms of the input values and the weights.
The values of h1 and h2 is given by:
h1=σ (i1 w1 +i2 w3 +b1 )
h2 =σ ( i1 w2+ i2 w4 +b2 )
The value of the output y1 is determined after solving for h1 and h2 and is given by:
y1=σ ( h1 w5 +h2 w6 )
Association Rule Analysis: The method is commonly used since frequently
occurring trends and their resulting associations rules represent significant
relationships for attributes and class labels.
Genetic Algorithms: This method of classification tries to utilize ideas obtained
from theories of natural evolution.
Fuzzy Set Approach Classification: This method of classification is rule based
and it involves sharp cutoffs for any given set of continuous attributes.
Rough Set Approach Classification: This method of classification is normally
utilized in the discovery of structural relationships within a very “dirty” or noisy
or imprecise data.
III. Developing Algebraic Equation from Neural Network
a. Given the following neural network we determine the algebraic equation for y1 in
terms of the input values and the weights.
The values of h1 and h2 is given by:
h1=σ (i1 w1 +i2 w3 +b1 )
h2 =σ ( i1 w2+ i2 w4 +b2 )
The value of the output y1 is determined after solving for h1 and h2 and is given by:
y1=σ ( h1 w5 +h2 w6 )
Paraphrase This Document
Need a fresh take? Get an instant paraphrase of this document with our AI Paraphraser
QUANTITATIVE BUSINESS ANALYSIS 11
b. How Neural Networks are used in Classification
A neural network is a set of neurons. A neuron comprises of a set of inputs and
associated weights and a function that adds up the weights and later maps the results
to the output. The neurons are organized in different layers (Evans & Basu, 2013).
The layers are the input layer, the hidden layer and the output layer. The input layer
comprises the record values that are input to the other layer, usually the hidden layer.
The final layer or the output layer comprises a node of each and every class. A
forward single sweep through the network leads to assigning of a value to the output
node and a record being designated to the class node that has the highest value. The
neural networks determine a decision node when all the inputs are available, the
weights kept constant and time optimized for simplicity.
IV. How Clustering Can be Used in Business Analytics.
Clustering is technique used to identify and categorize objects or observations of
similar kind or possessing similar characteristics. In business analytics the technique is
commonly applied in segmentation (Freund, 2014). The following examples show where
clustering can be used in business analytics
Defect or Anomaly Detection: Clustering can be used determine fraudulent
activities or transaction in a business situation. In this case, the transactions can be
grouped into clusters containing accepted transactions to help determine the shape
of the distribution of this cluster. In a case a fraudulent transaction takes place it
will fall outside the “normal” cluster and thus will be treated as a suspect.
Segmentation of products: Products in a business enterprise can be clustered on
the basis of their physical characteristics such as weight, size, flavor, brand etc.
QUANTITATIVE BUSINESS ANALYSIS 12
This can help in pricing of the products as well as easy identification of the
products.
Segmentation of Customers and Stores: Customers with the same needs, taste
and preferences can be clustered together while at the same time stores of the
same size, sales quantity and customer base can be grouped together in one
cluster.
⊘ This is a preview!⊘
Do you want full access?
Subscribe today to unlock all pages.
Trusted by 1+ million students worldwide
1 out of 13
Related Documents


Your All-in-One AI-Powered Toolkit for Academic Success.
+13062052269
info@desklib.com
Available 24*7 on WhatsApp / Email
![[object Object]](/_next/static/media/star-bottom.7253800d.svg)
Unlock your academic potential
Copyright © 2020–2026 A2Z Services. All Rights Reserved. Developed and managed by ZUCOL.