Quantitative Analysis Report: SPSS Analysis of Infant Development Data
VerifiedAdded on 2022/12/30
|27
|3692
|60
Report
AI Summary
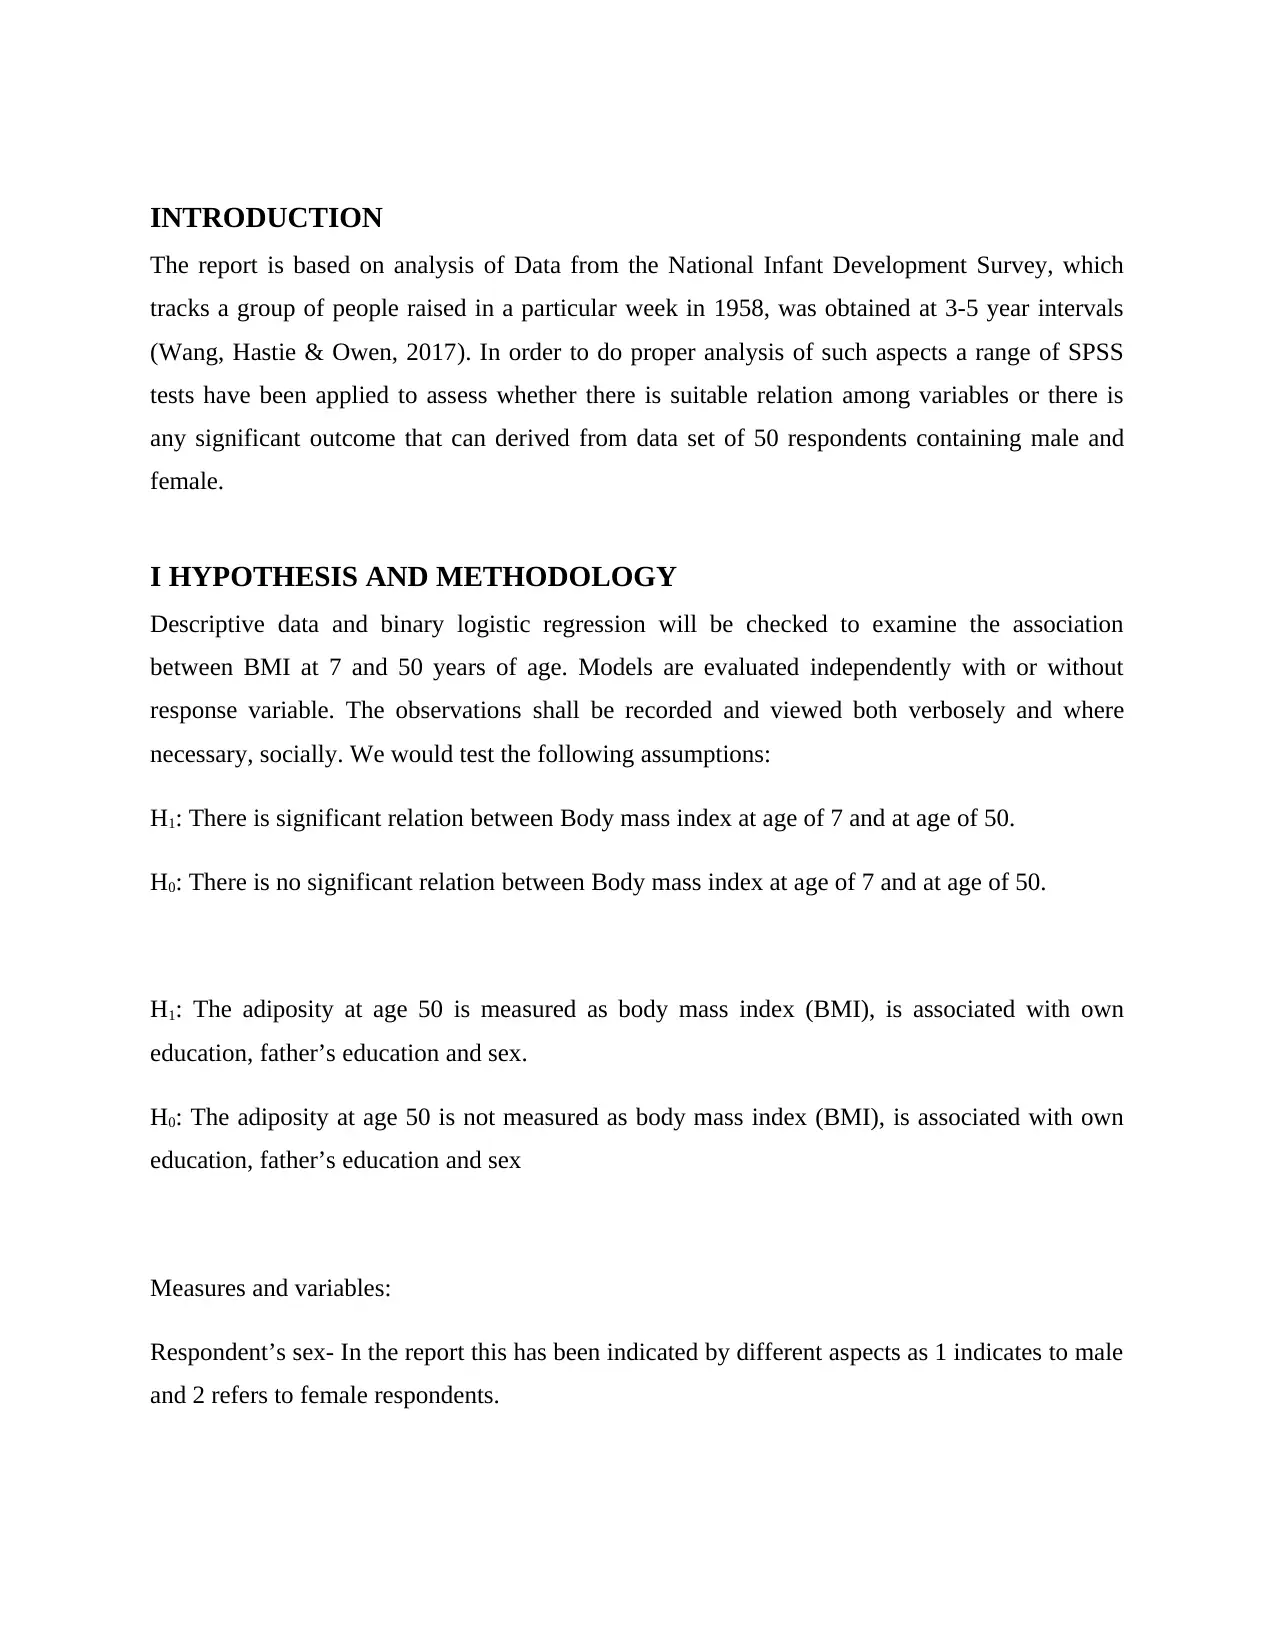
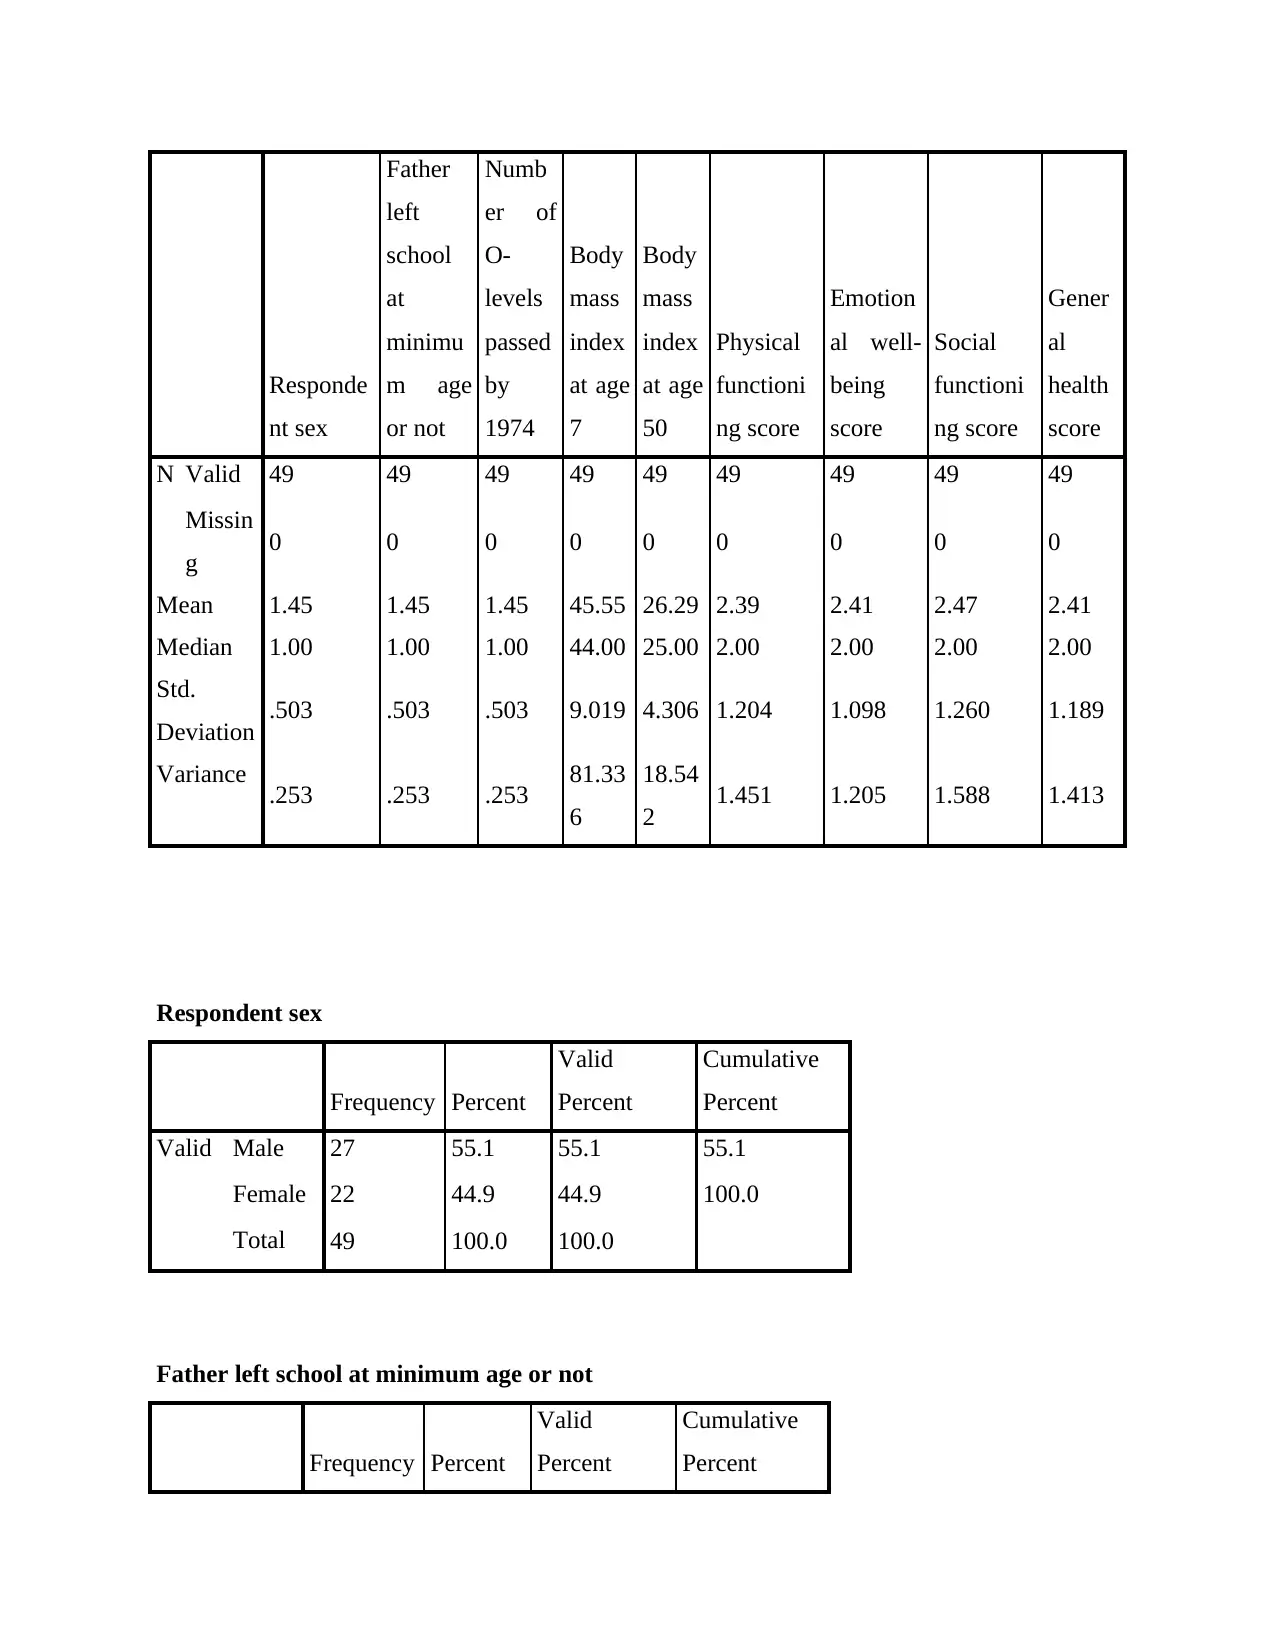
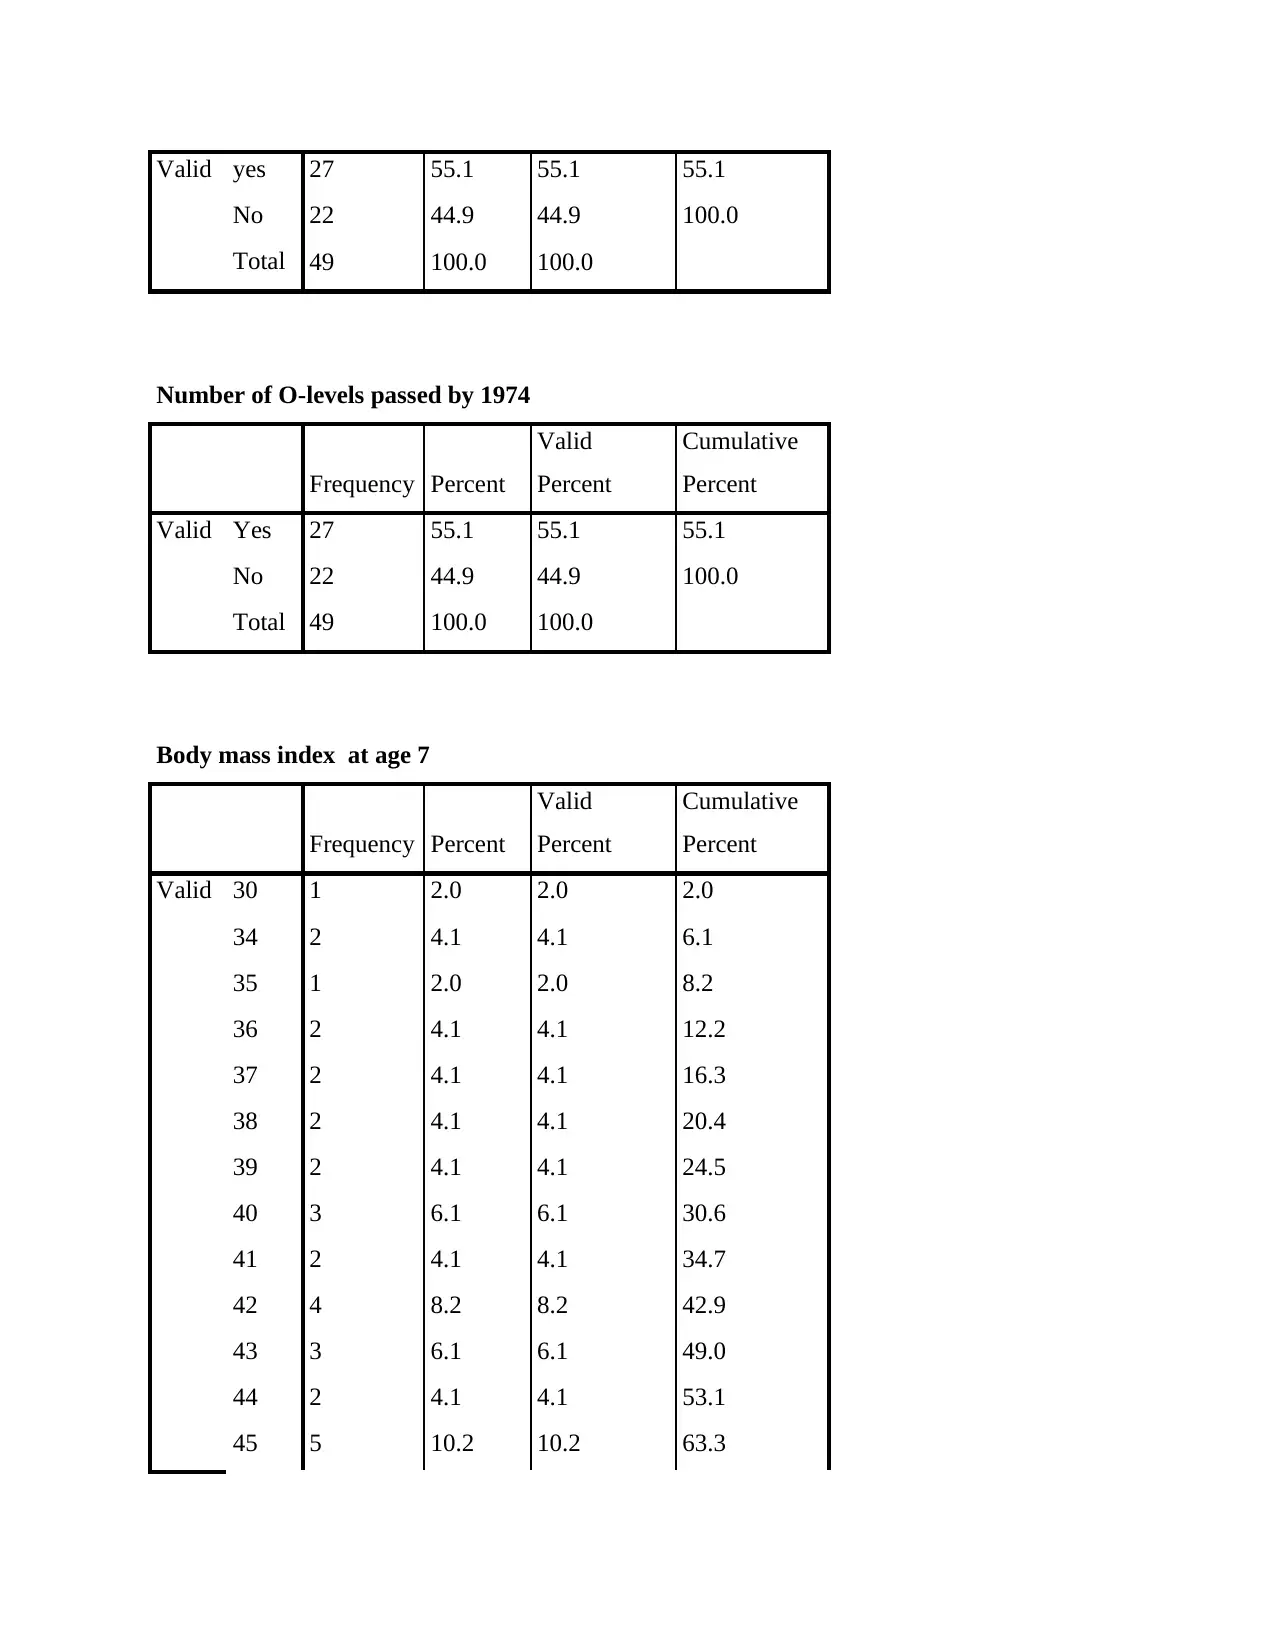
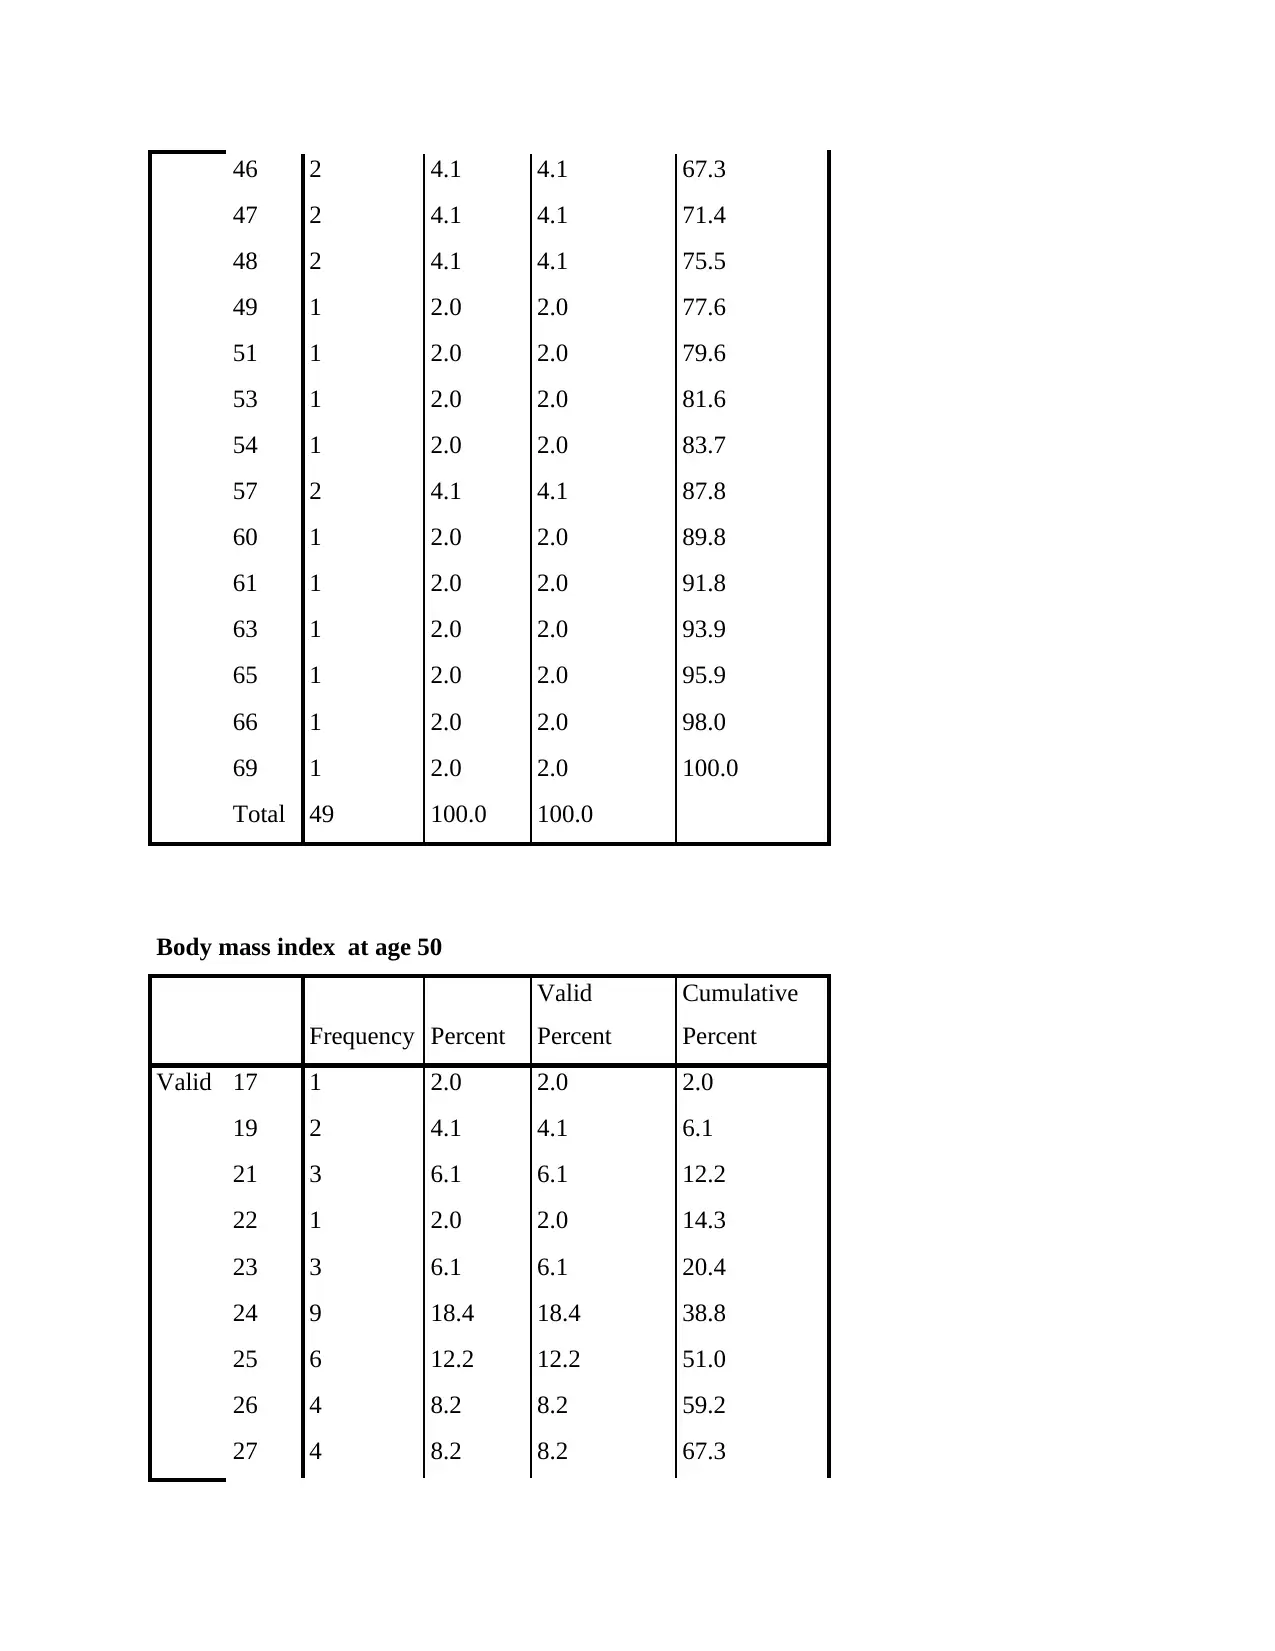
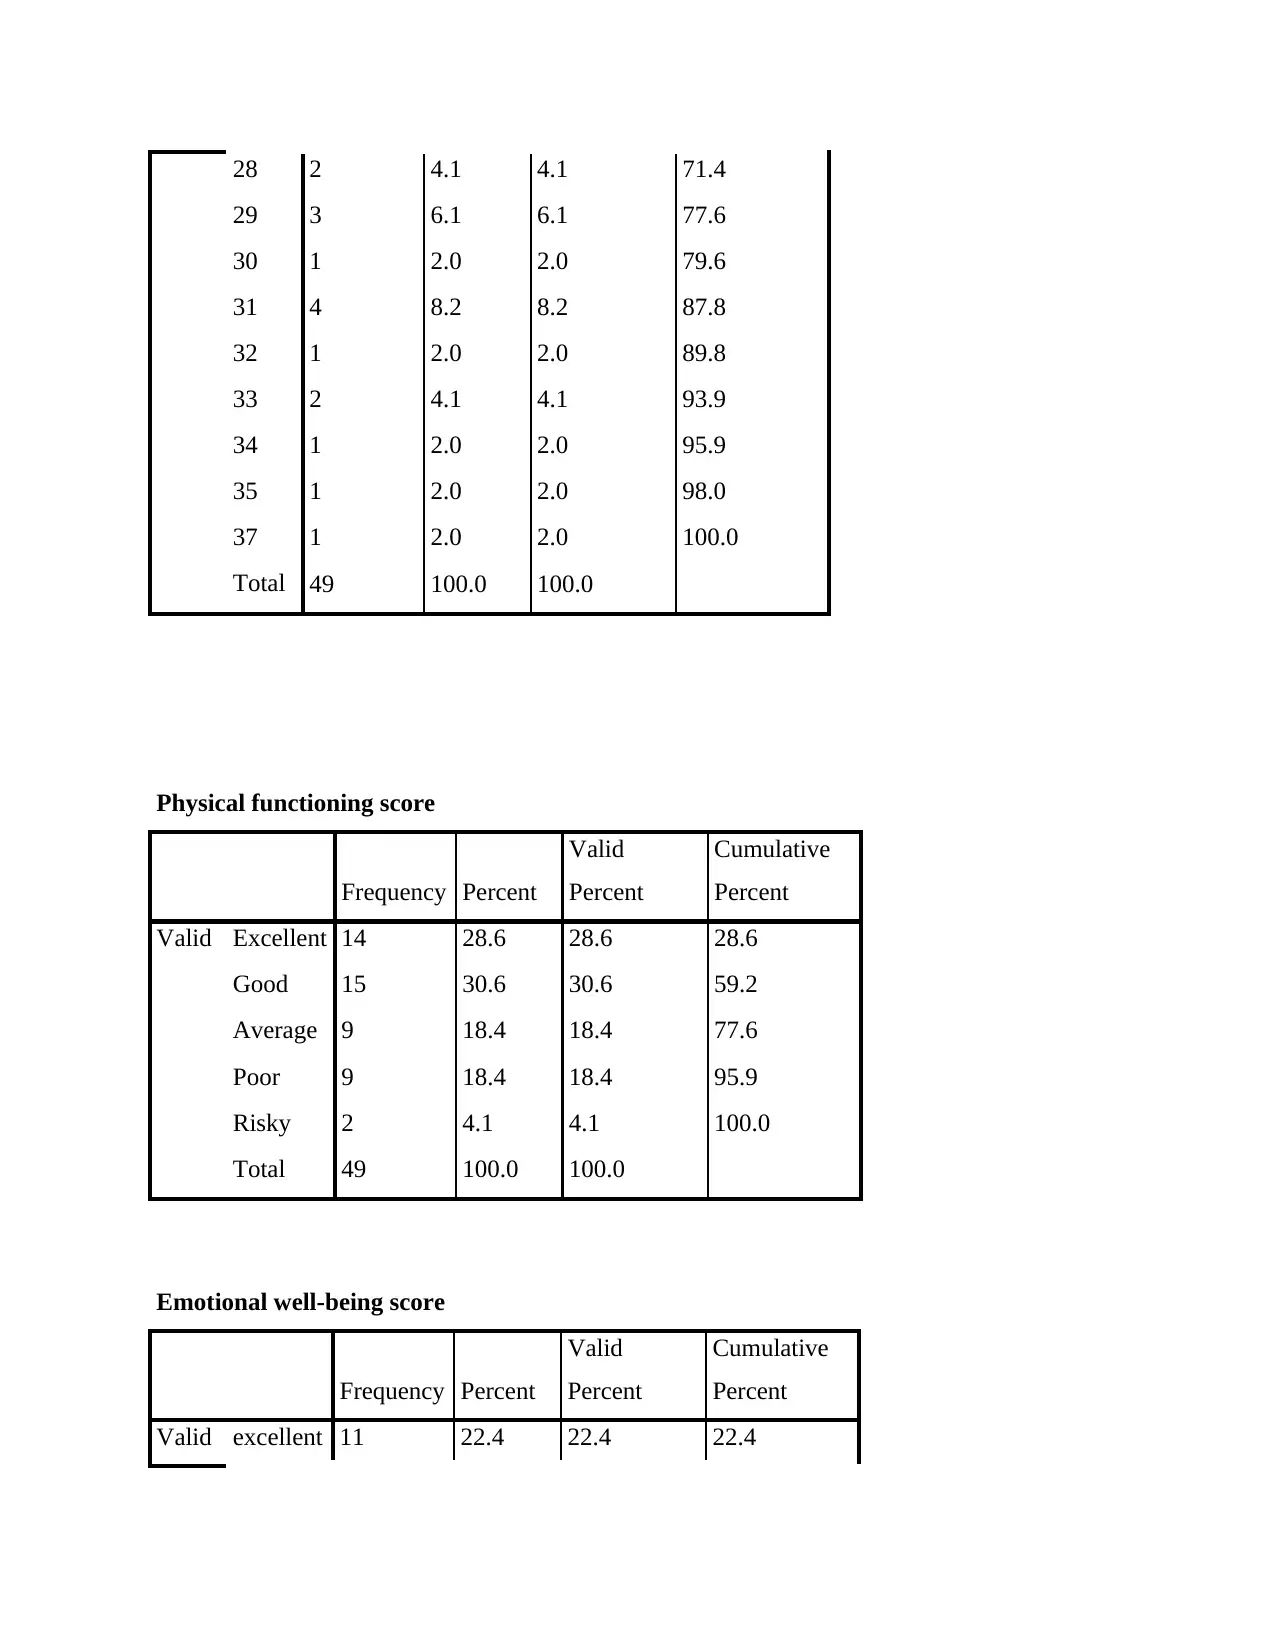
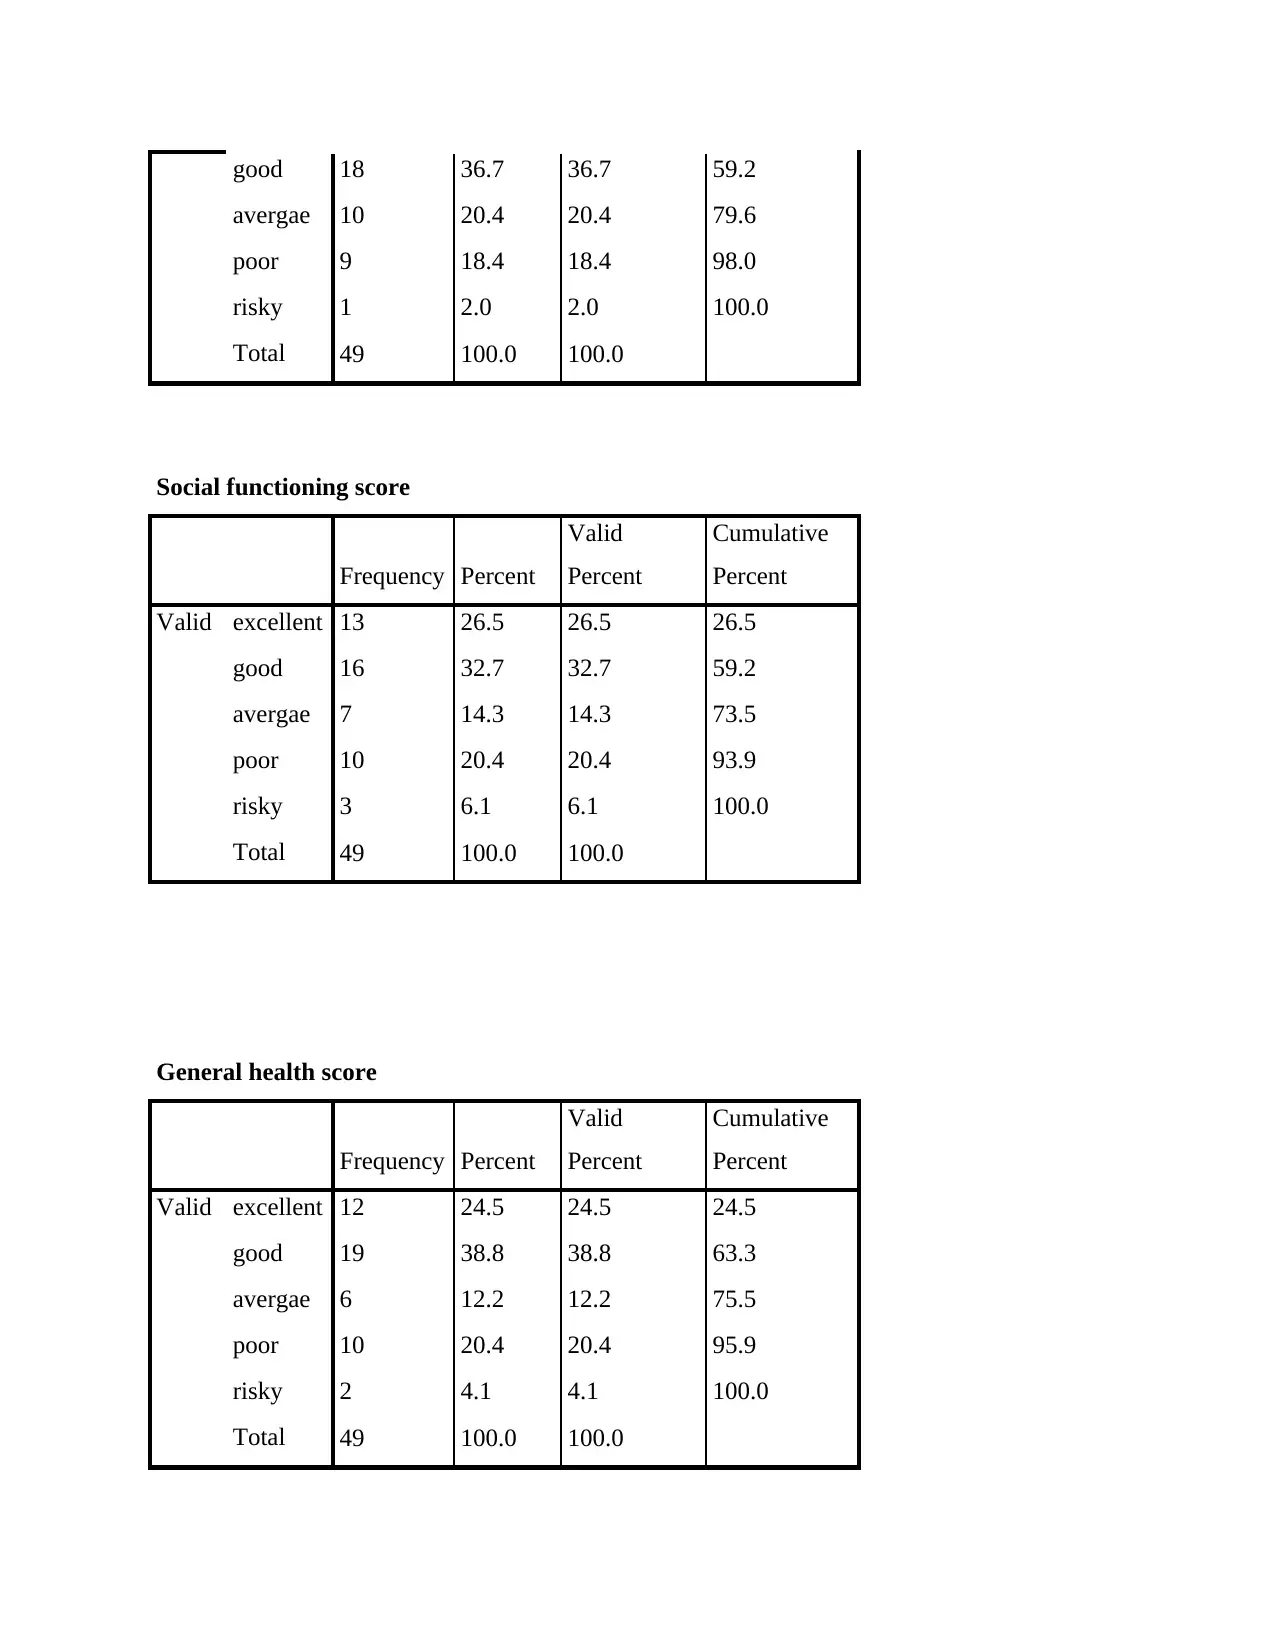
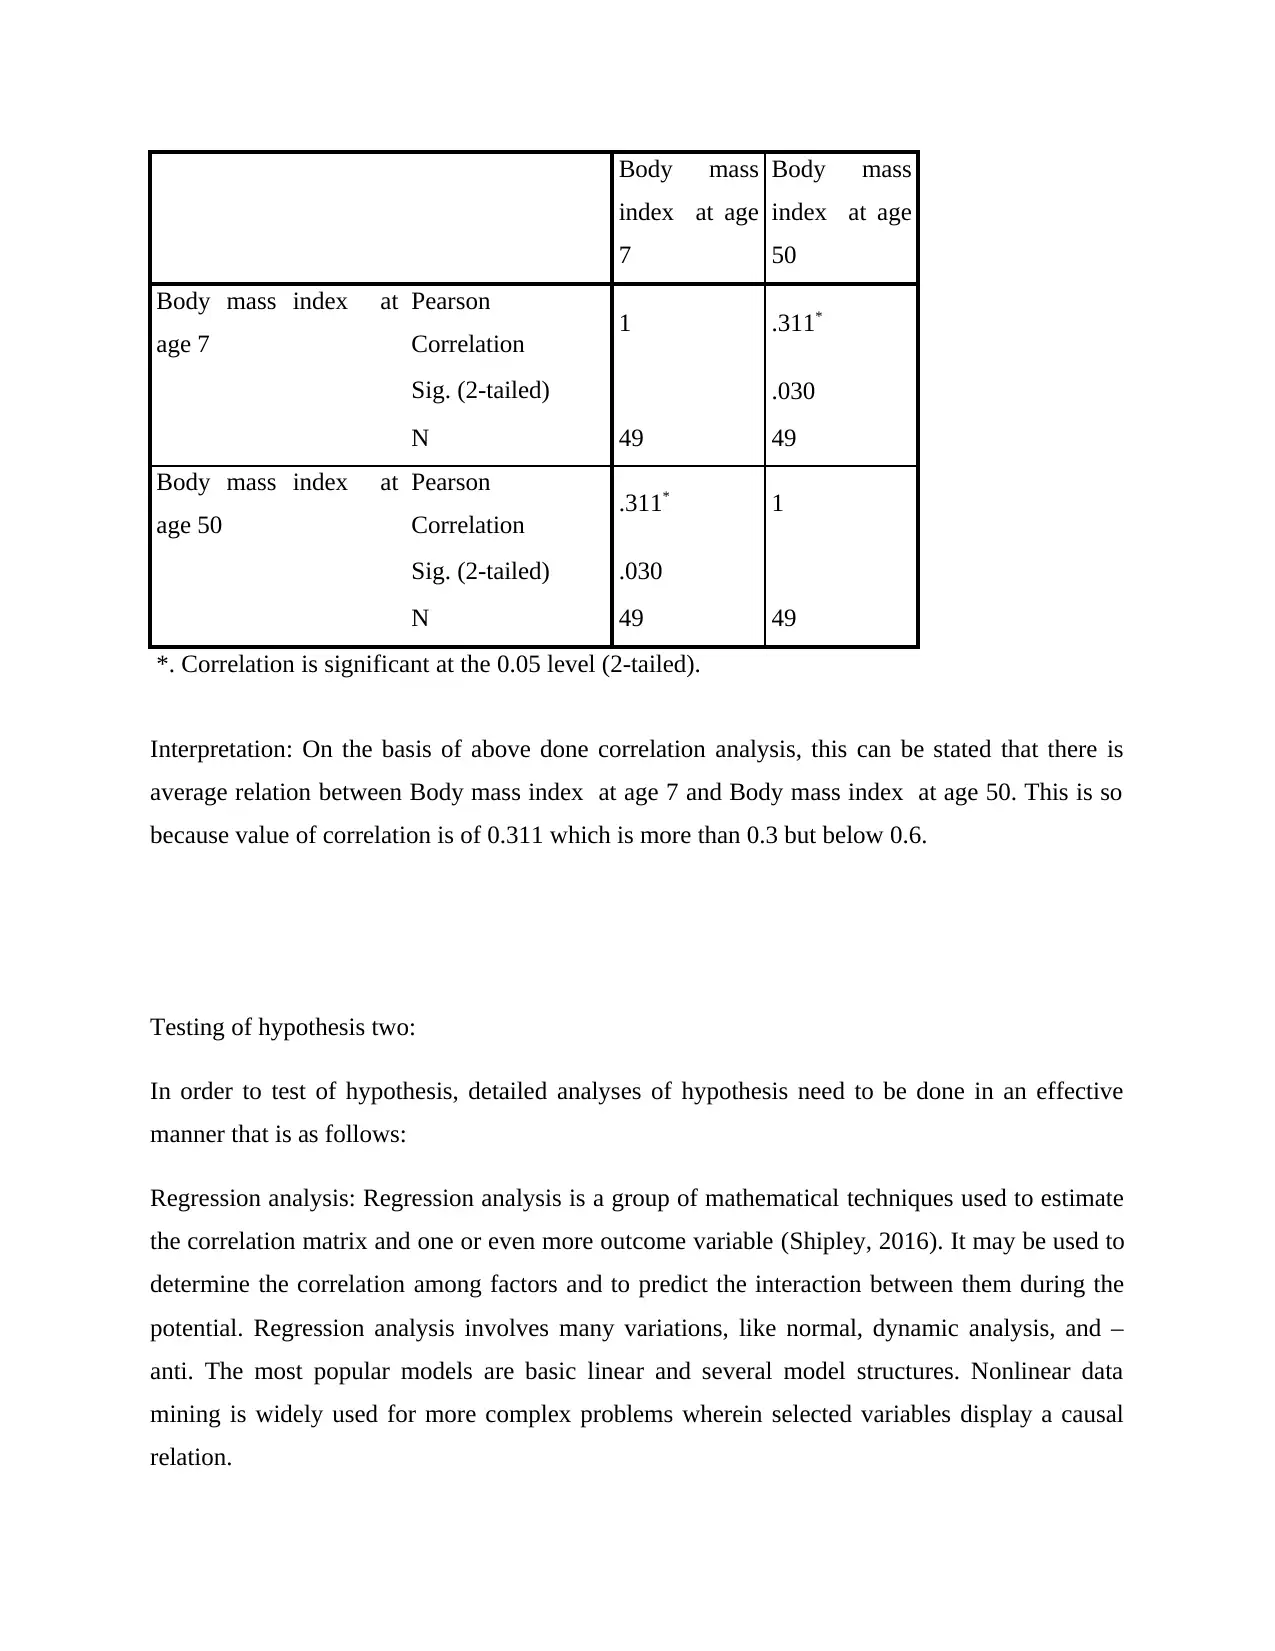
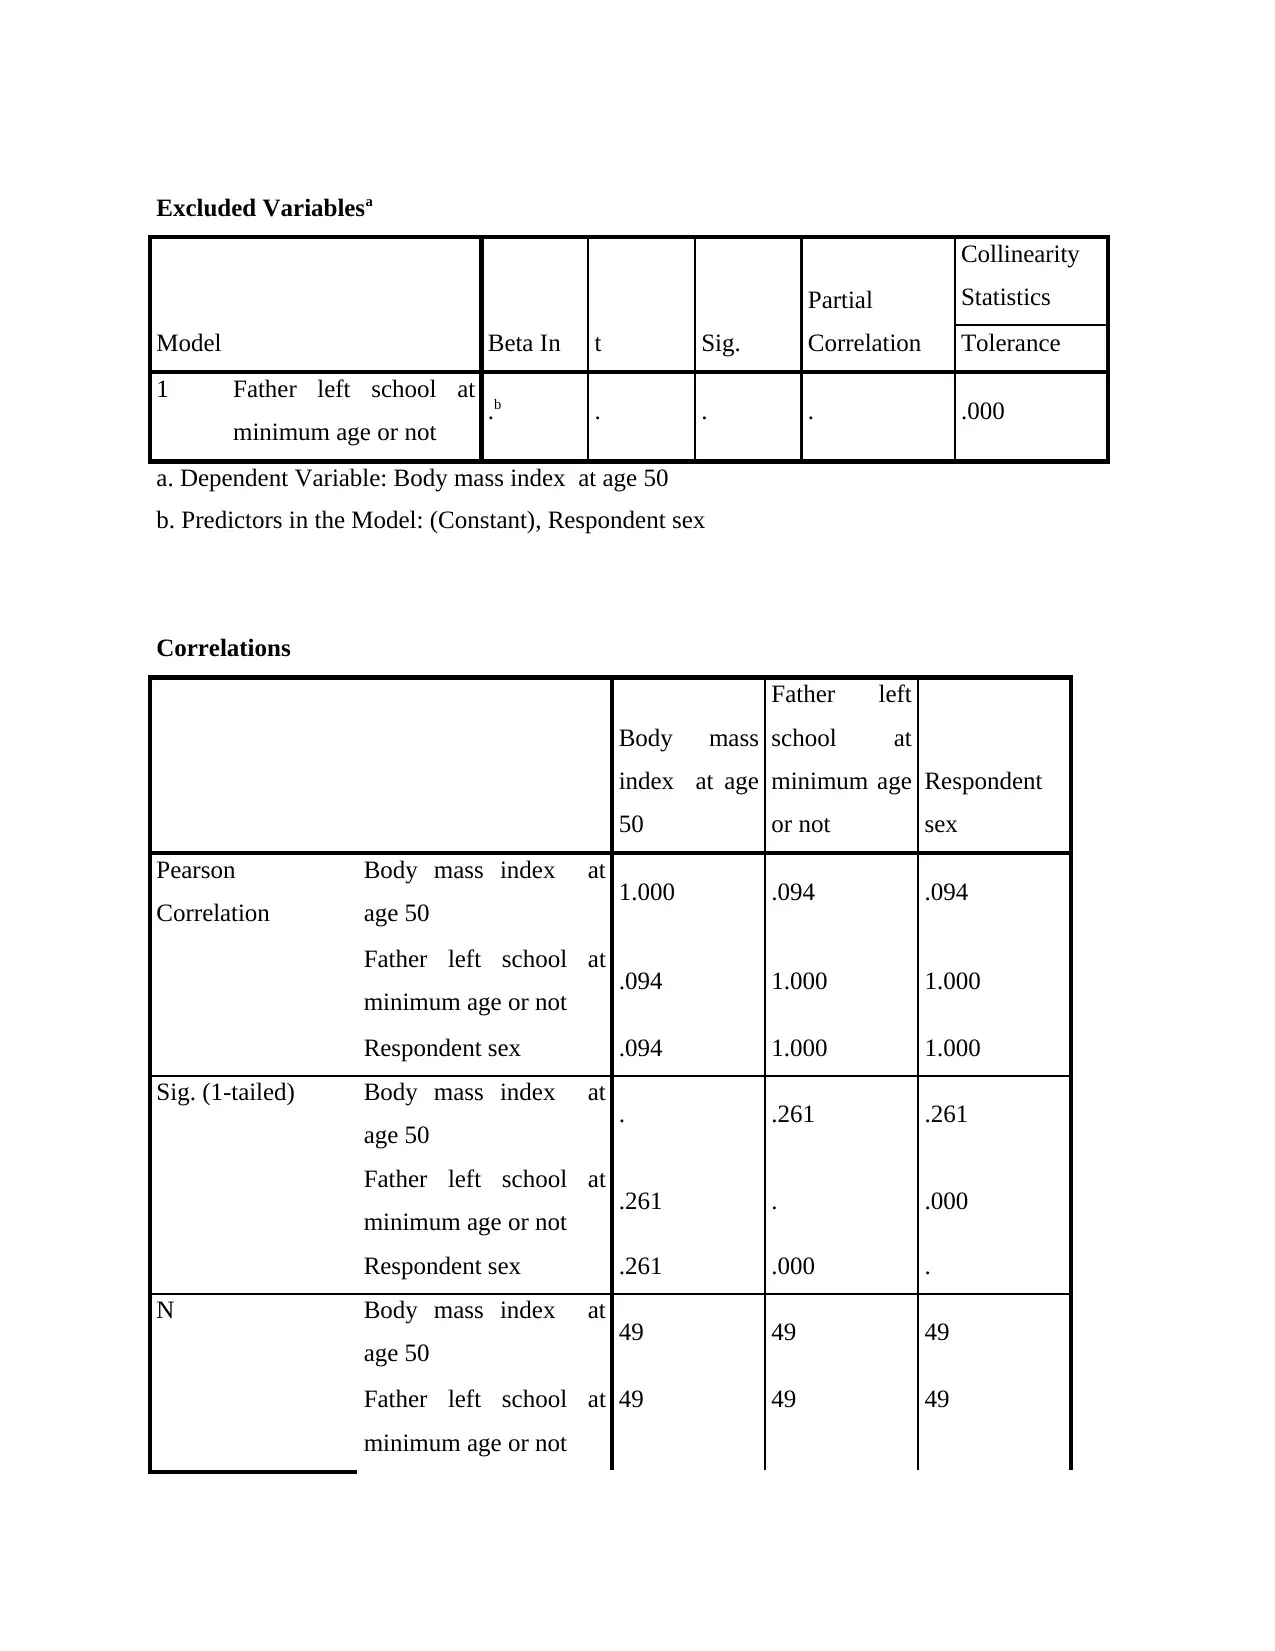
This report presents a quantitative analysis of data from the National Infant Development Survey, focusing on a cohort of individuals tracked since 1958. The analysis employs SPSS to examine relationships between variables such as Body Mass Index (BMI) at ages 7 and 50, respondent's sex, father's education, and O-level qualifications. The study tests two main hypotheses: the correlation between BMI at different ages and the association of adiposity at age 50 with education and sex. Preliminary statistical analysis includes descriptive statistics and frequency distributions. Correlation analysis reveals a moderate relationship between BMI at ages 7 and 50. Regression analysis is conducted to assess the influence of sex on BMI, with interpretations of the statistical significance. The report concludes that there is no significant relationship between body mass index and sex. The report includes statistical tables, correlation matrices, and regression outputs to support the findings.

Quantitative Data
Analysis Report
Analysis Report
Paraphrase This Document
Need a fresh take? Get an instant paraphrase of this document with our AI Paraphraser

Contents
INTRODUCTION.......................................................................................................................................3
I HYPOTHESIS AND METHODOLOGY.................................................................................................3
II. PRELIMINARY STATISTICAL ANALYSIS.......................................................................................4
III. REGRESSION ANALYSIS & INTERPRETATION..........................................................................10
CONCLUSION.........................................................................................................................................24
REFERENCES..........................................................................................................................................26
APPENDIX...............................................................................................................................................27

INTRODUCTION
The report is based on analysis of Data from the National Infant Development Survey, which
tracks a group of people raised in a particular week in 1958, was obtained at 3-5 year intervals
(Wang, Hastie & Owen, 2017). In order to do proper analysis of such aspects a range of SPSS
tests have been applied to assess whether there is suitable relation among variables or there is
any significant outcome that can derived from data set of 50 respondents containing male and
female.
I HYPOTHESIS AND METHODOLOGY
Descriptive data and binary logistic regression will be checked to examine the association
between BMI at 7 and 50 years of age. Models are evaluated independently with or without
response variable. The observations shall be recorded and viewed both verbosely and where
necessary, socially. We would test the following assumptions:
H1: There is significant relation between Body mass index at age of 7 and at age of 50.
H0: There is no significant relation between Body mass index at age of 7 and at age of 50.
H1: The adiposity at age 50 is measured as body mass index (BMI), is associated with own
education, father’s education and sex.
H0: The adiposity at age 50 is not measured as body mass index (BMI), is associated with own
education, father’s education and sex
Measures and variables:
Respondent’s sex- In the report this has been indicated by different aspects as 1 indicates to male
and 2 refers to female respondents.
⊘ This is a preview!⊘
Do you want full access?
Subscribe today to unlock all pages.

Trusted by 1+ million students worldwide

Father left school at minimum age or not- This has been presented by two variables which are
one and two. Herein, 1 refers to Father left school at minimum age and 2 refers to Father has not
left school at minimum age.
Number of O-levels passed by 1974- In order to do so, two variables are chosen which are one
and two. Herein one equals to O-levels passed by 1974 and 2 equals to O-levels not passed by
1974.
Physical functioning score- Herein, 1 refers to excellent, 2 refers to good, 3 refers to average, 4
relates to poor and 5 relates to risky.
Emotional well-being score- Herein, 1 refers to excellent, 2 refers to good, 3 refers to average, 4
relates to poor and 5 relates to risky.
Social functioning score- Herein, 1 refers to excellent, 2 refers to good, 3 refers to average, 4
relates to poor and 5 relates to risky.
Social functioning score- Herein, 1 refers to excellent, 2 refers to good, 3 refers to average, 4
relates to poor and 5 relates to risky.
II. PRELIMINARY STATISTICAL ANALYSIS
Statistics
Paraphrase This Document
Need a fresh take? Get an instant paraphrase of this document with our AI Paraphraser

Responde
nt sex
Father
left
school
at
minimu
m age
or not
Numb
er of
O-
levels
passed
by
1974
Body
mass
index
at age
7
Body
mass
index
at age
50
Physical
functioni
ng score
Emotion
al well-
being
score
Social
functioni
ng score
Gener
al
health
score
N Valid 49 49 49 49 49 49 49 49 49
Missin
g 0 0 0 0 0 0 0 0 0
Mean 1.45 1.45 1.45 45.55 26.29 2.39 2.41 2.47 2.41
Median 1.00 1.00 1.00 44.00 25.00 2.00 2.00 2.00 2.00
Std.
Deviation .503 .503 .503 9.019 4.306 1.204 1.098 1.260 1.189
Variance .253 .253 .253 81.33
6
18.54
2 1.451 1.205 1.588 1.413
Respondent sex
Frequency Percent
Valid
Percent
Cumulative
Percent
Valid Male 27 55.1 55.1 55.1
Female 22 44.9 44.9 100.0
Total 49 100.0 100.0
Father left school at minimum age or not
Frequency Percent
Valid
Percent
Cumulative
Percent

Valid yes 27 55.1 55.1 55.1
No 22 44.9 44.9 100.0
Total 49 100.0 100.0
Number of O-levels passed by 1974
Frequency Percent
Valid
Percent
Cumulative
Percent
Valid Yes 27 55.1 55.1 55.1
No 22 44.9 44.9 100.0
Total 49 100.0 100.0
Body mass index at age 7
Frequency Percent
Valid
Percent
Cumulative
Percent
Valid 30 1 2.0 2.0 2.0
34 2 4.1 4.1 6.1
35 1 2.0 2.0 8.2
36 2 4.1 4.1 12.2
37 2 4.1 4.1 16.3
38 2 4.1 4.1 20.4
39 2 4.1 4.1 24.5
40 3 6.1 6.1 30.6
41 2 4.1 4.1 34.7
42 4 8.2 8.2 42.9
43 3 6.1 6.1 49.0
44 2 4.1 4.1 53.1
45 5 10.2 10.2 63.3
No 22 44.9 44.9 100.0
Total 49 100.0 100.0
Number of O-levels passed by 1974
Frequency Percent
Valid
Percent
Cumulative
Percent
Valid Yes 27 55.1 55.1 55.1
No 22 44.9 44.9 100.0
Total 49 100.0 100.0
Body mass index at age 7
Frequency Percent
Valid
Percent
Cumulative
Percent
Valid 30 1 2.0 2.0 2.0
34 2 4.1 4.1 6.1
35 1 2.0 2.0 8.2
36 2 4.1 4.1 12.2
37 2 4.1 4.1 16.3
38 2 4.1 4.1 20.4
39 2 4.1 4.1 24.5
40 3 6.1 6.1 30.6
41 2 4.1 4.1 34.7
42 4 8.2 8.2 42.9
43 3 6.1 6.1 49.0
44 2 4.1 4.1 53.1
45 5 10.2 10.2 63.3
⊘ This is a preview!⊘
Do you want full access?
Subscribe today to unlock all pages.

Trusted by 1+ million students worldwide

46 2 4.1 4.1 67.3
47 2 4.1 4.1 71.4
48 2 4.1 4.1 75.5
49 1 2.0 2.0 77.6
51 1 2.0 2.0 79.6
53 1 2.0 2.0 81.6
54 1 2.0 2.0 83.7
57 2 4.1 4.1 87.8
60 1 2.0 2.0 89.8
61 1 2.0 2.0 91.8
63 1 2.0 2.0 93.9
65 1 2.0 2.0 95.9
66 1 2.0 2.0 98.0
69 1 2.0 2.0 100.0
Total 49 100.0 100.0
Body mass index at age 50
Frequency Percent
Valid
Percent
Cumulative
Percent
Valid 17 1 2.0 2.0 2.0
19 2 4.1 4.1 6.1
21 3 6.1 6.1 12.2
22 1 2.0 2.0 14.3
23 3 6.1 6.1 20.4
24 9 18.4 18.4 38.8
25 6 12.2 12.2 51.0
26 4 8.2 8.2 59.2
27 4 8.2 8.2 67.3
Paraphrase This Document
Need a fresh take? Get an instant paraphrase of this document with our AI Paraphraser

28 2 4.1 4.1 71.4
29 3 6.1 6.1 77.6
30 1 2.0 2.0 79.6
31 4 8.2 8.2 87.8
32 1 2.0 2.0 89.8
33 2 4.1 4.1 93.9
34 1 2.0 2.0 95.9
35 1 2.0 2.0 98.0
37 1 2.0 2.0 100.0
Total 49 100.0 100.0
Physical functioning score
Frequency Percent
Valid
Percent
Cumulative
Percent
Valid Excellent 14 28.6 28.6 28.6
Good 15 30.6 30.6 59.2
Average 9 18.4 18.4 77.6
Poor 9 18.4 18.4 95.9
Risky 2 4.1 4.1 100.0
Total 49 100.0 100.0
Emotional well-being score
Frequency Percent
Valid
Percent
Cumulative
Percent
Valid excellent 11 22.4 22.4 22.4

good 18 36.7 36.7 59.2
avergae 10 20.4 20.4 79.6
poor 9 18.4 18.4 98.0
risky 1 2.0 2.0 100.0
Total 49 100.0 100.0
Social functioning score
Frequency Percent
Valid
Percent
Cumulative
Percent
Valid excellent 13 26.5 26.5 26.5
good 16 32.7 32.7 59.2
avergae 7 14.3 14.3 73.5
poor 10 20.4 20.4 93.9
risky 3 6.1 6.1 100.0
Total 49 100.0 100.0
General health score
Frequency Percent
Valid
Percent
Cumulative
Percent
Valid excellent 12 24.5 24.5 24.5
good 19 38.8 38.8 63.3
avergae 6 12.2 12.2 75.5
poor 10 20.4 20.4 95.9
risky 2 4.1 4.1 100.0
Total 49 100.0 100.0
⊘ This is a preview!⊘
Do you want full access?
Subscribe today to unlock all pages.

Trusted by 1+ million students worldwide

Analysis- The above done tables shows that the value of mean and standard deviation among
each aspect is not close to each other. As a result, this can be stated that there is no relation
among data set of 50 respondents. Apart from this, the mean value of Body mass index at age 7
has higher mean value as compared to Body mass index at age 50. This shows that at age of 7
people’s health was quite better and there was significant balance between weight and height.
III. REGRESSION ANALYSIS & INTERPRETATION
In order to test above mentioned hypothesis, a range of SPSS tests have applied in an effective
manner which are as follows:
Testing of hypothesis one:
H1: There is significant relation between Body mass index at age of 7 and at age of 50.
H0: There is no significant relation between Body mass index at age of 7 and at age of 50.
In order to such hypothesis, correlation analysis is crucial which is performed below in such
manner:
Correlation- Correlation is used to assess the association between measurable variables or
predictor data. In other terms, it's a test of how objects contribute to each other (Wagenmakers,
Verhagen & Ly, 2016). A research of how factors are associated is called a relationship analysis.
Correlations are helpful and if you can figure out what pattern of social you are that you can
make projections of future actions. Knowing what the future brings is very relevant in social
sciences such as governance and universal healthcare. Business owners also use these figures for
their expenditures and business strategies.
Correlations
Paraphrase This Document
Need a fresh take? Get an instant paraphrase of this document with our AI Paraphraser

Body mass
index at age
7
Body mass
index at age
50
Body mass index at
age 7
Pearson
Correlation 1 .311*
Sig. (2-tailed) .030
N 49 49
Body mass index at
age 50
Pearson
Correlation .311* 1
Sig. (2-tailed) .030
N 49 49
*. Correlation is significant at the 0.05 level (2-tailed).
Interpretation: On the basis of above done correlation analysis, this can be stated that there is
average relation between Body mass index at age 7 and Body mass index at age 50. This is so
because value of correlation is of 0.311 which is more than 0.3 but below 0.6.
Testing of hypothesis two:
In order to test of hypothesis, detailed analyses of hypothesis need to be done in an effective
manner that is as follows:
Regression analysis: Regression analysis is a group of mathematical techniques used to estimate
the correlation matrix and one or even more outcome variable (Shipley, 2016). It may be used to
determine the correlation among factors and to predict the interaction between them during the
potential. Regression analysis involves many variations, like normal, dynamic analysis, and –
anti. The most popular models are basic linear and several model structures. Nonlinear data
mining is widely used for more complex problems wherein selected variables display a causal
relation.
index at age
7
Body mass
index at age
50
Body mass index at
age 7
Pearson
Correlation 1 .311*
Sig. (2-tailed) .030
N 49 49
Body mass index at
age 50
Pearson
Correlation .311* 1
Sig. (2-tailed) .030
N 49 49
*. Correlation is significant at the 0.05 level (2-tailed).
Interpretation: On the basis of above done correlation analysis, this can be stated that there is
average relation between Body mass index at age 7 and Body mass index at age 50. This is so
because value of correlation is of 0.311 which is more than 0.3 but below 0.6.
Testing of hypothesis two:
In order to test of hypothesis, detailed analyses of hypothesis need to be done in an effective
manner that is as follows:
Regression analysis: Regression analysis is a group of mathematical techniques used to estimate
the correlation matrix and one or even more outcome variable (Shipley, 2016). It may be used to
determine the correlation among factors and to predict the interaction between them during the
potential. Regression analysis involves many variations, like normal, dynamic analysis, and –
anti. The most popular models are basic linear and several model structures. Nonlinear data
mining is widely used for more complex problems wherein selected variables display a causal
relation.

Excluded Variablesa
Model Beta In t Sig.
Partial
Correlation
Collinearity
Statistics
Tolerance
1 Father left school at
minimum age or not .b . . . .000
a. Dependent Variable: Body mass index at age 50
b. Predictors in the Model: (Constant), Respondent sex
Correlations
Body mass
index at age
50
Father left
school at
minimum age
or not
Respondent
sex
Pearson
Correlation
Body mass index at
age 50 1.000 .094 .094
Father left school at
minimum age or not .094 1.000 1.000
Respondent sex .094 1.000 1.000
Sig. (1-tailed) Body mass index at
age 50 . .261 .261
Father left school at
minimum age or not .261 . .000
Respondent sex .261 .000 .
N Body mass index at
age 50 49 49 49
Father left school at
minimum age or not
49 49 49
⊘ This is a preview!⊘
Do you want full access?
Subscribe today to unlock all pages.

Trusted by 1+ million students worldwide
1 out of 27
Your All-in-One AI-Powered Toolkit for Academic Success.
+13062052269
info@desklib.com
Available 24*7 on WhatsApp / Email
Unlock your academic potential
Copyright © 2020–2025 A2Z Services. All Rights Reserved. Developed and managed by ZUCOL.

