Developing Strong Knowledge of Statistical Tools
23 Pages4103 Words26 Views
Added on 2023-01-19
About This Document
This research study focuses on developing strong knowledge of statistical tools such as regression analysis and CI calculation. It emphasizes the importance of data quality and the selection of the right tool for data analysis. The report also discusses common issues faced in applying statistical methods.
Developing Strong Knowledge of Statistical Tools
Added on 2023-01-19
ShareRelated Documents
QUANTITATIVE FINANCE & FINANCIAL
MARKETS
MARKETS

EXECUTIVE SUMMARY
Present research study is conducted in respect to developing strong knowledge of
statistical tools. In the report, regression analysis and CI calculation is done. It is identified that
data quality is the one of the common point where emphasis must be given so that accurate
results can be obtained. Apart from this, due importance must be given on selection of right tool
for data analysis. Common issues faced in respect to application of statistical methods is also
explained in detail in the report. In this way entire research work is carried out

TABLE OF CONTENTS
INTRODUCTION...........................................................................................................................1
Question 1........................................................................................................................................1
(a)Regression equation................................................................................................................1
(b) Correlation between variables...............................................................................................2
© Most under-priced and overpriced car by residuals................................................................2
Question 2........................................................................................................................................3
(a)Line chart for three sets of data..............................................................................................3
(b) Descriptive statistics..............................................................................................................3
© Interpretation of data...............................................................................................................4
(d) Moving average and charts plotting......................................................................................5
( e) Histogram.............................................................................................................................7
(f) Normal distribution................................................................................................................8
Question 3........................................................................................................................................9
Identification of difference between A and B, B and C..............................................................9
Question 4......................................................................................................................................10
(a)Calculating confidence interval............................................................................................10
(b) Z test....................................................................................................................................11
© Performance of test...............................................................................................................11
Question 5......................................................................................................................................11
Question 6......................................................................................................................................13
(a)..............................................................................................................................................13
(b)..............................................................................................................................................14
Question 7......................................................................................................................................14
CONCLUSION..............................................................................................................................16
REFERENCES..........................................................................................................................................17
Table 1Regression analysis..............................................................................................................1
Table 2Descriptive statistics............................................................................................................3
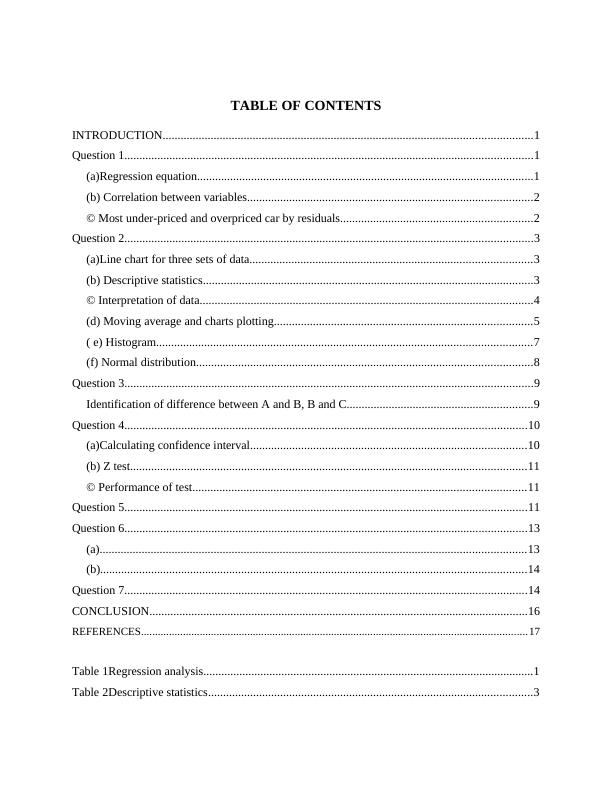
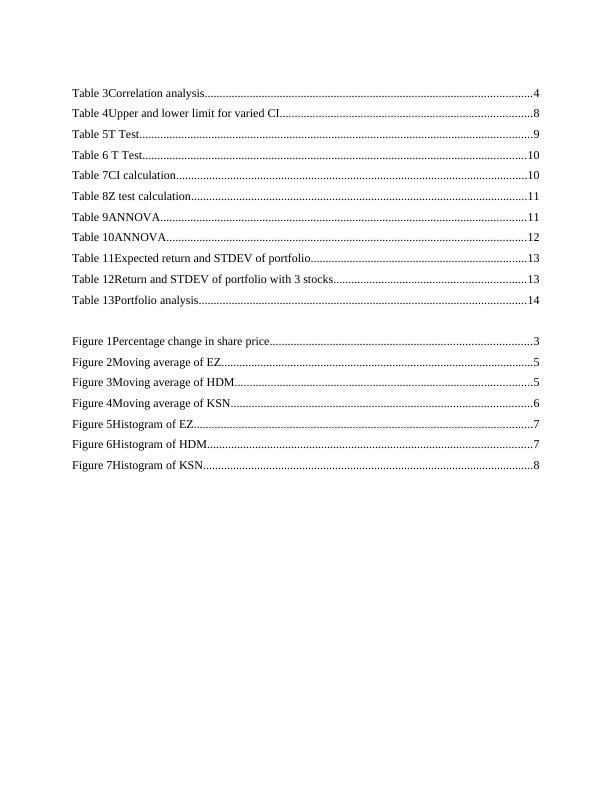
Table 3Correlation analysis.............................................................................................................4
Table 4Upper and lower limit for varied CI....................................................................................8
Table 5T Test...................................................................................................................................9
Table 6 T Test................................................................................................................................10
Table 7CI calculation.....................................................................................................................10
Table 8Z test calculation................................................................................................................11
Table 9ANNOVA..........................................................................................................................11
Table 10ANNOVA........................................................................................................................12
Table 11Expected return and STDEV of portfolio........................................................................13
Table 12Return and STDEV of portfolio with 3 stocks................................................................13
Table 13Portfolio analysis.............................................................................................................14
Figure 1Percentage change in share price.......................................................................................3
Figure 2Moving average of EZ........................................................................................................5
Figure 3Moving average of HDM...................................................................................................5
Figure 4Moving average of KSN....................................................................................................6
Figure 5Histogram of EZ.................................................................................................................7
Figure 6Histogram of HDM............................................................................................................7
Figure 7Histogram of KSN..............................................................................................................8
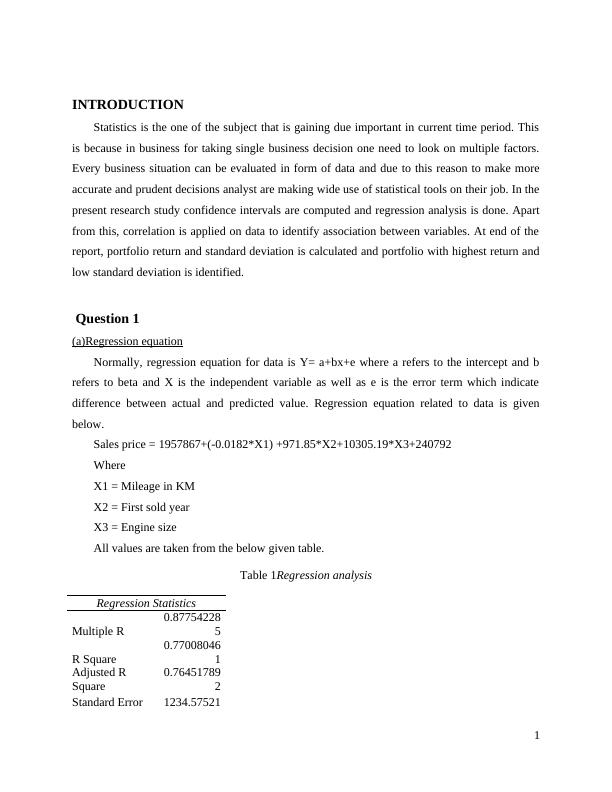
INTRODUCTION
Statistics is the one of the subject that is gaining due important in current time period. This
is because in business for taking single business decision one need to look on multiple factors.
Every business situation can be evaluated in form of data and due to this reason to make more
accurate and prudent decisions analyst are making wide use of statistical tools on their job. In the
present research study confidence intervals are computed and regression analysis is done. Apart
from this, correlation is applied on data to identify association between variables. At end of the
report, portfolio return and standard deviation is calculated and portfolio with highest return and
low standard deviation is identified.
Question 1
(a)Regression equation
Normally, regression equation for data is Y= a+bx+e where a refers to the intercept and b
refers to beta and X is the independent variable as well as e is the error term which indicate
difference between actual and predicted value. Regression equation related to data is given
below.
Sales price = 1957867+(-0.0182*X1) +971.85*X2+10305.19*X3+240792
Where
X1 = Mileage in KM
X2 = First sold year
X3 = Engine size
All values are taken from the below given table.
Table 1Regression analysis
Regression Statistics
Multiple R
0.87754228
5
R Square
0.77008046
1
Adjusted R
Square
0.76451789
2
Standard Error 1234.57521
1
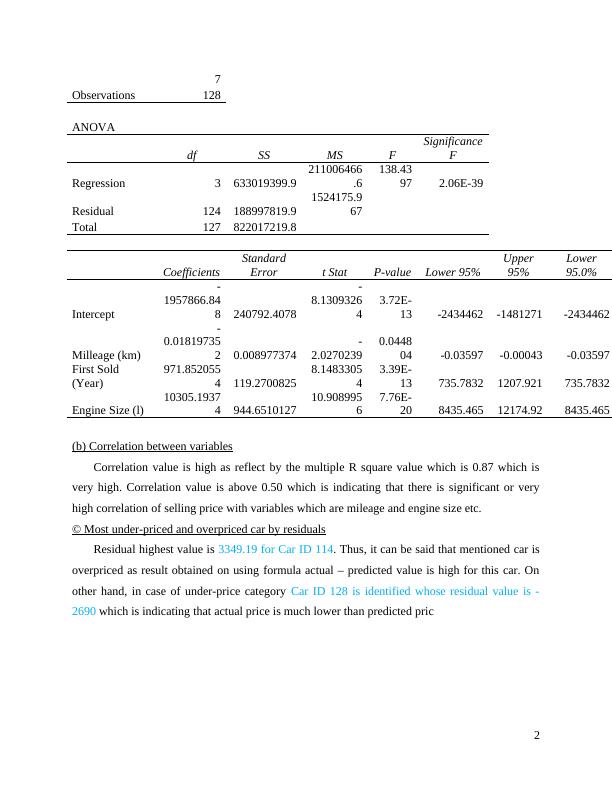
7
Observations 128
ANOVA
df SS MS F
Significance
F
Regression 3 633019399.9
211006466
.6
138.43
97 2.06E-39
Residual 124 188997819.9
1524175.9
67
Total 127 822017219.8
Coefficients
Standard
Error t Stat P-value Lower 95%
Upper
95%
Lower
95.0%
Intercept
-
1957866.84
8 240792.4078
-
8.1309326
4
3.72E-
13 -2434462 -1481271 -2434462
Milleage (km)
-
0.01819735
2 0.008977374
-
2.0270239
0.0448
04 -0.03597 -0.00043 -0.03597
First Sold
(Year)
971.852055
4 119.2700825
8.1483305
4
3.39E-
13 735.7832 1207.921 735.7832
Engine Size (l)
10305.1937
4 944.6510127
10.908995
6
7.76E-
20 8435.465 12174.92 8435.465
(b) Correlation between variables
Correlation value is high as reflect by the multiple R square value which is 0.87 which is
very high. Correlation value is above 0.50 which is indicating that there is significant or very
high correlation of selling price with variables which are mileage and engine size etc.
© Most under-priced and overpriced car by residuals
Residual highest value is 3349.19 for Car ID 114. Thus, it can be said that mentioned car is
overpriced as result obtained on using formula actual – predicted value is high for this car. On
other hand, in case of under-price category Car ID 128 is identified whose residual value is -
2690 which is indicating that actual price is much lower than predicted pric
2
End of preview
Want to access all the pages? Upload your documents or become a member.
Related Documents
Quantitative Finance & Financial Markets: Assignmentlg...
|22
|3881
|34
Statistics for Business Decision Assignment Samplelg...
|15
|2576
|164
QUAN102 - Statistics In Business Assignmentlg...
|7
|1209
|67
Analyzing the Relationship between Health Conditions and Lifestyle Factorslg...
|8
|1043
|455
Analyzing Statistics: Multiple Regression Analysis on Son's Height and Parental Heightslg...
|6
|1397
|479
Business Statisticslg...
|8
|824
|52