MATH 1065 – Quantitative Methods in Health
Added on 2020-03-04
9 Pages1191 Words496 Views
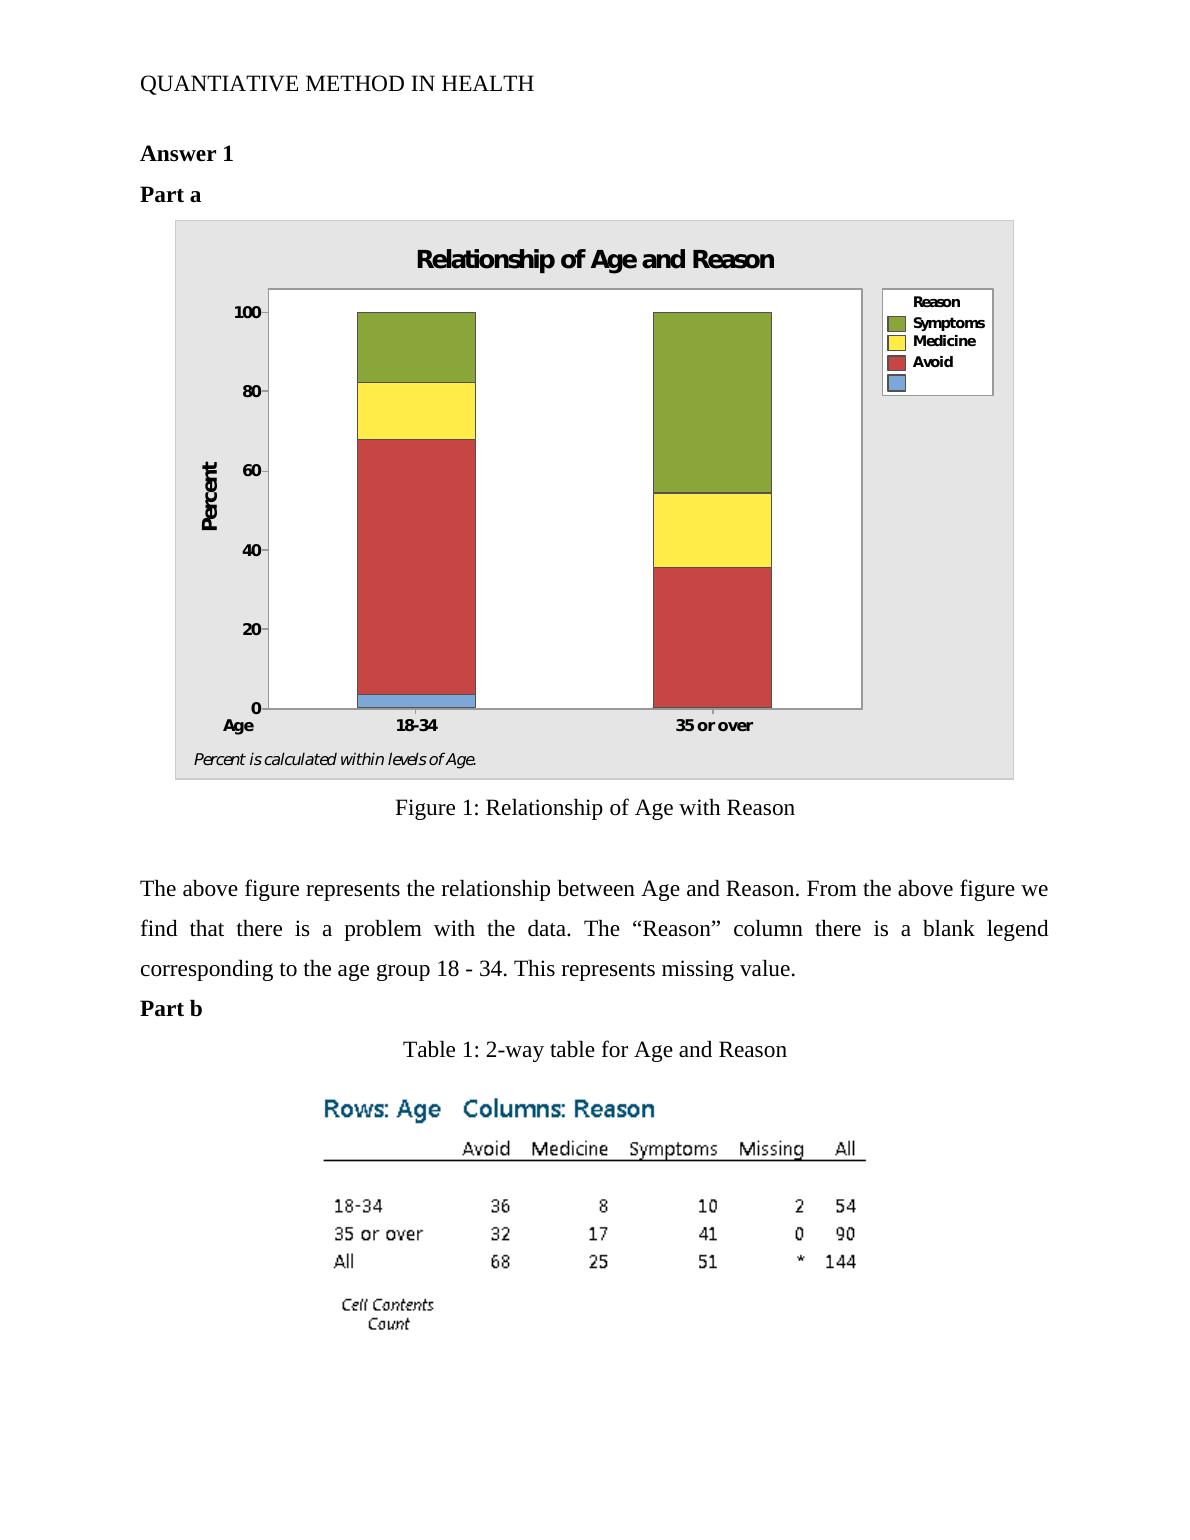
QUANTIATIVE METHOD IN HEALTH Answer 1Part aAge35orover18-34100806040200PercentSymptomsMedicineAvoidReasonPercentiscalculatedwithinlevelsofAge.RelationshipofAgeandReasonFigure 1: Relationship of Age with ReasonThe above figure represents the relationship between Age and Reason. From the above figure wefind that there is a problem with the data. The “Reason” column there is a blank legendcorresponding to the age group 18 - 34. This represents missing value. Part bTable 1: 2-way table for Age and Reason
1QUANTITATIVE METHOD IN HEALTHSubject NumberVariableSource of ProblemCorrected Value35ReasonMissing ValueRemoved37ReasonMissing ValueRemovedThe above table presents the problem with the data DrGoogle. We find that for subjectnumber 35 and 37 there are missing value’s in the variable Reason. Part cAge35orover18-34100806040200PercentSymptomsMedicineAvoidReason10054.444435.555610081.481566.6667PercentiscalculatedwithinlevelsofAge.RelationshipofAgeandReasonFigure 2: Relationship of Age and ReasonThe above figure shows the relationship between Age of a patient looking for informationon the internet and the reason for searching for the information. From the above figure we cansay that 1.45.56% of the patients in the age group of 35 or above searched for information aboutsymptoms before going to the Doctor. 2.66.67% of the patients in the age group of 18 – 34 searched for information on avoidingseeing a Doctor.

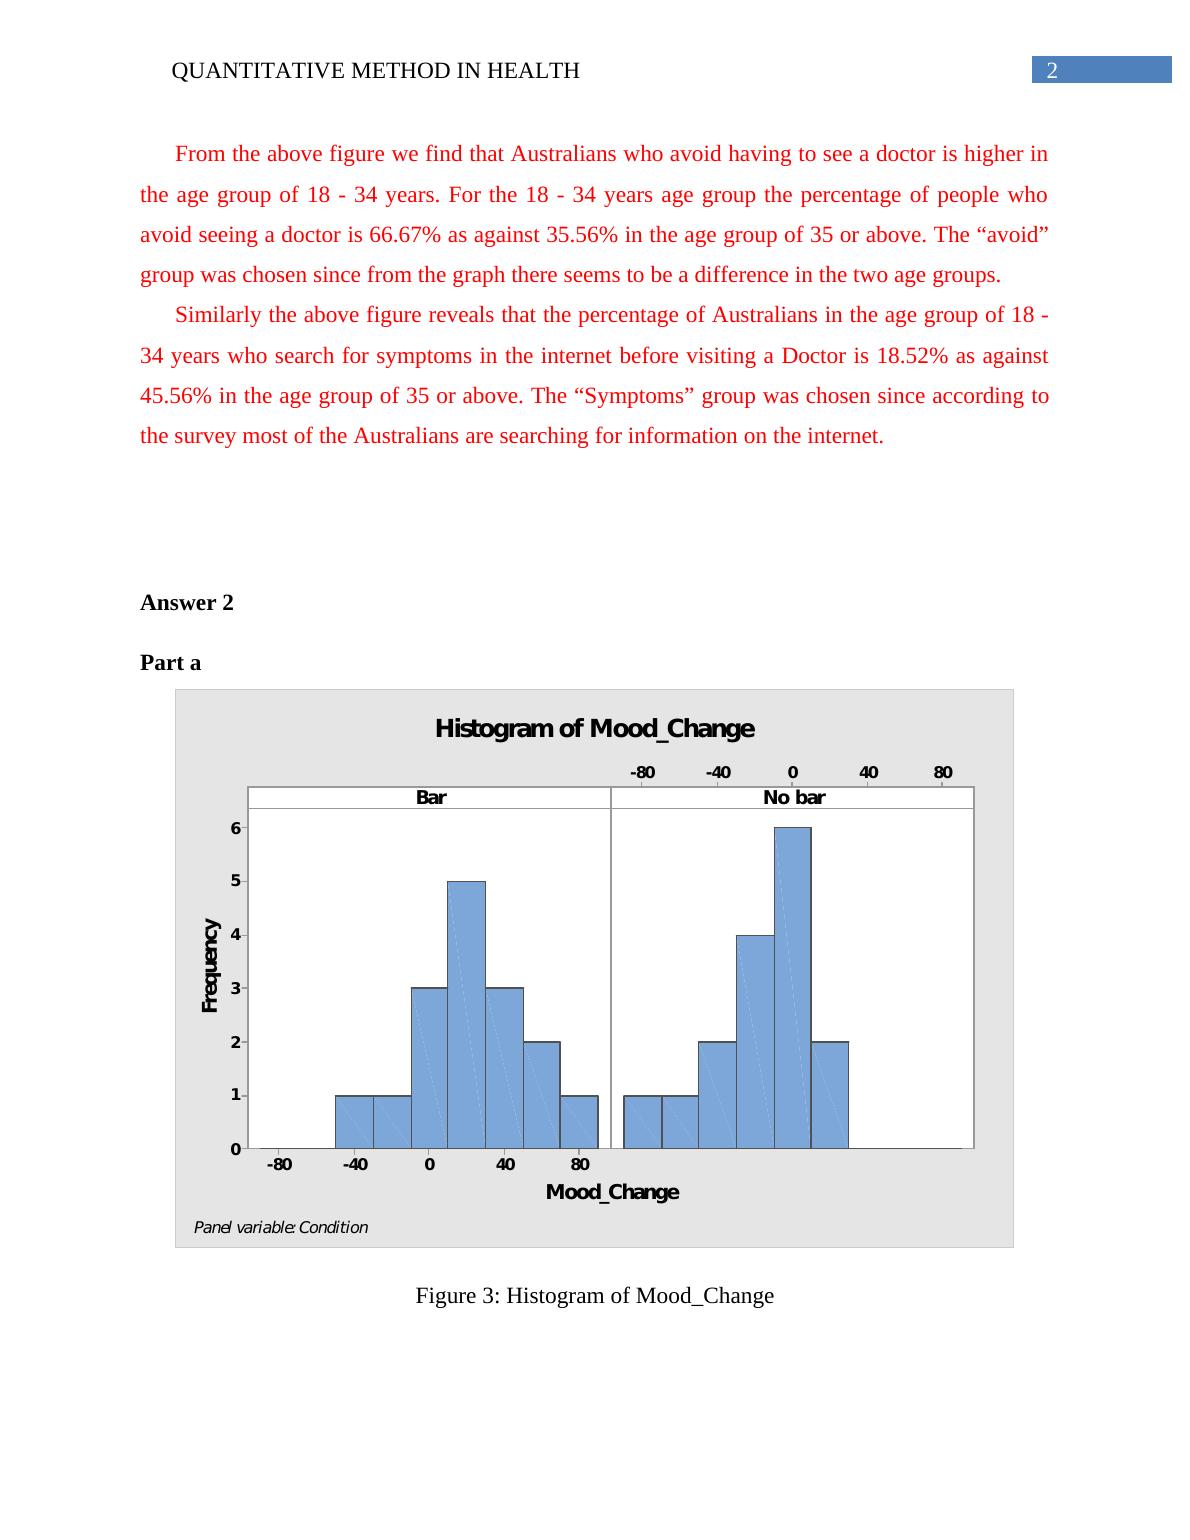
2QUANTITATIVE METHOD IN HEALTHFrom the above figure we find that Australians who avoid having to see a doctor is higher inthe age group of 18 - 34 years. For the 18 - 34 years age group the percentage of people whoavoid seeing a doctor is 66.67% as against 35.56% in the age group of 35 or above. The “avoid”group was chosen since from the graph there seems to be a difference in the two age groups. Similarly the above figure reveals that the percentage of Australians in the age group of 18 -34 years who search for symptoms in the internet before visiting a Doctor is 18.52% as against45.56% in the age group of 35 or above. The “Symptoms” group was chosen since according tothe survey most of the Australians are searching for information on the internet. Answer 2Part a80400-40-80654321080400-40-80BarMood_ChangeFrequencyNobarHistogramofMood_ChangePanelvariable:ConditionFigure 3: Histogram of Mood_Change
End of preview
Want to access all the pages? Upload your documents or become a member.
Related Documents
Business and Economics Statistics Analysis 2022lg...
|28
|2357
|31