logo

Quantitative Methods for Business

An individual student assignment on quantitative methods in business, involving 5 questions with a maximum mark of 33 for each question.

16 Pages3135 Words60 Views
   

Added on  2022-12-28

About This Document

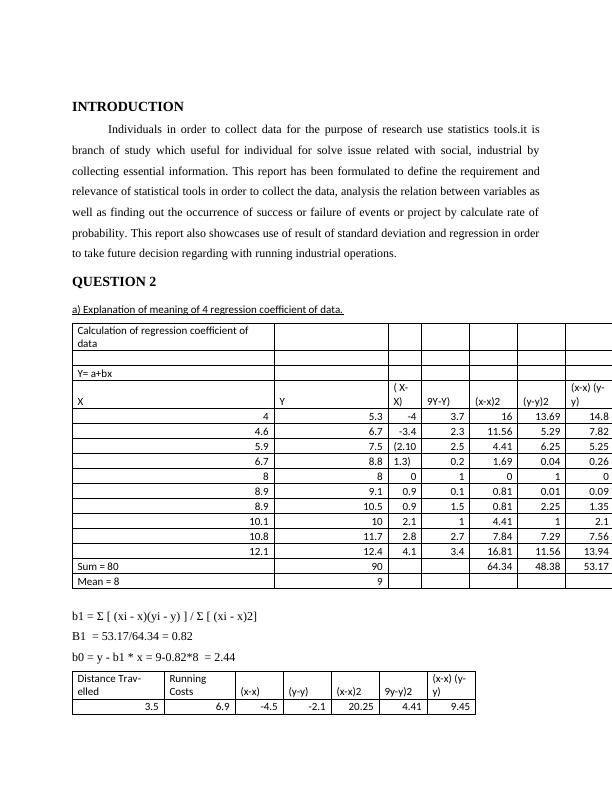
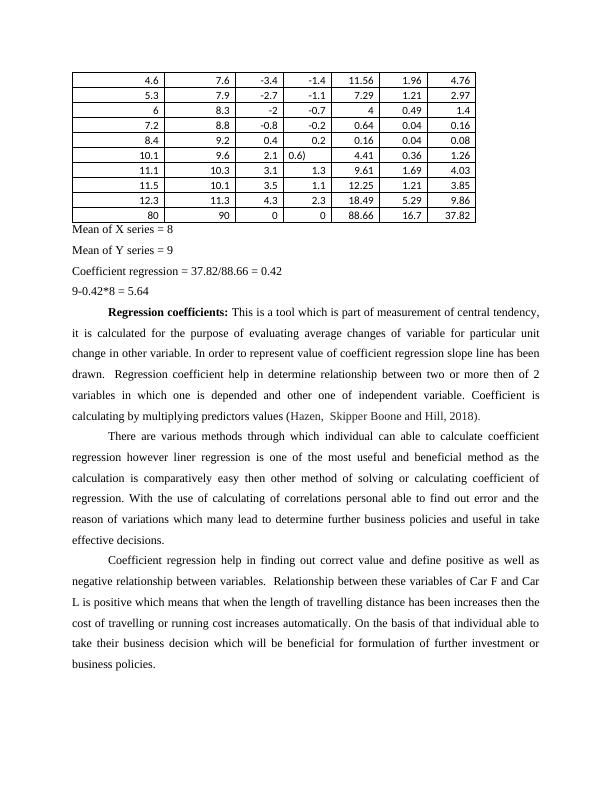
This report discusses the importance of statistical tools in collecting and analyzing data, and making decisions based on regression coefficients and probability. It also explores the use of standard deviation and mean in quantitative methods for business.

Quantitative Methods for Business

An individual student assignment on quantitative methods in business, involving 5 questions with a maximum mark of 33 for each question.

   Added on 2022-12-28

ShareRelated Documents
Quantitative Methods for Business
Quantitative Methods for Business_1
Table of Contents
INTRODUCTION...........................................................................................................................3
QUESTION 2..................................................................................................................................3
a) Explanation of meaning of 4 regression coefficient of data....................................................3
b) Brief explanation regarding decision taken of selection of region..........................................5
c) Calculation of expected running cost......................................................................................5
QUESTION 3..................................................................................................................................6
QUESTION 5..................................................................................................................................8
a) Probability of workers take less than of average time.............................................................9
b) Evaluate whatever income of self-employment in clothing industry is different.................10
c)Decision taken regarding manufacturing process...................................................................10
CONCLUSION..............................................................................................................................10
REFERENCES..............................................................................................................................12
Quantitative Methods for Business_2
INTRODUCTION
Individuals in order to collect data for the purpose of research use statistics tools.it is
branch of study which useful for individual for solve issue related with social, industrial by
collecting essential information. This report has been formulated to define the requirement and
relevance of statistical tools in order to collect the data, analysis the relation between variables as
well as finding out the occurrence of success or failure of events or project by calculate rate of
probability. This report also showcases use of result of standard deviation and regression in order
to take future decision regarding with running industrial operations.
QUESTION 2
a) Explanation of meaning of 4 regression coefficient of data.
Calculation of regression coefficient of
data
Y= a+bx
X Y
( X-
X) 9Y-Y) (x-x)2 (y-y)2
(x-x) (y-
y)
4 5.3 -4 3.7 16 13.69 14.8
4.6 6.7 -3.4 2.3 11.56 5.29 7.82
5.9 7.5 (2.10 2.5 4.41 6.25 5.25
6.7 8.8 1.3) 0.2 1.69 0.04 0.26
8 8 0 1 0 1 0
8.9 9.1 0.9 0.1 0.81 0.01 0.09
8.9 10.5 0.9 1.5 0.81 2.25 1.35
10.1 10 2.1 1 4.41 1 2.1
10.8 11.7 2.8 2.7 7.84 7.29 7.56
12.1 12.4 4.1 3.4 16.81 11.56 13.94
Sum = 80 90 64.34 48.38 53.17
Mean = 8 9
b1 = Σ [ (xi - x)(yi - y) ] / Σ [ (xi - x)2]
B1 = 53.17/64.34 = 0.82
b0 = y - b1 * x = 9-0.82*8 = 2.44
Distance Trav-
elled
Running
Costs (x-x) (y-y) (x-x)2 9y-y)2
(x-x) (y-
y)
3.5 6.9 -4.5 -2.1 20.25 4.41 9.45
Quantitative Methods for Business_3
4.6 7.6 -3.4 -1.4 11.56 1.96 4.76
5.3 7.9 -2.7 -1.1 7.29 1.21 2.97
6 8.3 -2 -0.7 4 0.49 1.4
7.2 8.8 -0.8 -0.2 0.64 0.04 0.16
8.4 9.2 0.4 0.2 0.16 0.04 0.08
10.1 9.6 2.1 0.6) 4.41 0.36 1.26
11.1 10.3 3.1 1.3 9.61 1.69 4.03
11.5 10.1 3.5 1.1 12.25 1.21 3.85
12.3 11.3 4.3 2.3 18.49 5.29 9.86
80 90 0 0 88.66 16.7 37.82
Mean of X series = 8
Mean of Y series = 9
Coefficient regression = 37.82/88.66 = 0.42
9-0.42*8 = 5.64
Regression coefficients: This is a tool which is part of measurement of central tendency,
it is calculated for the purpose of evaluating average changes of variable for particular unit
change in other variable. In order to represent value of coefficient regression slope line has been
drawn. Regression coefficient help in determine relationship between two or more then of 2
variables in which one is depended and other one of independent variable. Coefficient is
calculating by multiplying predictors values (Hazen, Skipper Boone and Hill, 2018).
There are various methods through which individual can able to calculate coefficient
regression however liner regression is one of the most useful and beneficial method as the
calculation is comparatively easy then other method of solving or calculating coefficient of
regression. With the use of calculating of correlations personal able to find out error and the
reason of variations which many lead to determine further business policies and useful in take
effective decisions.
Coefficient regression help in finding out correct value and define positive as well as
negative relationship between variables. Relationship between these variables of Car F and Car
L is positive which means that when the length of travelling distance has been increases then the
cost of travelling or running cost increases automatically. On the basis of that individual able to
take their business decision which will be beneficial for formulation of further investment or
business policies.
Quantitative Methods for Business_4

End of preview

Want to access all the pages? Upload your documents or become a member.

Related Documents
Quantitative Methods for Business
|10
|1841
|32