Quantitative Methods for Business Alternative Assessment UGB 108
VerifiedAdded on 2023/01/12
|11
|3391
|73
Homework Assignment
AI Summary
This document presents a completed alternative assessment for a Quantitative Methods for Business course (UGB 108). The assignment addresses several key concepts, including the calculation and interpretation of the mean and standard deviation, with detailed calculations provided. It also covers the explanation of various sampling methods, such as simple random sampling, quota sampling, cluster sampling, and systematic sampling. Furthermore, the assignment demonstrates the formulation of cumulative frequency distributions and their interpretation. The solution includes calculations of probability and the correlation coefficient using both Spearman's and Karl Pearson's methods, along with their respective interpretations. The student has provided detailed explanations and calculations for each question, demonstrating a strong understanding of the quantitative methods covered in the course. This assignment is a valuable resource for students studying quantitative methods in a business context.
QUANTITATIVE METHOD FOR BUSINES
ALTERNATIVE ASSESSMENT
ALTERNATIVE ASSESSMENT
Paraphrase This Document
Need a fresh take? Get an instant paraphrase of this document with our AI Paraphraser
Contents
QUESTION 1..............................................................................................................................................3
1)a) Calculation of mean.........................................................................................................................3
B) Calculation of standard deviation.......................................................................................................3
C) Interpretation......................................................................................................................................3
2) Explanation of sampling methods.......................................................................................................3
3) Formulation of Cumulative frequency.................................................................................................3
QUESTION 3..............................................................................................................................................3
Calculation of probability........................................................................................................................3
QUESTION4...............................................................................................................................................3
Calculation of correlation coefficient by using Spearman‘s method........................................................3
Calculation of correlation of coefficient by using Karl Pearson method..................................................3
QUESTION 1
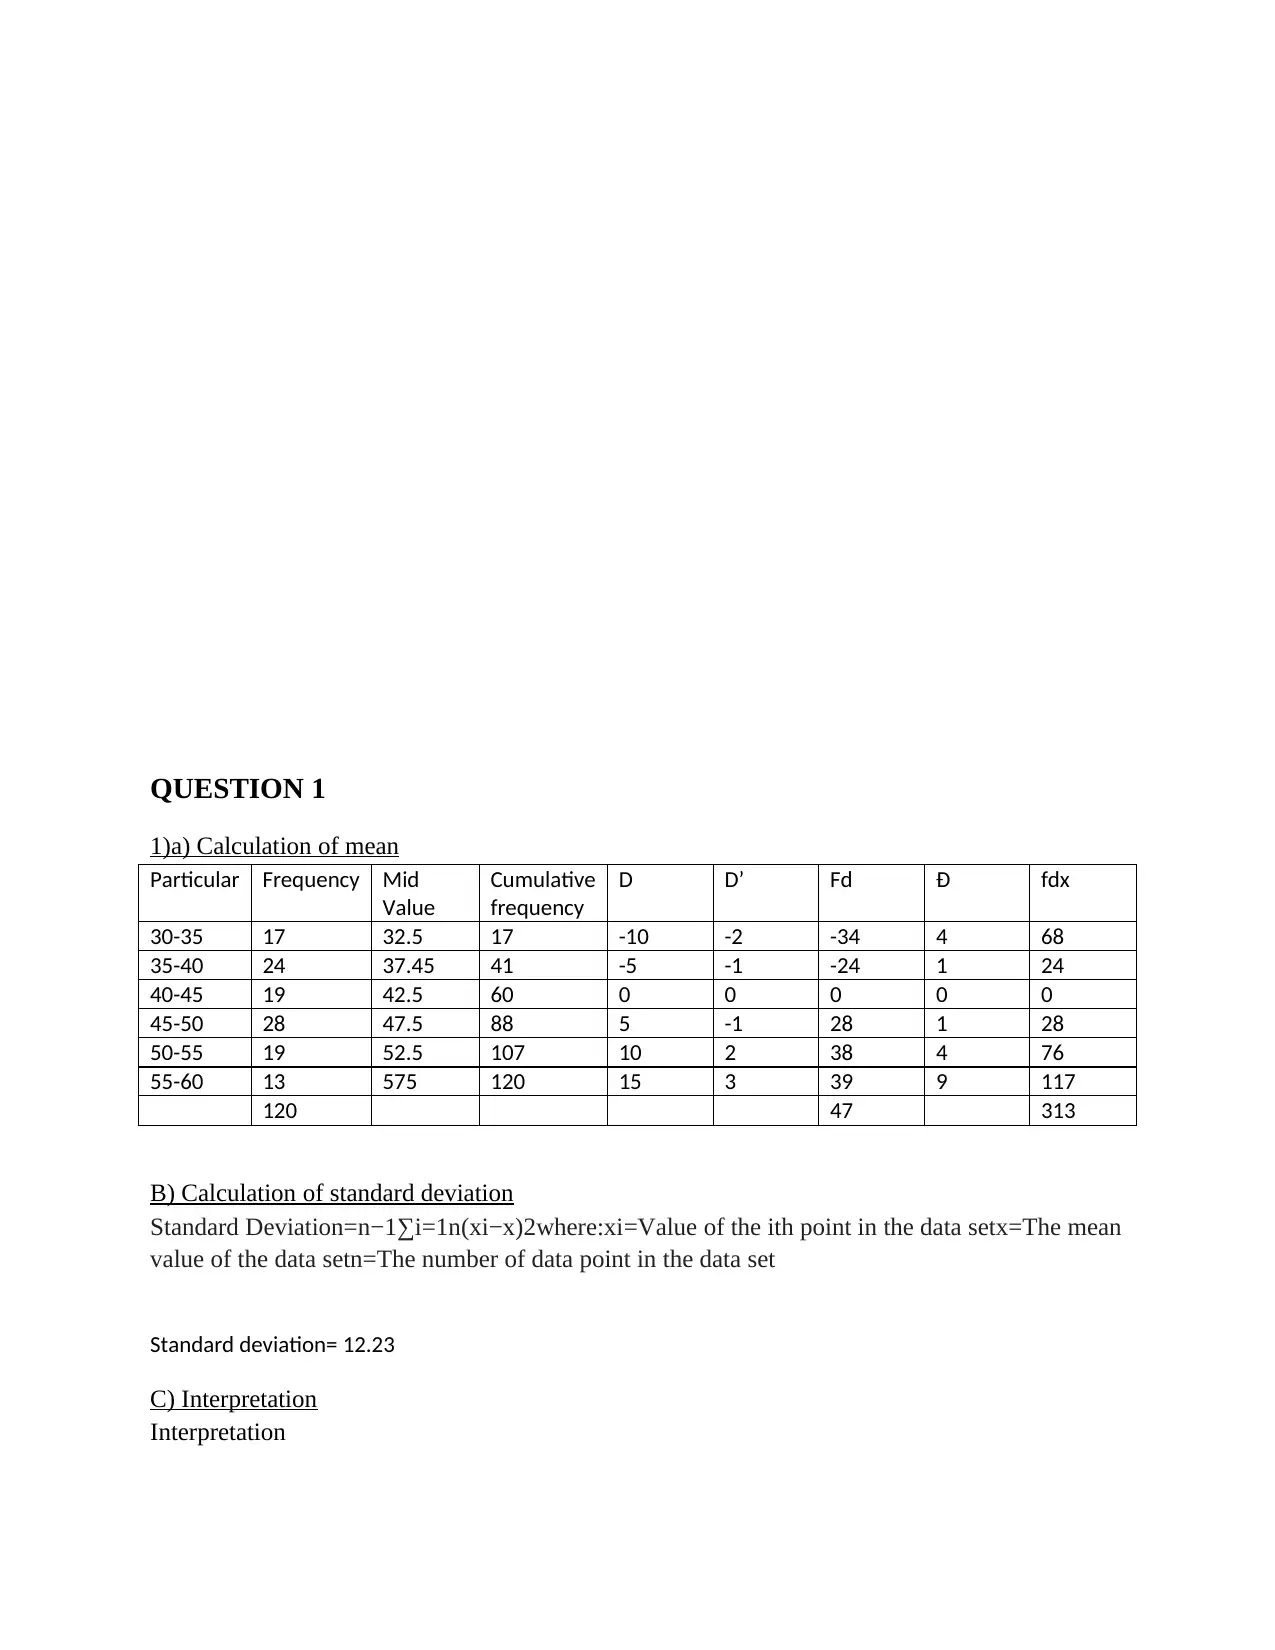
1)a) Calculation of mean
Particular Frequency Mid
Value
Cumulative
frequency
D D’ Fd Ɖ fdx
30-35 17 32.5 17 -10 -2 -34 4 68
35-40 24 37.45 41 -5 -1 -24 1 24
40-45 19 42.5 60 0 0 0 0 0
45-50 28 47.5 88 5 -1 28 1 28
50-55 19 52.5 107 10 2 38 4 76
55-60 13 575 120 15 3 39 9 117
120 47 313
B) Calculation of standard deviation
Standard Deviation=n−1∑i=1n(xi−x)2where:xi=Value of the ith point in the data setx=The mean
value of the data setn=The number of data point in the data set
Standard deviation= 12.23
C) Interpretation
Interpretation
⊘ This is a preview!⊘
Do you want full access?
Subscribe today to unlock all pages.
Trusted by 1+ million students worldwide
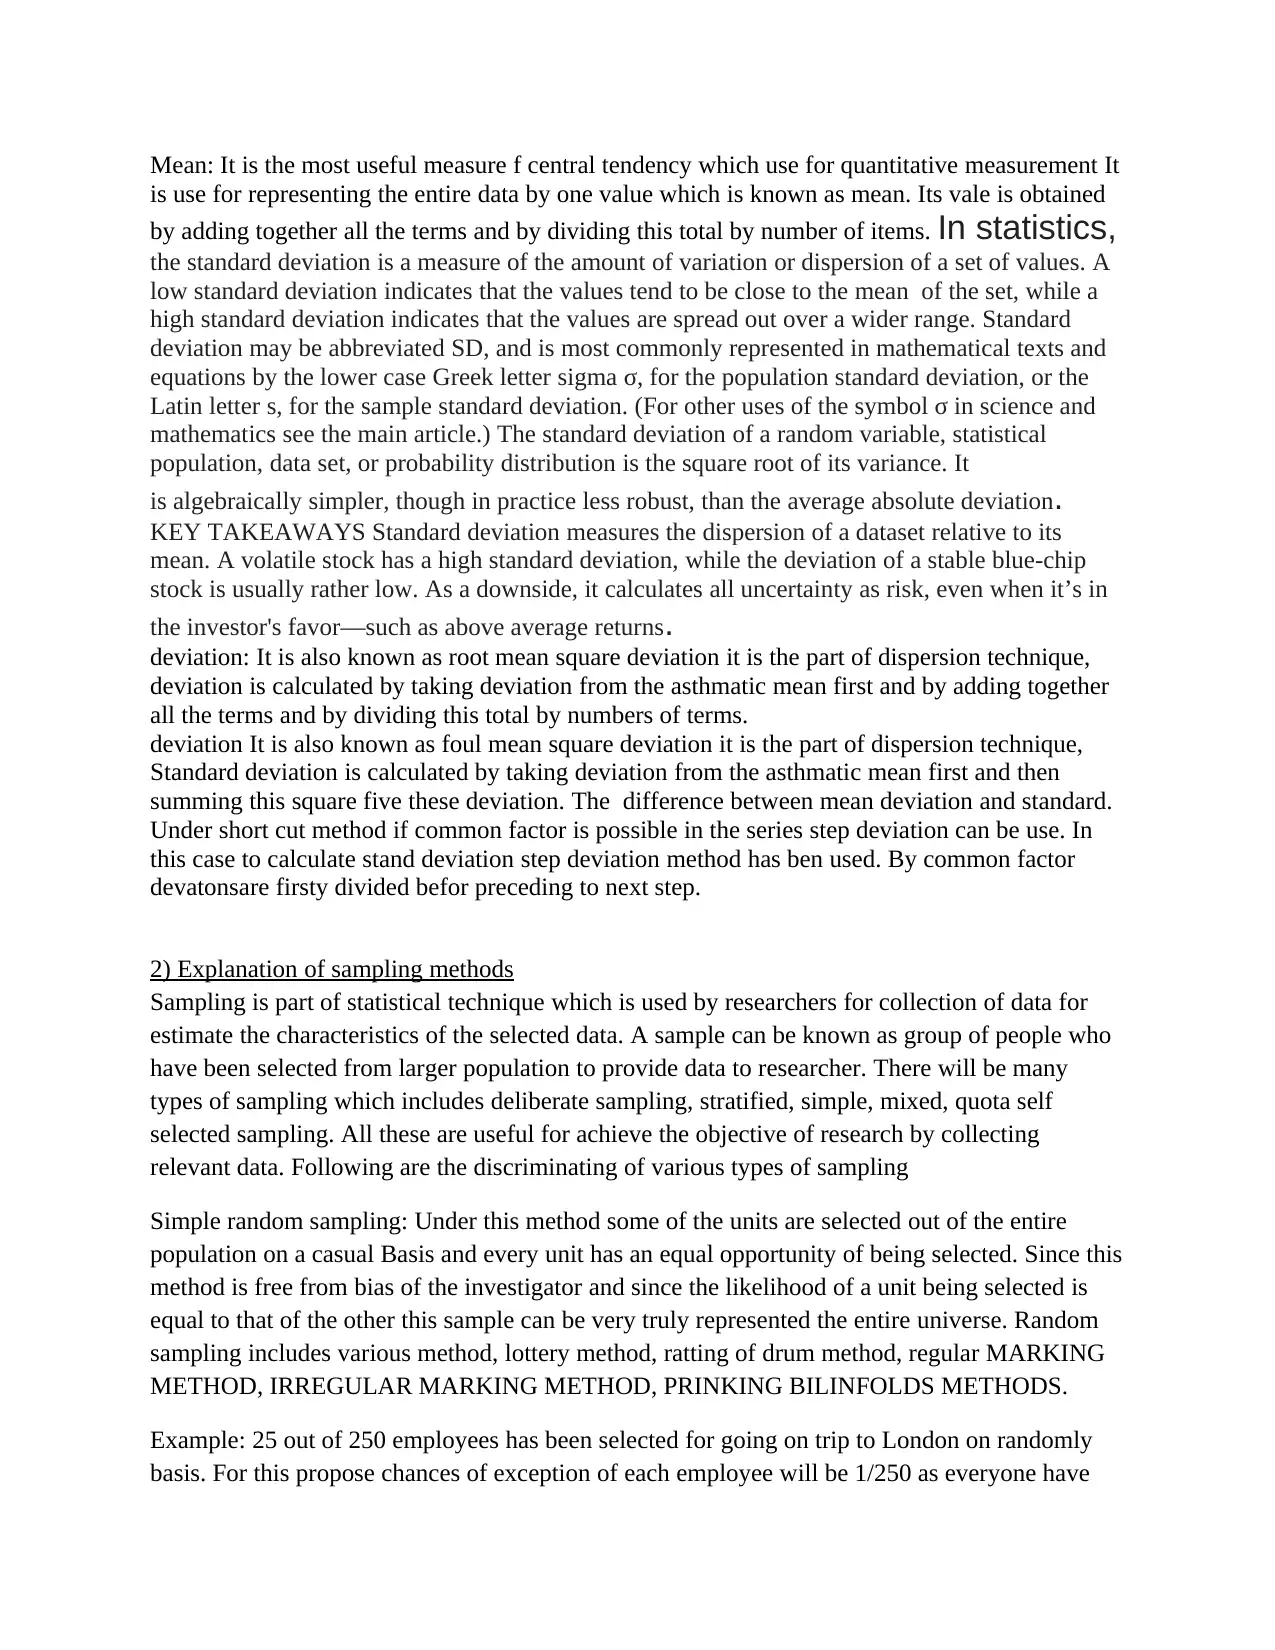
Mean: It is the most useful measure f central tendency which use for quantitative measurement It
is use for representing the entire data by one value which is known as mean. Its vale is obtained
by adding together all the terms and by dividing this total by number of items. In statistics,
the standard deviation is a measure of the amount of variation or dispersion of a set of values. A
low standard deviation indicates that the values tend to be close to the mean of the set, while a
high standard deviation indicates that the values are spread out over a wider range. Standard
deviation may be abbreviated SD, and is most commonly represented in mathematical texts and
equations by the lower case Greek letter sigma σ, for the population standard deviation, or the
Latin letter s, for the sample standard deviation. (For other uses of the symbol σ in science and
mathematics see the main article.) The standard deviation of a random variable, statistical
population, data set, or probability distribution is the square root of its variance. It
is algebraically simpler, though in practice less robust, than the average absolute deviation.
KEY TAKEAWAYS Standard deviation measures the dispersion of a dataset relative to its
mean. A volatile stock has a high standard deviation, while the deviation of a stable blue-chip
stock is usually rather low. As a downside, it calculates all uncertainty as risk, even when it’s in
the investor's favor—such as above average returns.
deviation: It is also known as root mean square deviation it is the part of dispersion technique,
deviation is calculated by taking deviation from the asthmatic mean first and by adding together
all the terms and by dividing this total by numbers of terms.
deviation It is also known as foul mean square deviation it is the part of dispersion technique,
Standard deviation is calculated by taking deviation from the asthmatic mean first and then
summing this square five these deviation. The difference between mean deviation and standard.
Under short cut method if common factor is possible in the series step deviation can be use. In
this case to calculate stand deviation step deviation method has ben used. By common factor
devatonsare firsty divided befor preceding to next step.
2) Explanation of sampling methods
Sampling is part of statistical technique which is used by researchers for collection of data for
estimate the characteristics of the selected data. A sample can be known as group of people who
have been selected from larger population to provide data to researcher. There will be many
types of sampling which includes deliberate sampling, stratified, simple, mixed, quota self
selected sampling. All these are useful for achieve the objective of research by collecting
relevant data. Following are the discriminating of various types of sampling
Simple random sampling: Under this method some of the units are selected out of the entire
population on a casual Basis and every unit has an equal opportunity of being selected. Since this
method is free from bias of the investigator and since the likelihood of a unit being selected is
equal to that of the other this sample can be very truly represented the entire universe. Random
sampling includes various method, lottery method, ratting of drum method, regular MARKING
METHOD, IRREGULAR MARKING METHOD, PRINKING BILINFOLDS METHODS.
Example: 25 out of 250 employees has been selected for going on trip to London on randomly
basis. For this propose chances of exception of each employee will be 1/250 as everyone have
Paraphrase This Document
Need a fresh take? Get an instant paraphrase of this document with our AI Paraphraser
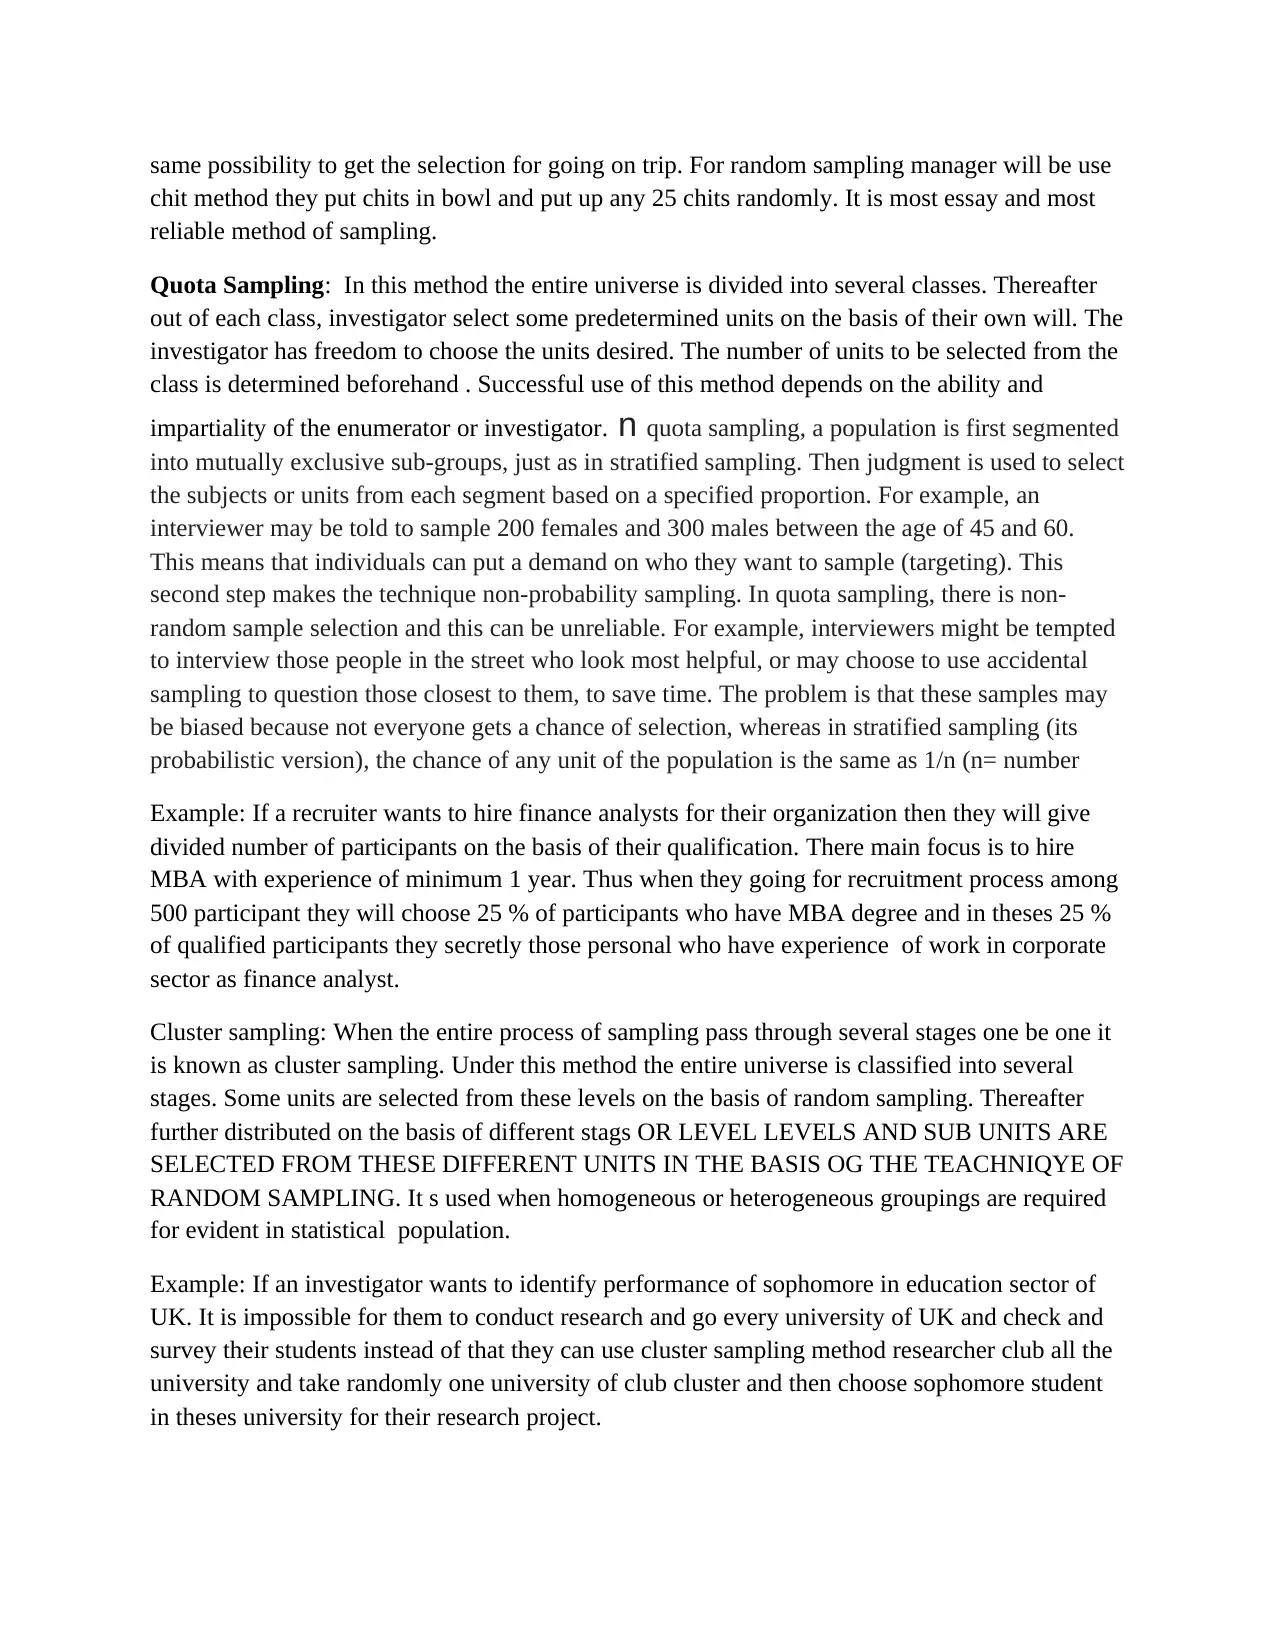
same possibility to get the selection for going on trip. For random sampling manager will be use
chit method they put chits in bowl and put up any 25 chits randomly. It is most essay and most
reliable method of sampling.
Quota Sampling: In this method the entire universe is divided into several classes. Thereafter
out of each class, investigator select some predetermined units on the basis of their own will. The
investigator has freedom to choose the units desired. The number of units to be selected from the
class is determined beforehand . Successful use of this method depends on the ability and
impartiality of the enumerator or investigator. n quota sampling, a population is first segmented
into mutually exclusive sub-groups, just as in stratified sampling. Then judgment is used to select
the subjects or units from each segment based on a specified proportion. For example, an
interviewer may be told to sample 200 females and 300 males between the age of 45 and 60.
This means that individuals can put a demand on who they want to sample (targeting). This
second step makes the technique non-probability sampling. In quota sampling, there is non-
random sample selection and this can be unreliable. For example, interviewers might be tempted
to interview those people in the street who look most helpful, or may choose to use accidental
sampling to question those closest to them, to save time. The problem is that these samples may
be biased because not everyone gets a chance of selection, whereas in stratified sampling (its
probabilistic version), the chance of any unit of the population is the same as 1/n (n= number
Example: If a recruiter wants to hire finance analysts for their organization then they will give
divided number of participants on the basis of their qualification. There main focus is to hire
MBA with experience of minimum 1 year. Thus when they going for recruitment process among
500 participant they will choose 25 % of participants who have MBA degree and in theses 25 %
of qualified participants they secretly those personal who have experience of work in corporate
sector as finance analyst.
Cluster sampling: When the entire process of sampling pass through several stages one be one it
is known as cluster sampling. Under this method the entire universe is classified into several
stages. Some units are selected from these levels on the basis of random sampling. Thereafter
further distributed on the basis of different stags OR LEVEL LEVELS AND SUB UNITS ARE
SELECTED FROM THESE DIFFERENT UNITS IN THE BASIS OG THE TEACHNIQYE OF
RANDOM SAMPLING. It s used when homogeneous or heterogeneous groupings are required
for evident in statistical population.
Example: If an investigator wants to identify performance of sophomore in education sector of
UK. It is impossible for them to conduct research and go every university of UK and check and
survey their students instead of that they can use cluster sampling method researcher club all the
university and take randomly one university of club cluster and then choose sophomore student
in theses university for their research project.
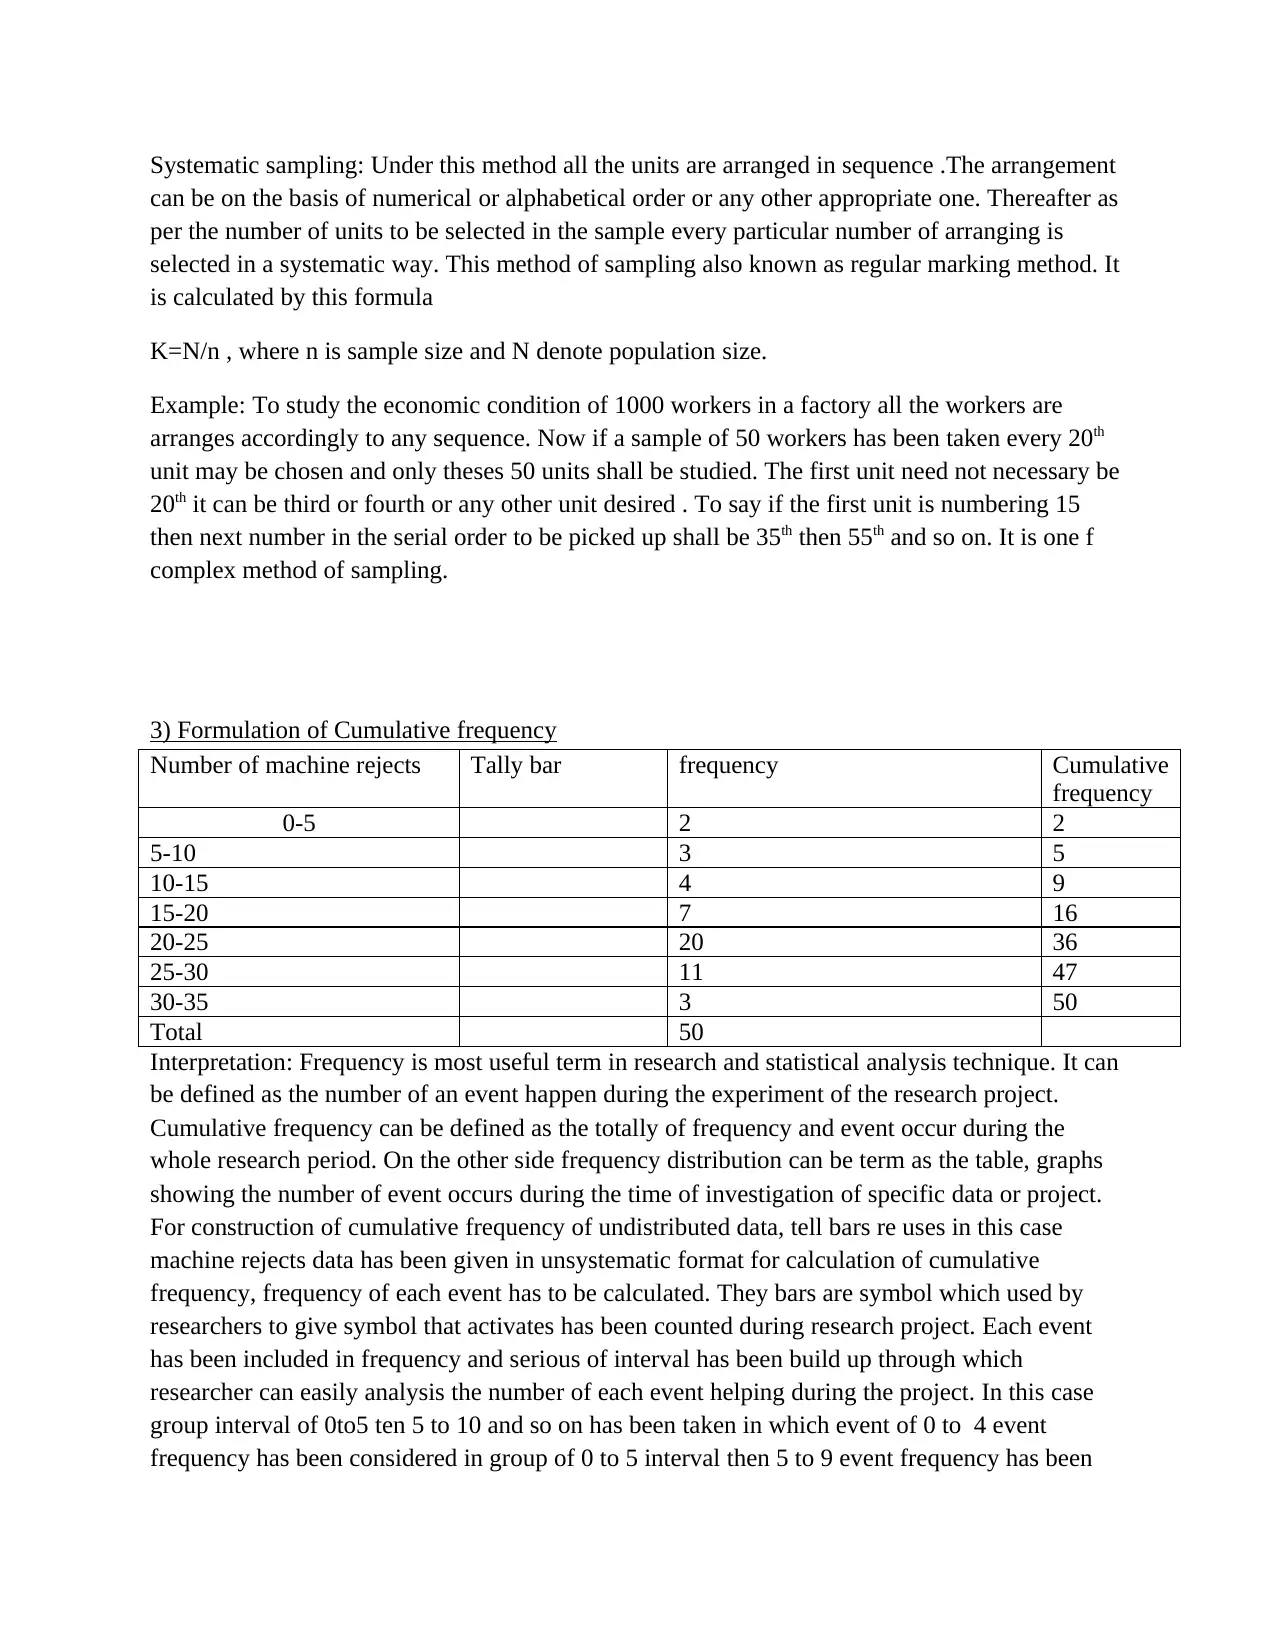
Systematic sampling: Under this method all the units are arranged in sequence .The arrangement
can be on the basis of numerical or alphabetical order or any other appropriate one. Thereafter as
per the number of units to be selected in the sample every particular number of arranging is
selected in a systematic way. This method of sampling also known as regular marking method. It
is calculated by this formula
K=N/n , where n is sample size and N denote population size.
Example: To study the economic condition of 1000 workers in a factory all the workers are
arranges accordingly to any sequence. Now if a sample of 50 workers has been taken every 20th
unit may be chosen and only theses 50 units shall be studied. The first unit need not necessary be
20th it can be third or fourth or any other unit desired . To say if the first unit is numbering 15
then next number in the serial order to be picked up shall be 35th then 55th and so on. It is one f
complex method of sampling.
3) Formulation of Cumulative frequency
Number of machine rejects Tally bar frequency Cumulative
frequency
0-5 2 2
5-10 3 5
10-15 4 9
15-20 7 16
20-25 20 36
25-30 11 47
30-35 3 50
Total 50
Interpretation: Frequency is most useful term in research and statistical analysis technique. It can
be defined as the number of an event happen during the experiment of the research project.
Cumulative frequency can be defined as the totally of frequency and event occur during the
whole research period. On the other side frequency distribution can be term as the table, graphs
showing the number of event occurs during the time of investigation of specific data or project.
For construction of cumulative frequency of undistributed data, tell bars re uses in this case
machine rejects data has been given in unsystematic format for calculation of cumulative
frequency, frequency of each event has to be calculated. They bars are symbol which used by
researchers to give symbol that activates has been counted during research project. Each event
has been included in frequency and serious of interval has been build up through which
researcher can easily analysis the number of each event helping during the project. In this case
group interval of 0to5 ten 5 to 10 and so on has been taken in which event of 0 to 4 event
frequency has been considered in group of 0 to 5 interval then 5 to 9 event frequency has been
⊘ This is a preview!⊘
Do you want full access?
Subscribe today to unlock all pages.
Trusted by 1+ million students worldwide
calculated in 5 to 10 group. The cumulative frequency can be calculated by additional of
previous frequency it represent total number of event. In this case total cumulative frequency has
been calculated is 50.
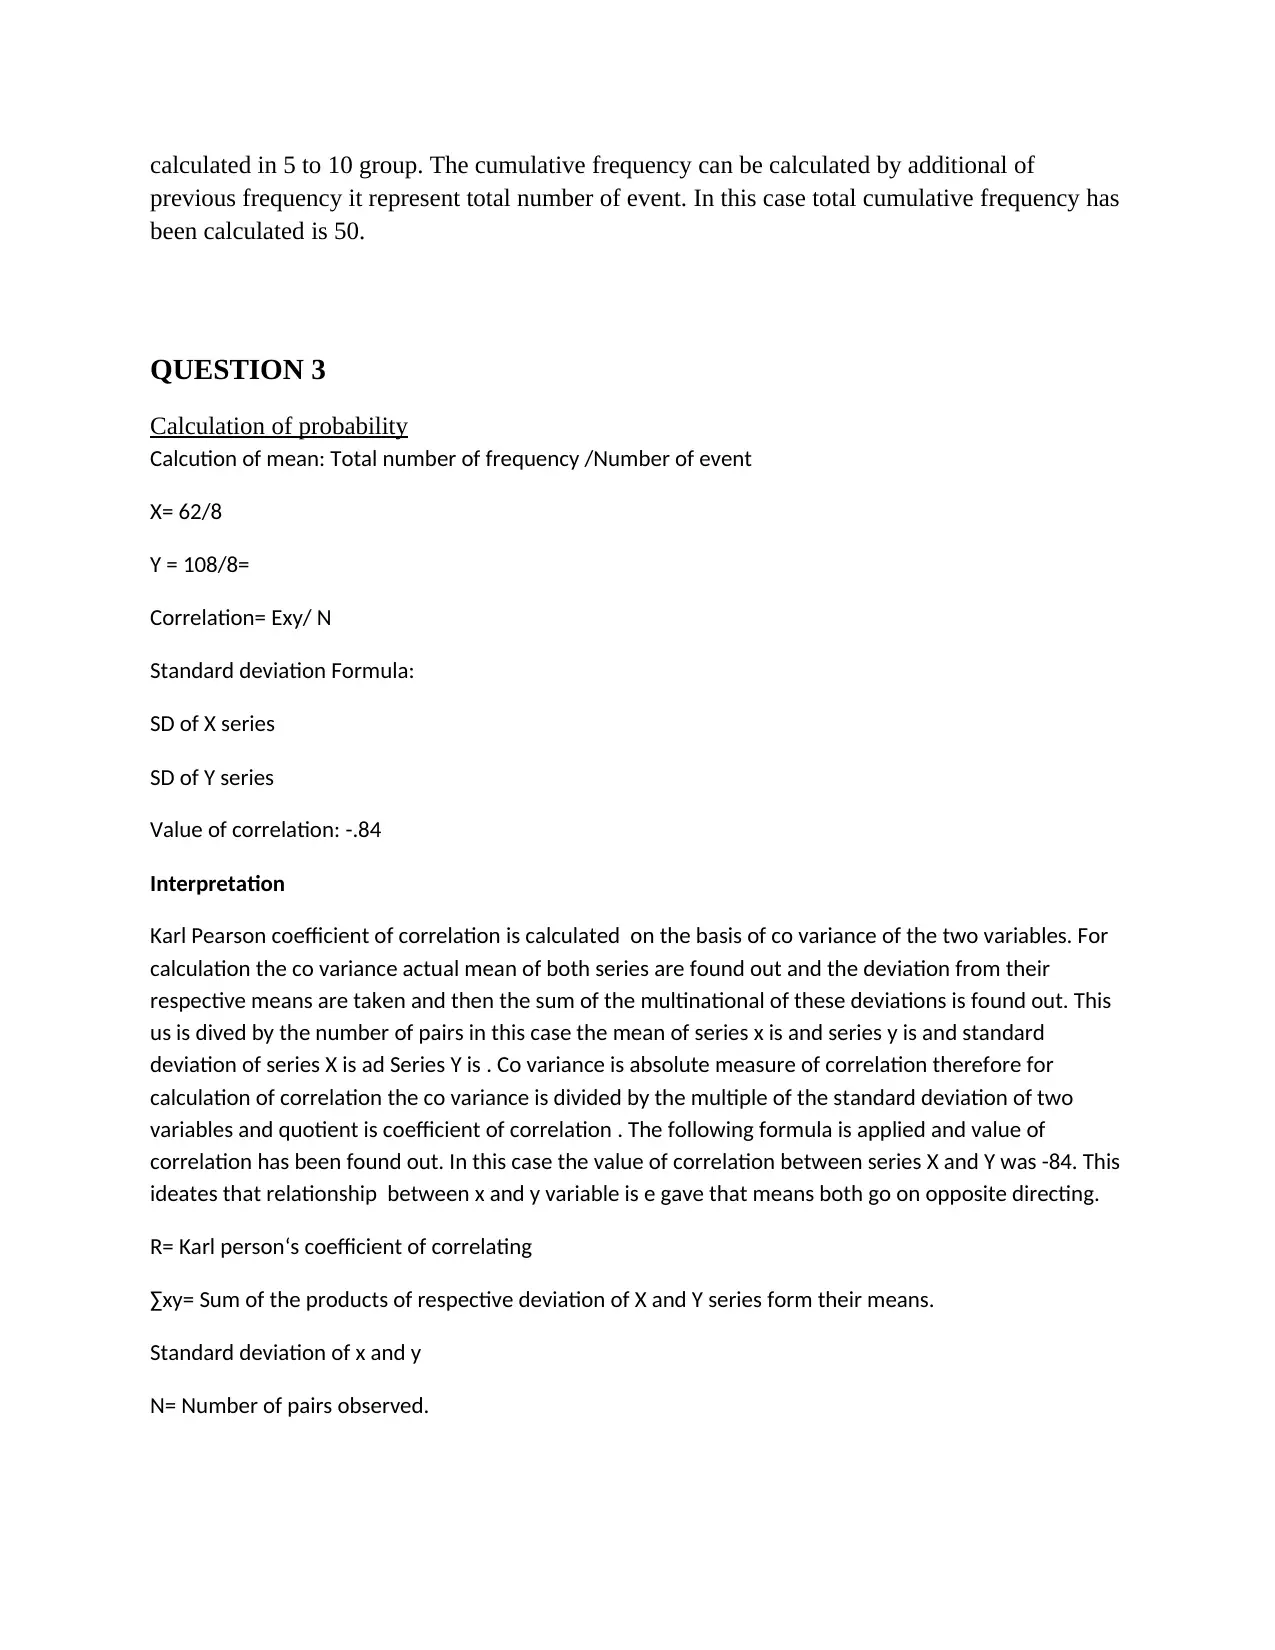
QUESTION 3
Calculation of probability
Calcution of mean: Total number of frequency /Number of event
X= 62/8
Y = 108/8=
Correlation= Exy/ N
Standard deviation Formula:
SD of X series
SD of Y series
Value of correlation: -.84
Interpretation
Karl Pearson coefficient of correlation is calculated on the basis of co variance of the two variables. For
calculation the co variance actual mean of both series are found out and the deviation from their
respective means are taken and then the sum of the multinational of these deviations is found out. This
us is dived by the number of pairs in this case the mean of series x is and series y is and standard
deviation of series X is ad Series Y is . Co variance is absolute measure of correlation therefore for
calculation of correlation the co variance is divided by the multiple of the standard deviation of two
variables and quotient is coefficient of correlation . The following formula is applied and value of
correlation has been found out. In this case the value of correlation between series X and Y was -84. This
ideates that relationship between x and y variable is e gave that means both go on opposite directing.
R= Karl person‘s coefficient of correlating
∑xy= Sum of the products of respective deviation of X and Y series form their means.
Standard deviation of x and y
N= Number of pairs observed.
previous frequency it represent total number of event. In this case total cumulative frequency has
been calculated is 50.
QUESTION 3
Calculation of probability
Calcution of mean: Total number of frequency /Number of event
X= 62/8
Y = 108/8=
Correlation= Exy/ N
Standard deviation Formula:
SD of X series
SD of Y series
Value of correlation: -.84
Interpretation
Karl Pearson coefficient of correlation is calculated on the basis of co variance of the two variables. For
calculation the co variance actual mean of both series are found out and the deviation from their
respective means are taken and then the sum of the multinational of these deviations is found out. This
us is dived by the number of pairs in this case the mean of series x is and series y is and standard
deviation of series X is ad Series Y is . Co variance is absolute measure of correlation therefore for
calculation of correlation the co variance is divided by the multiple of the standard deviation of two
variables and quotient is coefficient of correlation . The following formula is applied and value of
correlation has been found out. In this case the value of correlation between series X and Y was -84. This
ideates that relationship between x and y variable is e gave that means both go on opposite directing.
R= Karl person‘s coefficient of correlating
∑xy= Sum of the products of respective deviation of X and Y series form their means.
Standard deviation of x and y
N= Number of pairs observed.
Paraphrase This Document
Need a fresh take? Get an instant paraphrase of this document with our AI Paraphraser
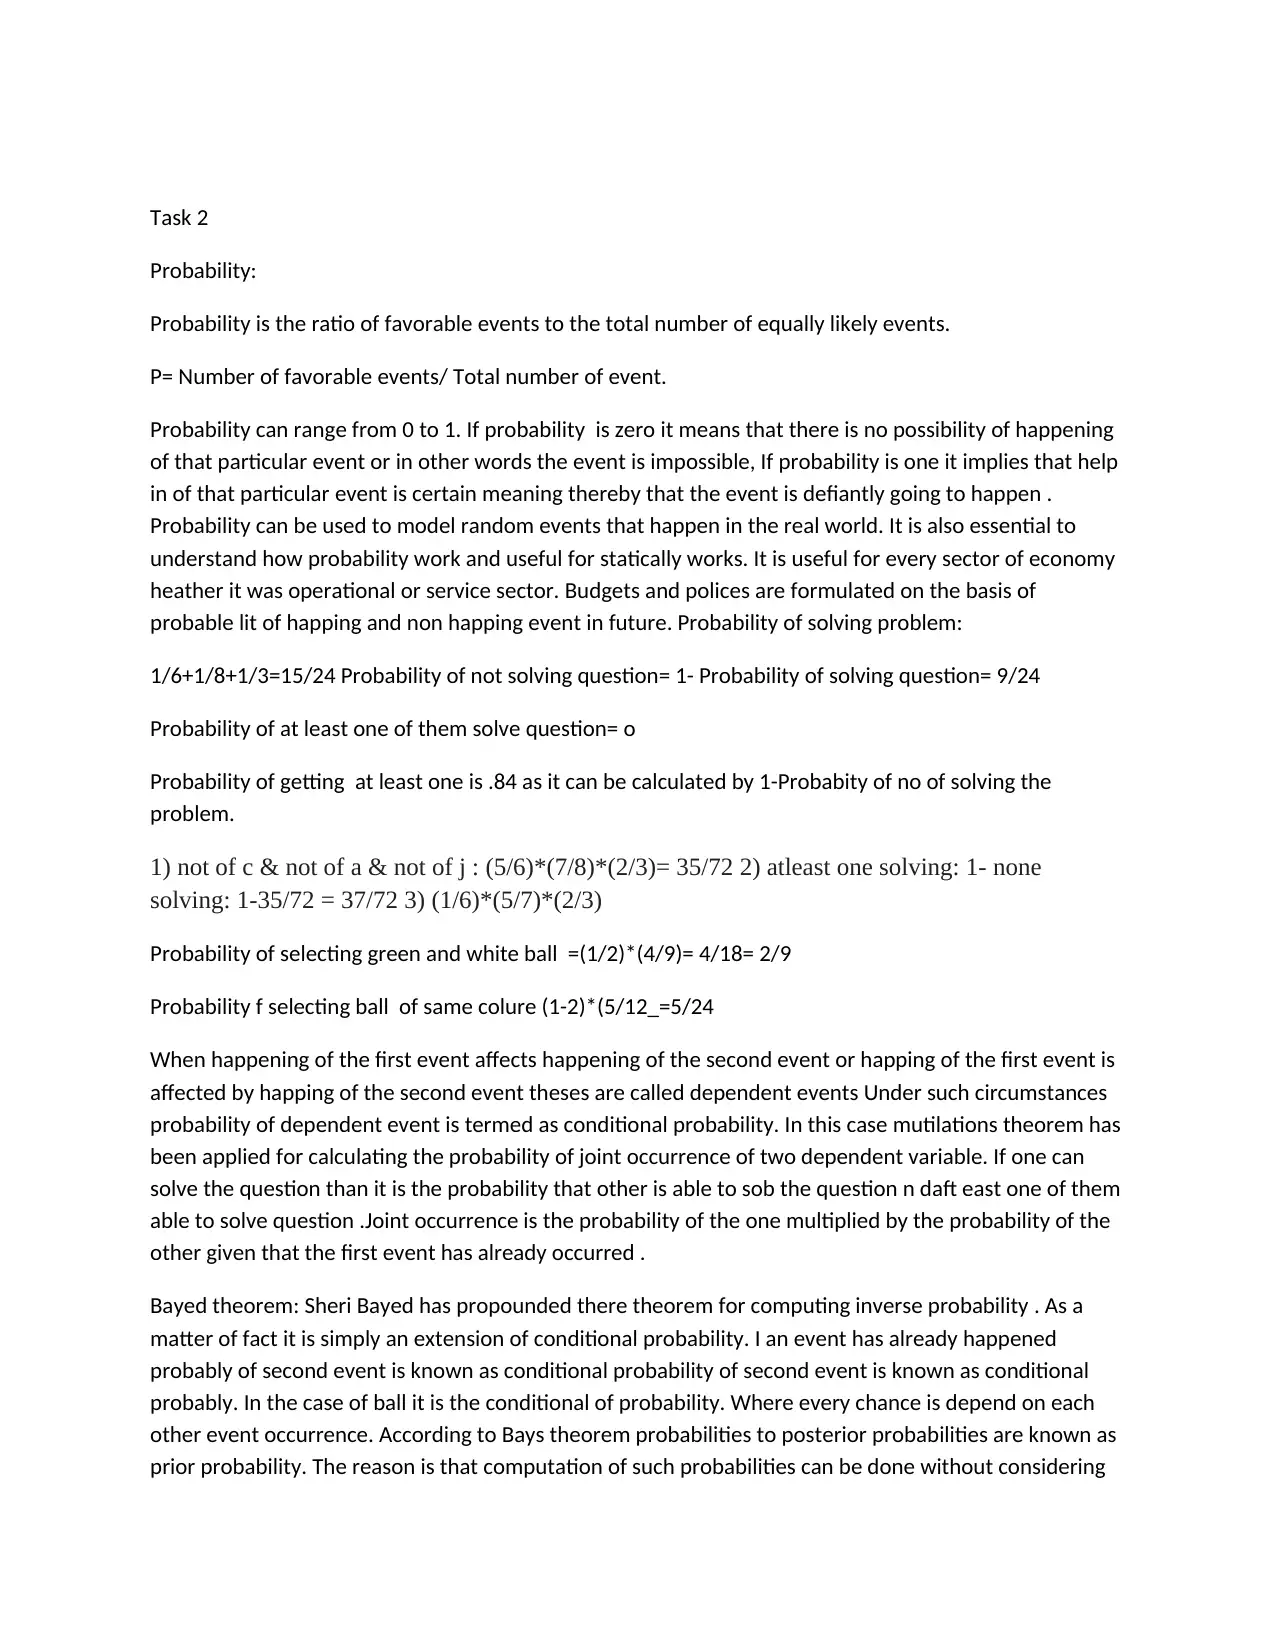
Task 2
Probability:
Probability is the ratio of favorable events to the total number of equally likely events.
P= Number of favorable events/ Total number of event.
Probability can range from 0 to 1. If probability is zero it means that there is no possibility of happening
of that particular event or in other words the event is impossible, If probability is one it implies that help
in of that particular event is certain meaning thereby that the event is defiantly going to happen .
Probability can be used to model random events that happen in the real world. It is also essential to
understand how probability work and useful for statically works. It is useful for every sector of economy
heather it was operational or service sector. Budgets and polices are formulated on the basis of
probable lit of happing and non happing event in future. Probability of solving problem:
1/6+1/8+1/3=15/24 Probability of not solving question= 1- Probability of solving question= 9/24
Probability of at least one of them solve question= o
Probability of getting at least one is .84 as it can be calculated by 1-Probabity of no of solving the
problem.
1) not of c & not of a & not of j : (5/6)*(7/8)*(2/3)= 35/72 2) atleast one solving: 1- none
solving: 1-35/72 = 37/72 3) (1/6)*(5/7)*(2/3)
Probability of selecting green and white ball =(1/2)*(4/9)= 4/18= 2/9
Probability f selecting ball of same colure (1-2)*(5/12_=5/24
When happening of the first event affects happening of the second event or happing of the first event is
affected by happing of the second event theses are called dependent events Under such circumstances
probability of dependent event is termed as conditional probability. In this case mutilations theorem has
been applied for calculating the probability of joint occurrence of two dependent variable. If one can
solve the question than it is the probability that other is able to sob the question n daft east one of them
able to solve question .Joint occurrence is the probability of the one multiplied by the probability of the
other given that the first event has already occurred .
Bayed theorem: Sheri Bayed has propounded there theorem for computing inverse probability . As a
matter of fact it is simply an extension of conditional probability. I an event has already happened
probably of second event is known as conditional probability of second event is known as conditional
probably. In the case of ball it is the conditional of probability. Where every chance is depend on each
other event occurrence. According to Bays theorem probabilities to posterior probabilities are known as
prior probability. The reason is that computation of such probabilities can be done without considering
information about sample. As per the bays theorem . If a new sample is drawn these revised
probabilities. Posterior probabilities are conditional probabilities but these are can be calculated again.
QUESTION4
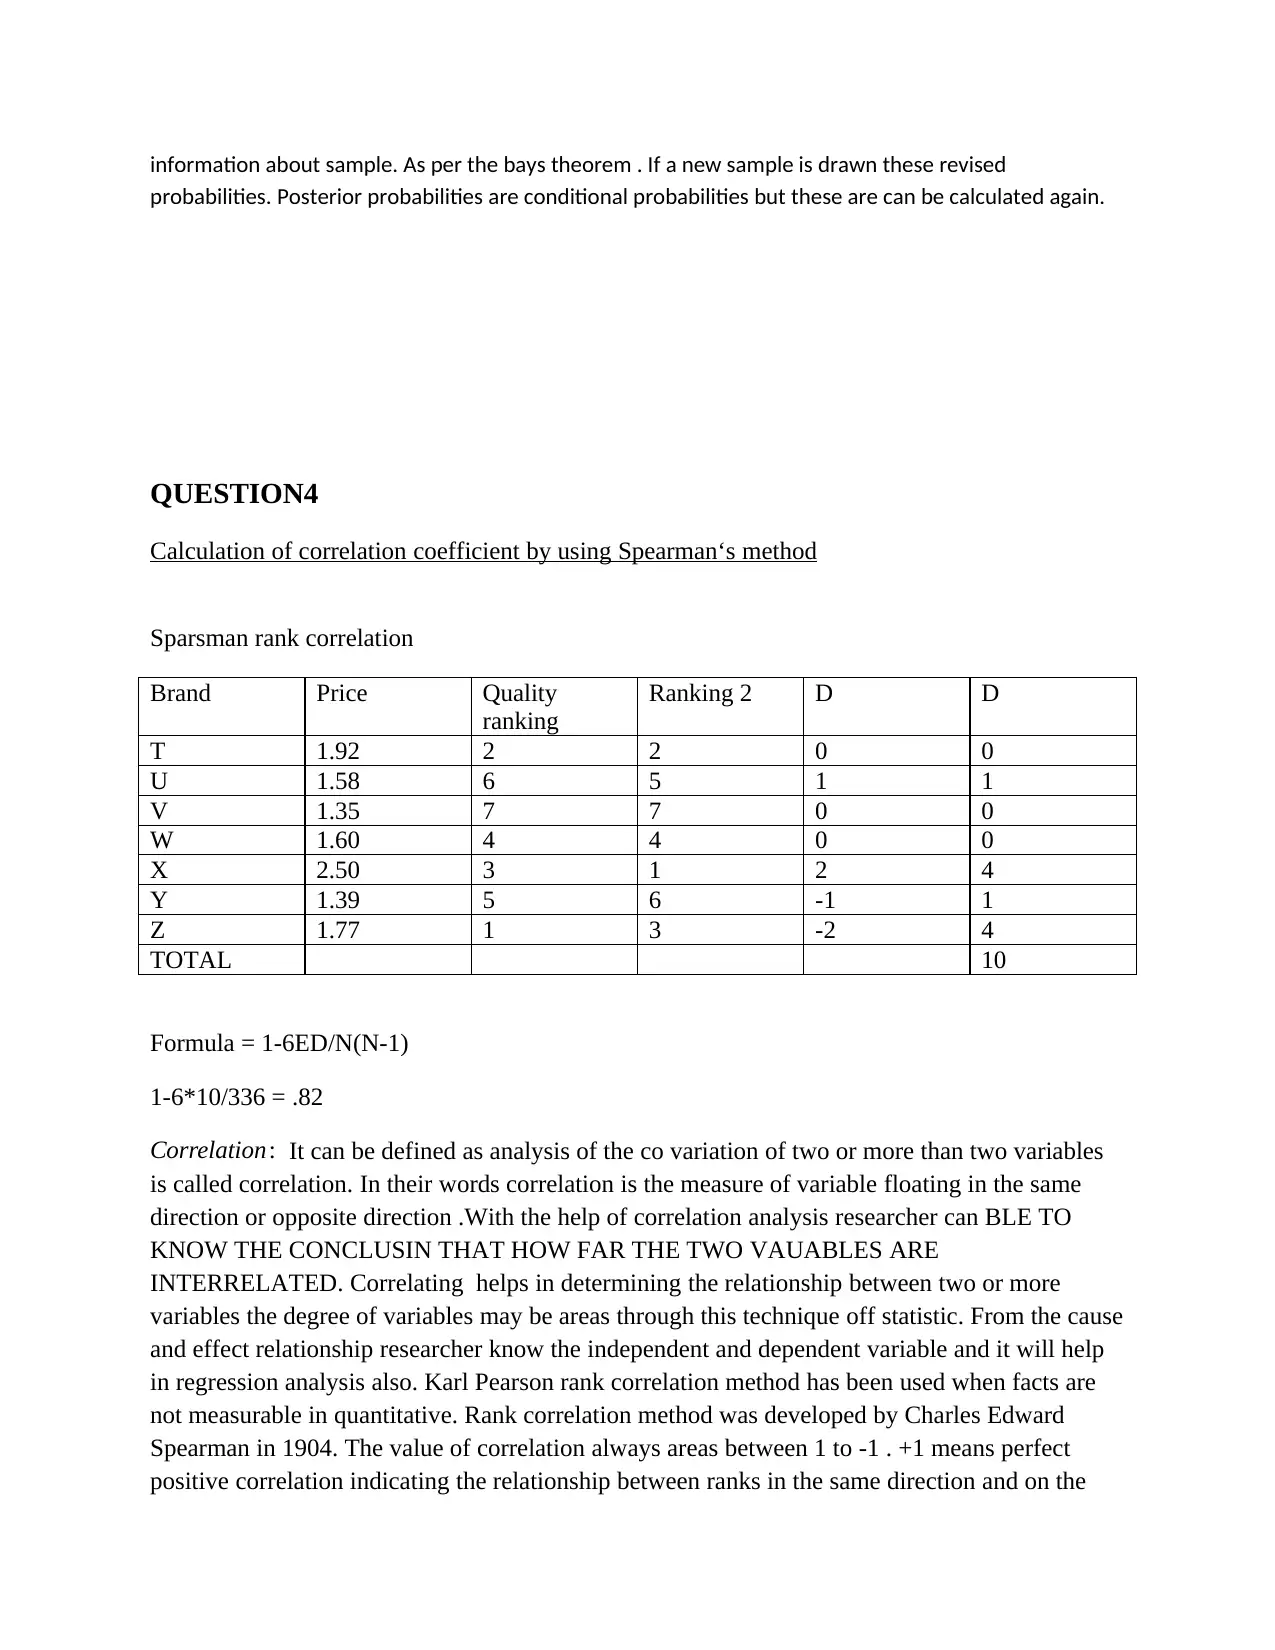
Calculation of correlation coefficient by using Spearman‘s method
Sparsman rank correlation
Brand Price Quality
ranking
Ranking 2 D D
T 1.92 2 2 0 0
U 1.58 6 5 1 1
V 1.35 7 7 0 0
W 1.60 4 4 0 0
X 2.50 3 1 2 4
Y 1.39 5 6 -1 1
Z 1.77 1 3 -2 4
TOTAL 10
Formula = 1-6ED/N(N-1)
1-6*10/336 = .82
Correlation: It can be defined as analysis of the co variation of two or more than two variables
is called correlation. In their words correlation is the measure of variable floating in the same
direction or opposite direction .With the help of correlation analysis researcher can BLE TO
KNOW THE CONCLUSIN THAT HOW FAR THE TWO VAUABLES ARE
INTERRELATED. Correlating helps in determining the relationship between two or more
variables the degree of variables may be areas through this technique off statistic. From the cause
and effect relationship researcher know the independent and dependent variable and it will help
in regression analysis also. Karl Pearson rank correlation method has been used when facts are
not measurable in quantitative. Rank correlation method was developed by Charles Edward
Spearman in 1904. The value of correlation always areas between 1 to -1 . +1 means perfect
positive correlation indicating the relationship between ranks in the same direction and on the
probabilities. Posterior probabilities are conditional probabilities but these are can be calculated again.
QUESTION4
Calculation of correlation coefficient by using Spearman‘s method
Sparsman rank correlation
Brand Price Quality
ranking
Ranking 2 D D
T 1.92 2 2 0 0
U 1.58 6 5 1 1
V 1.35 7 7 0 0
W 1.60 4 4 0 0
X 2.50 3 1 2 4
Y 1.39 5 6 -1 1
Z 1.77 1 3 -2 4
TOTAL 10
Formula = 1-6ED/N(N-1)
1-6*10/336 = .82
Correlation: It can be defined as analysis of the co variation of two or more than two variables
is called correlation. In their words correlation is the measure of variable floating in the same
direction or opposite direction .With the help of correlation analysis researcher can BLE TO
KNOW THE CONCLUSIN THAT HOW FAR THE TWO VAUABLES ARE
INTERRELATED. Correlating helps in determining the relationship between two or more
variables the degree of variables may be areas through this technique off statistic. From the cause
and effect relationship researcher know the independent and dependent variable and it will help
in regression analysis also. Karl Pearson rank correlation method has been used when facts are
not measurable in quantitative. Rank correlation method was developed by Charles Edward
Spearman in 1904. The value of correlation always areas between 1 to -1 . +1 means perfect
positive correlation indicating the relationship between ranks in the same direction and on the
⊘ This is a preview!⊘
Do you want full access?
Subscribe today to unlock all pages.
Trusted by 1+ million students worldwide
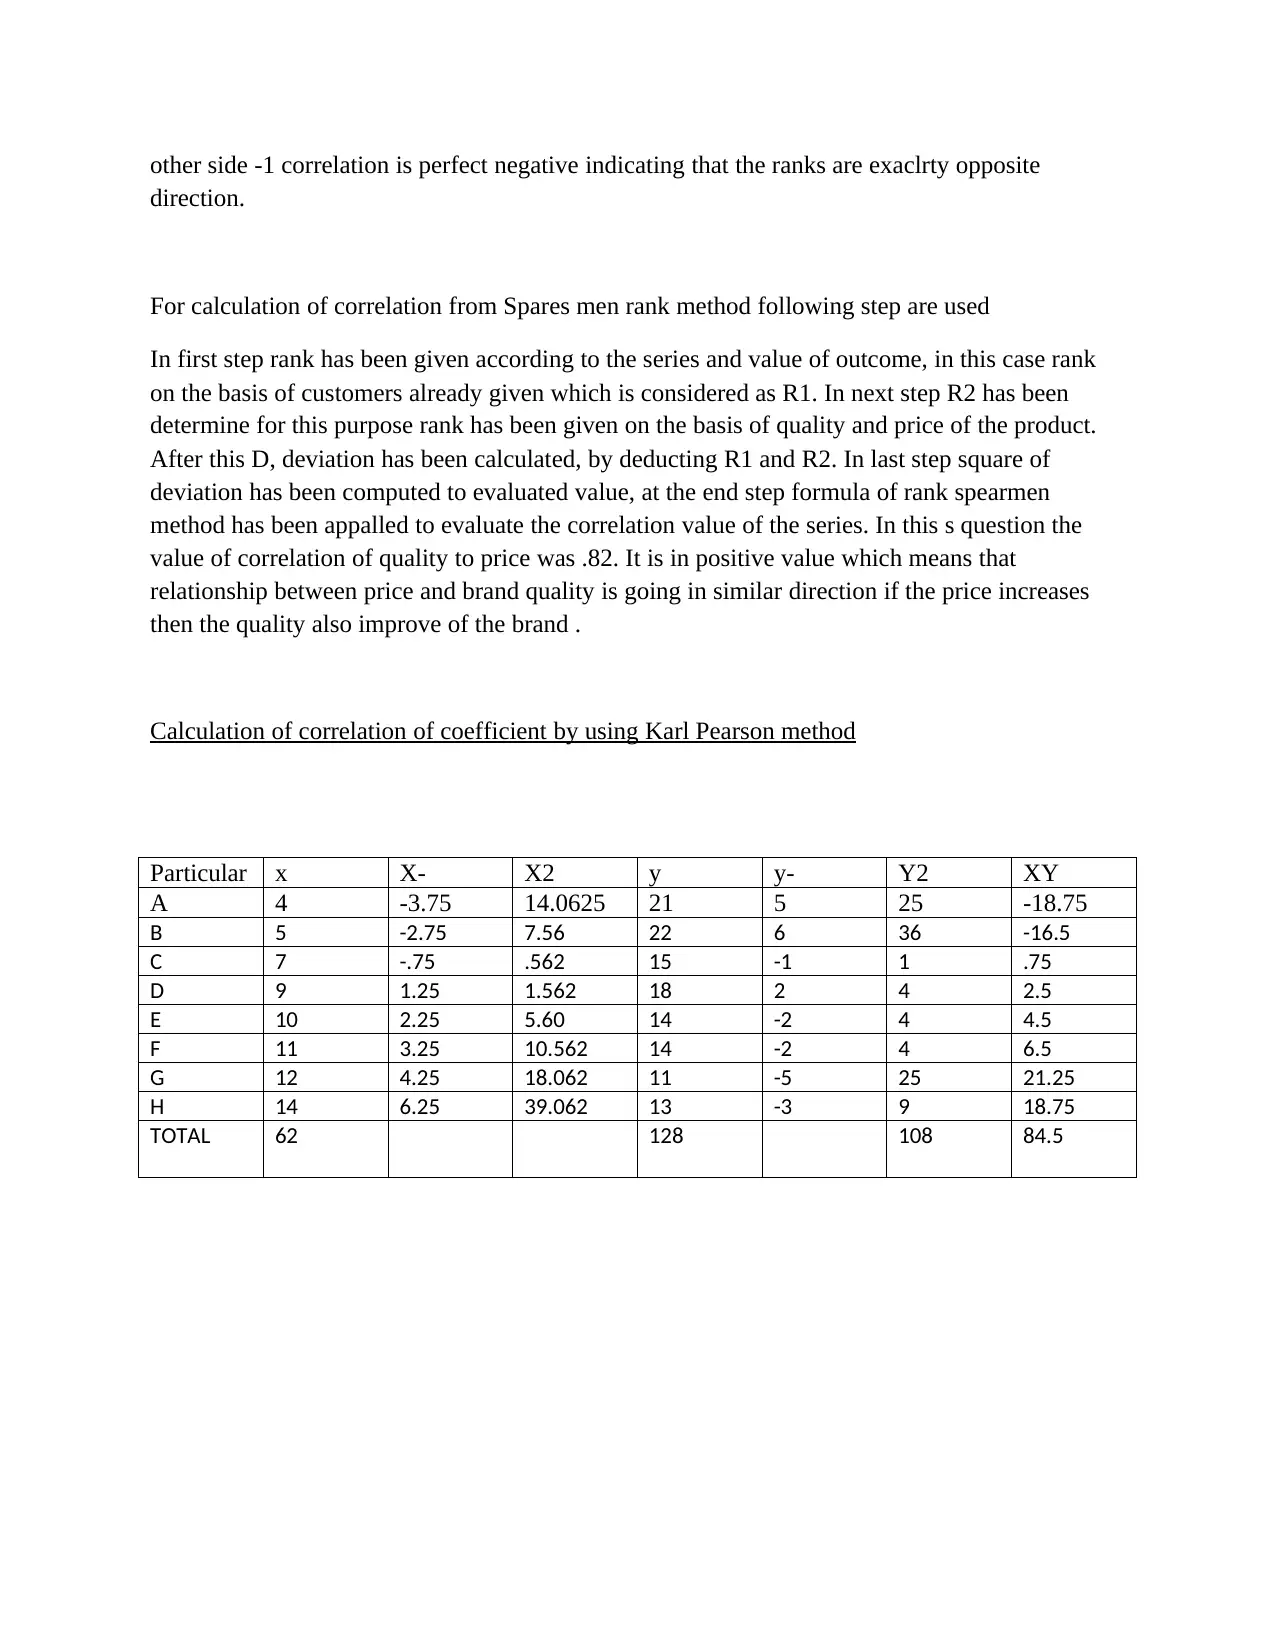
other side -1 correlation is perfect negative indicating that the ranks are exaclrty opposite
direction.
For calculation of correlation from Spares men rank method following step are used
In first step rank has been given according to the series and value of outcome, in this case rank
on the basis of customers already given which is considered as R1. In next step R2 has been
determine for this purpose rank has been given on the basis of quality and price of the product.
After this D, deviation has been calculated, by deducting R1 and R2. In last step square of
deviation has been computed to evaluated value, at the end step formula of rank spearmen
method has been appalled to evaluate the correlation value of the series. In this s question the
value of correlation of quality to price was .82. It is in positive value which means that
relationship between price and brand quality is going in similar direction if the price increases
then the quality also improve of the brand .
Calculation of correlation of coefficient by using Karl Pearson method
Particular x X- X2 y y- Y2 XY
A 4 -3.75 14.0625 21 5 25 -18.75
B 5 -2.75 7.56 22 6 36 -16.5
C 7 -.75 .562 15 -1 1 .75
D 9 1.25 1.562 18 2 4 2.5
E 10 2.25 5.60 14 -2 4 4.5
F 11 3.25 10.562 14 -2 4 6.5
G 12 4.25 18.062 11 -5 25 21.25
H 14 6.25 39.062 13 -3 9 18.75
TOTAL 62 128 108 84.5
Paraphrase This Document
Need a fresh take? Get an instant paraphrase of this document with our AI Paraphraser
REFRENCES
Books and journal
Torabi, S.A., Giahi, R. and Sahebjamnia, N., 2016. An enhanced risk assessment framework for
business continuity management systems. Safety science, 89, pp.201-218.
Baroni, P., Romano, M., Toni, F., Aurisicchio, M. and Bertanza, G., 2015. Automatic evaluation
of design alternatives with quantitative argumentation. Argument & Computation, 6(1), pp.24-
49.
Bettis, R., Gambardella, A., Helfat, C. and Mitchell, W., 2014. Quantitative empirical analysis in
strategic management. Strategic management journal, 35(7), pp.949-953.
Cassar, G., Ittner, C.D. and Cavalluzzo, K.S., 2015. Alternative information sources and
information asymmetry reduction: Evidence from small business debt. Journal of Accounting
and Economics, 59(2-3), pp.242-263.
Purda, L. and Skillicorn, D., 2015. Accounting variables, deception, and a bag of words:
Assessing the tools of fraud detection. Contemporary Accounting Research, 32(3), pp.1193-
1223.
1 out of 11
Related Documents


Your All-in-One AI-Powered Toolkit for Academic Success.
+13062052269
info@desklib.com
Available 24*7 on WhatsApp / Email
![[object Object]](/_next/static/media/star-bottom.7253800d.svg)
Unlock your academic potential
Copyright © 2020–2026 A2Z Services. All Rights Reserved. Developed and managed by ZUCOL.