Quantitative Methods Module 12: Summarizing and Arranging Data
VerifiedAdded on 2023/03/30
|7
|321
|328
Homework Assignment
AI Summary
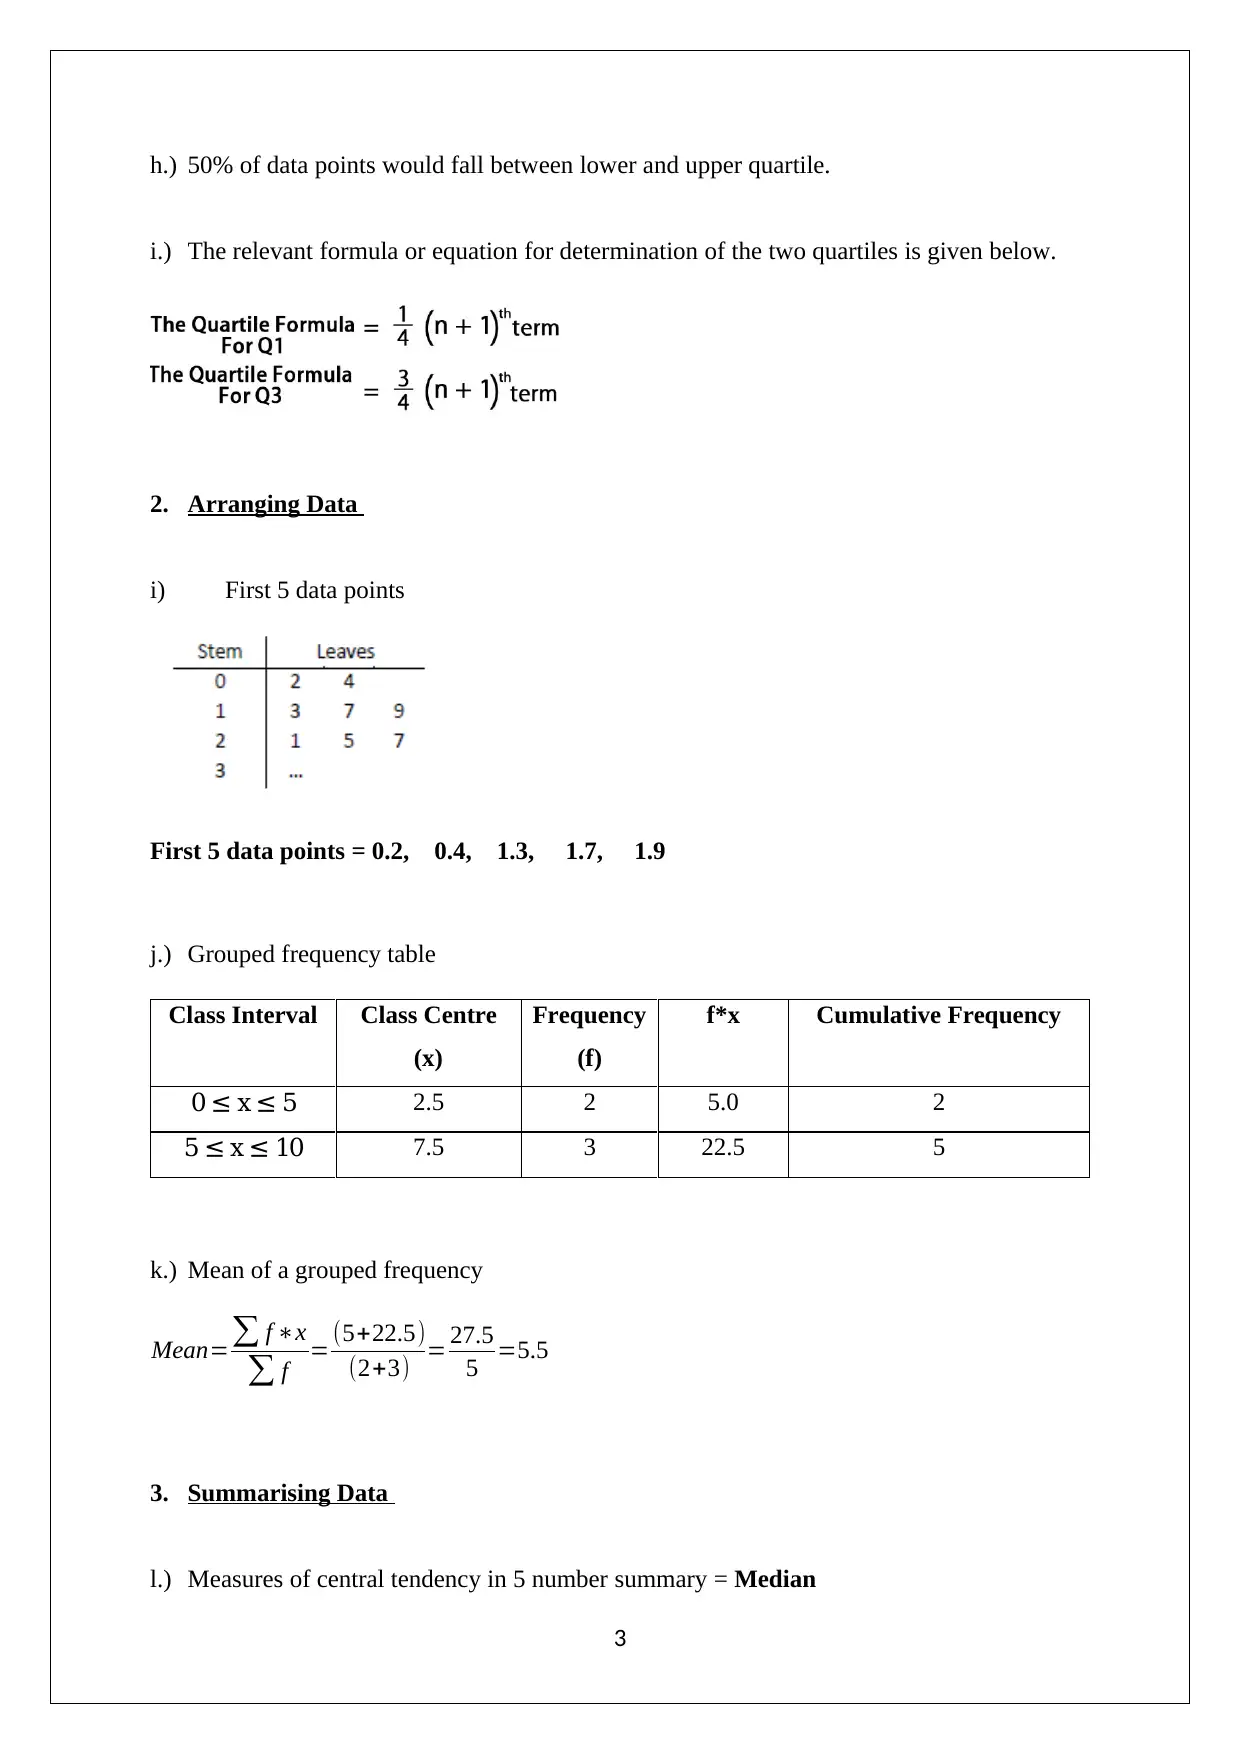
This assignment solution focuses on summarizing and arranging data using quantitative methods. It covers measures of central tendency such as mean, median, and mode, along with measures of spread like range and quartiles. The solution demonstrates how to locate the median and quartiles for a large data set, and explains how to find the median when it falls between two data points. Furthermore, it includes arranging data using a stem and leaf plot, creating a grouped frequency table, and calculating the mean of a grouped frequency. The assignment also explores the five-number summary, box and whisker plots, and frequency polygons, providing examples of uniform, symmetrical, normal, and skewed distributions. Students can use this solution to understand key concepts and improve their data analysis skills, and find more resources on Desklib.


1 out of 7
Related Documents


![Data Distributions Analysis: Statistics Assignment, [Course Name]](/_next/image/?url=https%3A%2F%2Fdesklib.com%2Fmedia%2Fimages%2Fuu%2F42f6c974036b4817b335bd03dd867b20.jpg&w=256&q=75)


Your All-in-One AI-Powered Toolkit for Academic Success.
+13062052269
info@desklib.com
Available 24*7 on WhatsApp / Email
![[object Object]](/_next/static/media/star-bottom.7253800d.svg)
Copyright © 2020–2026 A2Z Services. All Rights Reserved. Developed and managed by ZUCOL.