Quantitative Report: SPSS Analysis
VerifiedAdded on 2020/10/23
|23
|3059
|104
Report
AI Summary
This report presents a detailed analysis using SPSS, focusing on ANOVA and regression techniques. It includes hypotheses, data analysis, results, and conclusions drawn from statistical evaluations. The report aims to assess the relationships between various dependent and independent variables, providing insights into the impact of different factors on performance metrics.
Quantitative Report: SPSS
Paraphrase This Document
Need a fresh take? Get an instant paraphrase of this document with our AI Paraphraser
TABLE OF CONTENTS
Q.2 ANOVA analysis..................................................................................................................3
Aim and hypothesis.....................................................................................................................3
Data analysis................................................................................................................................3
Results and conclusion................................................................................................................3
Q.3 Correlation and regression....................................................................................................4
Aim and hypothesis:....................................................................................................................4
Data analysis:...............................................................................................................................5
Results and conclusion................................................................................................................5
APPENDIX....................................................................................................................................12
QUESTION 2................................................................................................................................12
2.1..............................................................................................................................................12
2.2..............................................................................................................................................12
2.3..............................................................................................................................................15
QUESTION 3................................................................................................................................16
3.1..............................................................................................................................................16
3.2..............................................................................................................................................18
3.3..............................................................................................................................................21
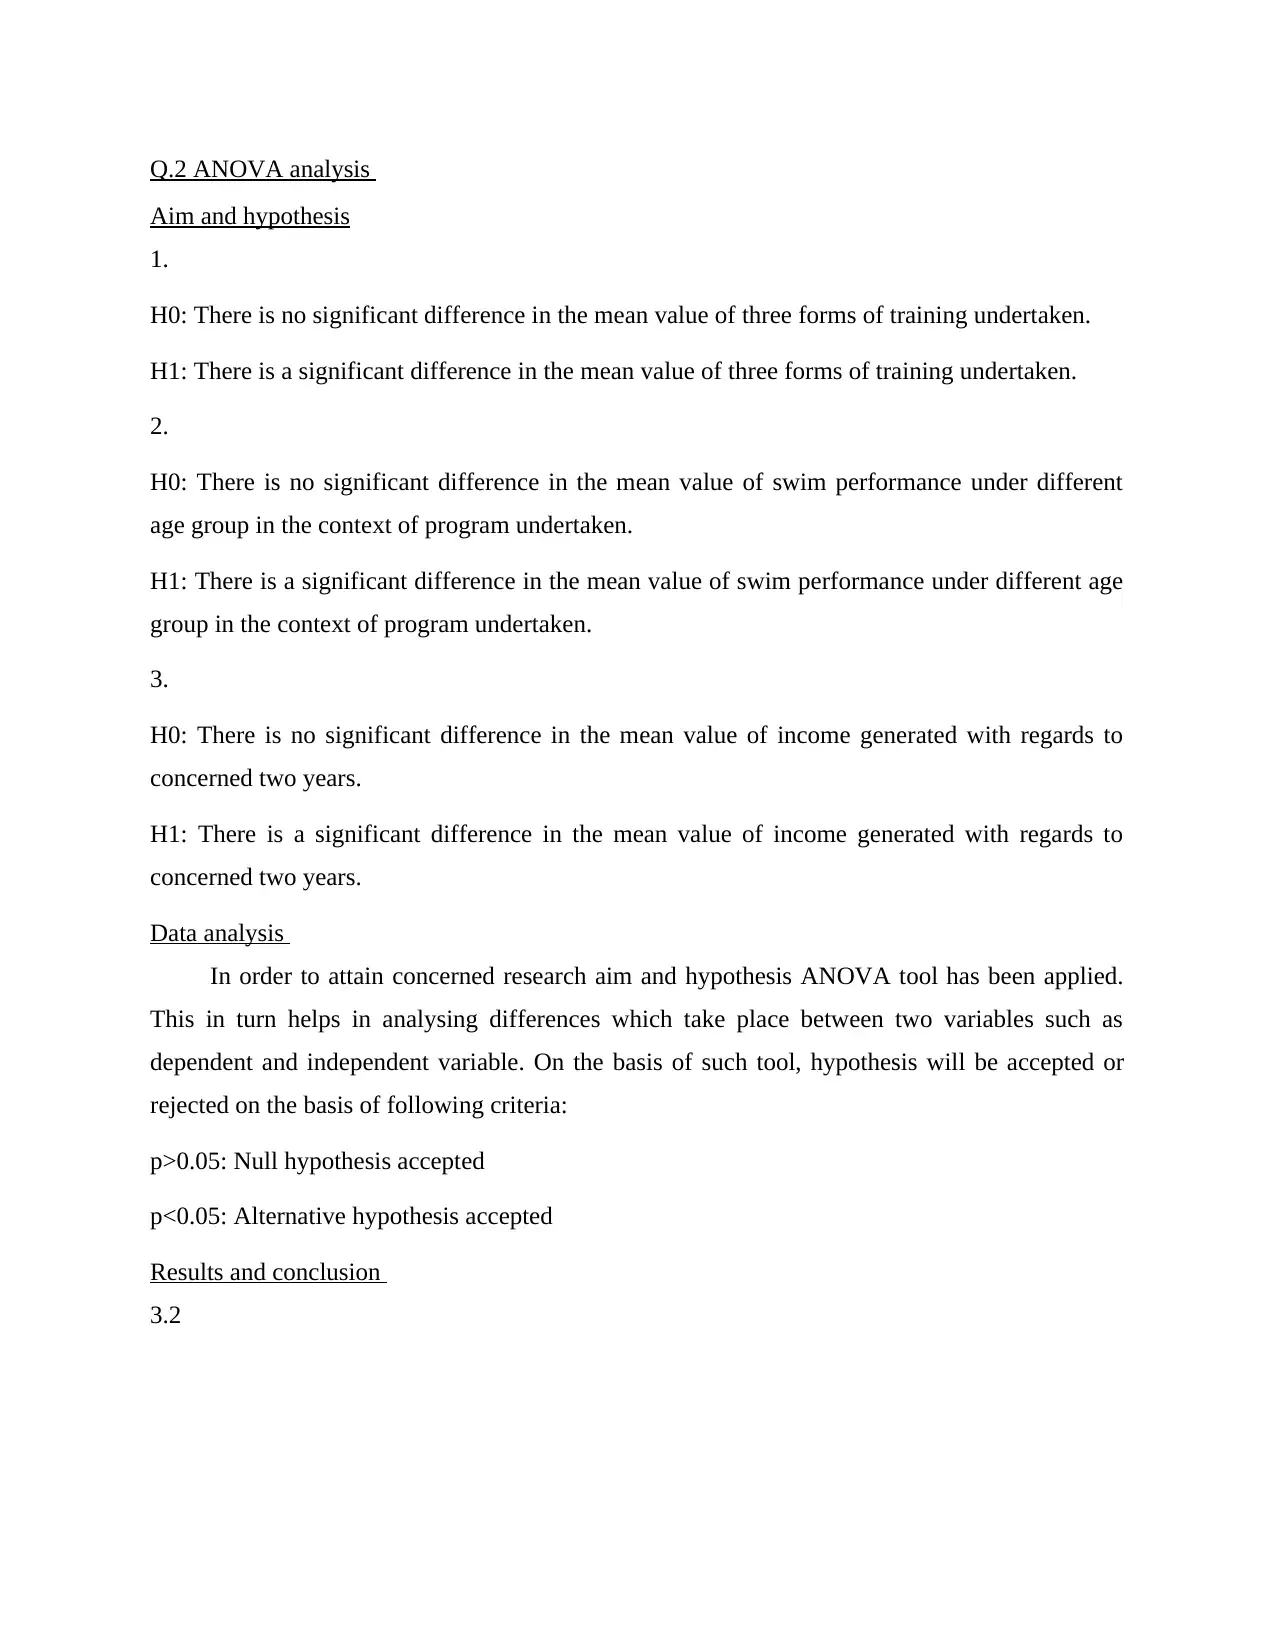
Q.2 ANOVA analysis
Aim and hypothesis
1.
H0: There is no significant difference in the mean value of three forms of training undertaken.
H1: There is a significant difference in the mean value of three forms of training undertaken.
2.
H0: There is no significant difference in the mean value of swim performance under different
age group in the context of program undertaken.
H1: There is a significant difference in the mean value of swim performance under different age
group in the context of program undertaken.
3.
H0: There is no significant difference in the mean value of income generated with regards to
concerned two years.
H1: There is a significant difference in the mean value of income generated with regards to
concerned two years.
Data analysis
In order to attain concerned research aim and hypothesis ANOVA tool has been applied.
This in turn helps in analysing differences which take place between two variables such as
dependent and independent variable. On the basis of such tool, hypothesis will be accepted or
rejected on the basis of following criteria:
p>0.05: Null hypothesis accepted
p<0.05: Alternative hypothesis accepted
Results and conclusion
3.2
⊘ This is a preview!⊘
Do you want full access?
Subscribe today to unlock all pages.
Trusted by 1+ million students worldwide

Interpretation: Outcome of statistical evaluation shows that p>0.05 which in turn clearly
exhibits that alternative hypothesis is false. However, different programs undertaken (1, 2 and 3)
have significant influence on swim performance of people falling under the age group of 34-42
years.
3.3
ANOVA
exhibits that alternative hypothesis is false. However, different programs undertaken (1, 2 and 3)
have significant influence on swim performance of people falling under the age group of 34-42
years.
3.3
ANOVA
Paraphrase This Document
Need a fresh take? Get an instant paraphrase of this document with our AI Paraphraser
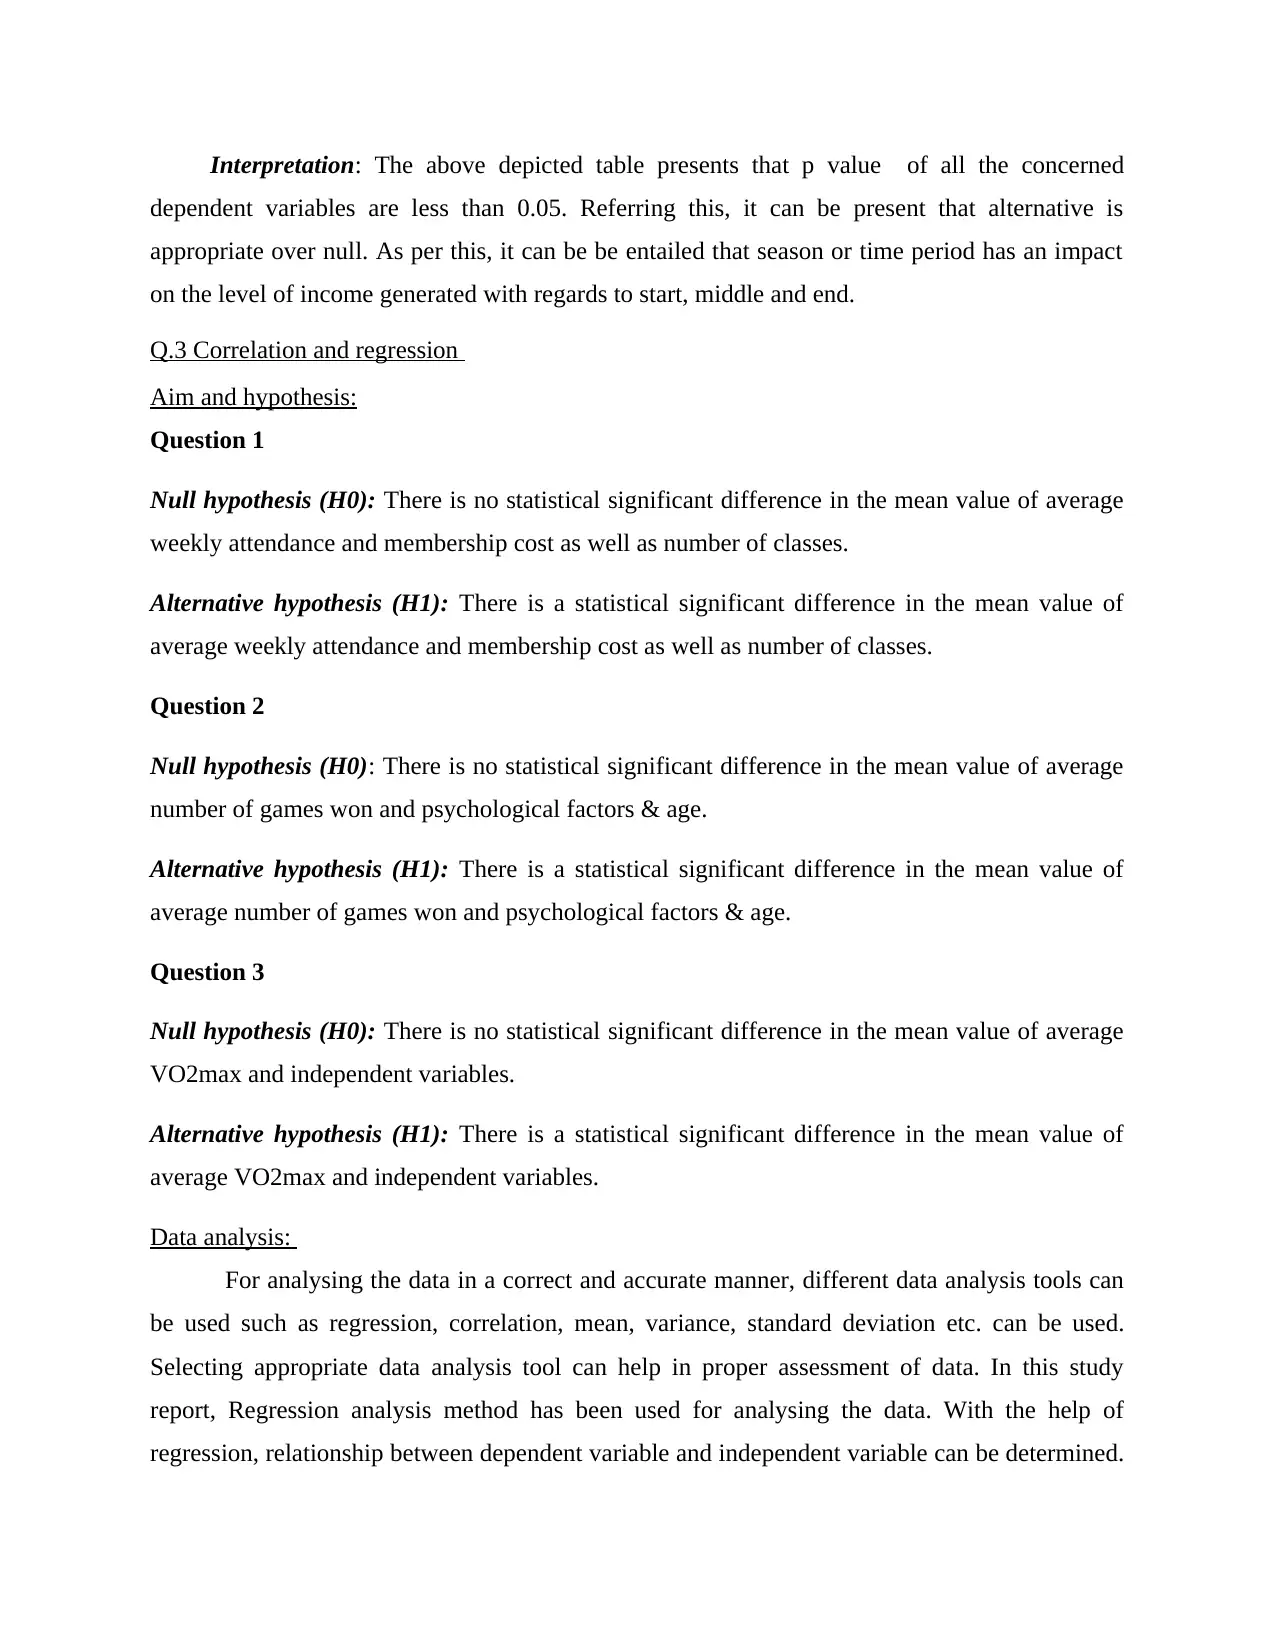
Interpretation: The above depicted table presents that p value of all the concerned
dependent variables are less than 0.05. Referring this, it can be present that alternative is
appropriate over null. As per this, it can be be entailed that season or time period has an impact
on the level of income generated with regards to start, middle and end.
Q.3 Correlation and regression
Aim and hypothesis:
Question 1
Null hypothesis (H0): There is no statistical significant difference in the mean value of average
weekly attendance and membership cost as well as number of classes.
Alternative hypothesis (H1): There is a statistical significant difference in the mean value of
average weekly attendance and membership cost as well as number of classes.
Question 2
Null hypothesis (H0): There is no statistical significant difference in the mean value of average
number of games won and psychological factors & age.
Alternative hypothesis (H1): There is a statistical significant difference in the mean value of
average number of games won and psychological factors & age.
Question 3
Null hypothesis (H0): There is no statistical significant difference in the mean value of average
VO2max and independent variables.
Alternative hypothesis (H1): There is a statistical significant difference in the mean value of
average VO2max and independent variables.
Data analysis:
For analysing the data in a correct and accurate manner, different data analysis tools can
be used such as regression, correlation, mean, variance, standard deviation etc. can be used.
Selecting appropriate data analysis tool can help in proper assessment of data. In this study
report, Regression analysis method has been used for analysing the data. With the help of
regression, relationship between dependent variable and independent variable can be determined.
It is a statistical process which helps in assessing as well as examining the relationship between a
dependent variable and two or more independent variable. For this report, regression analysis
technique is best appropriate.
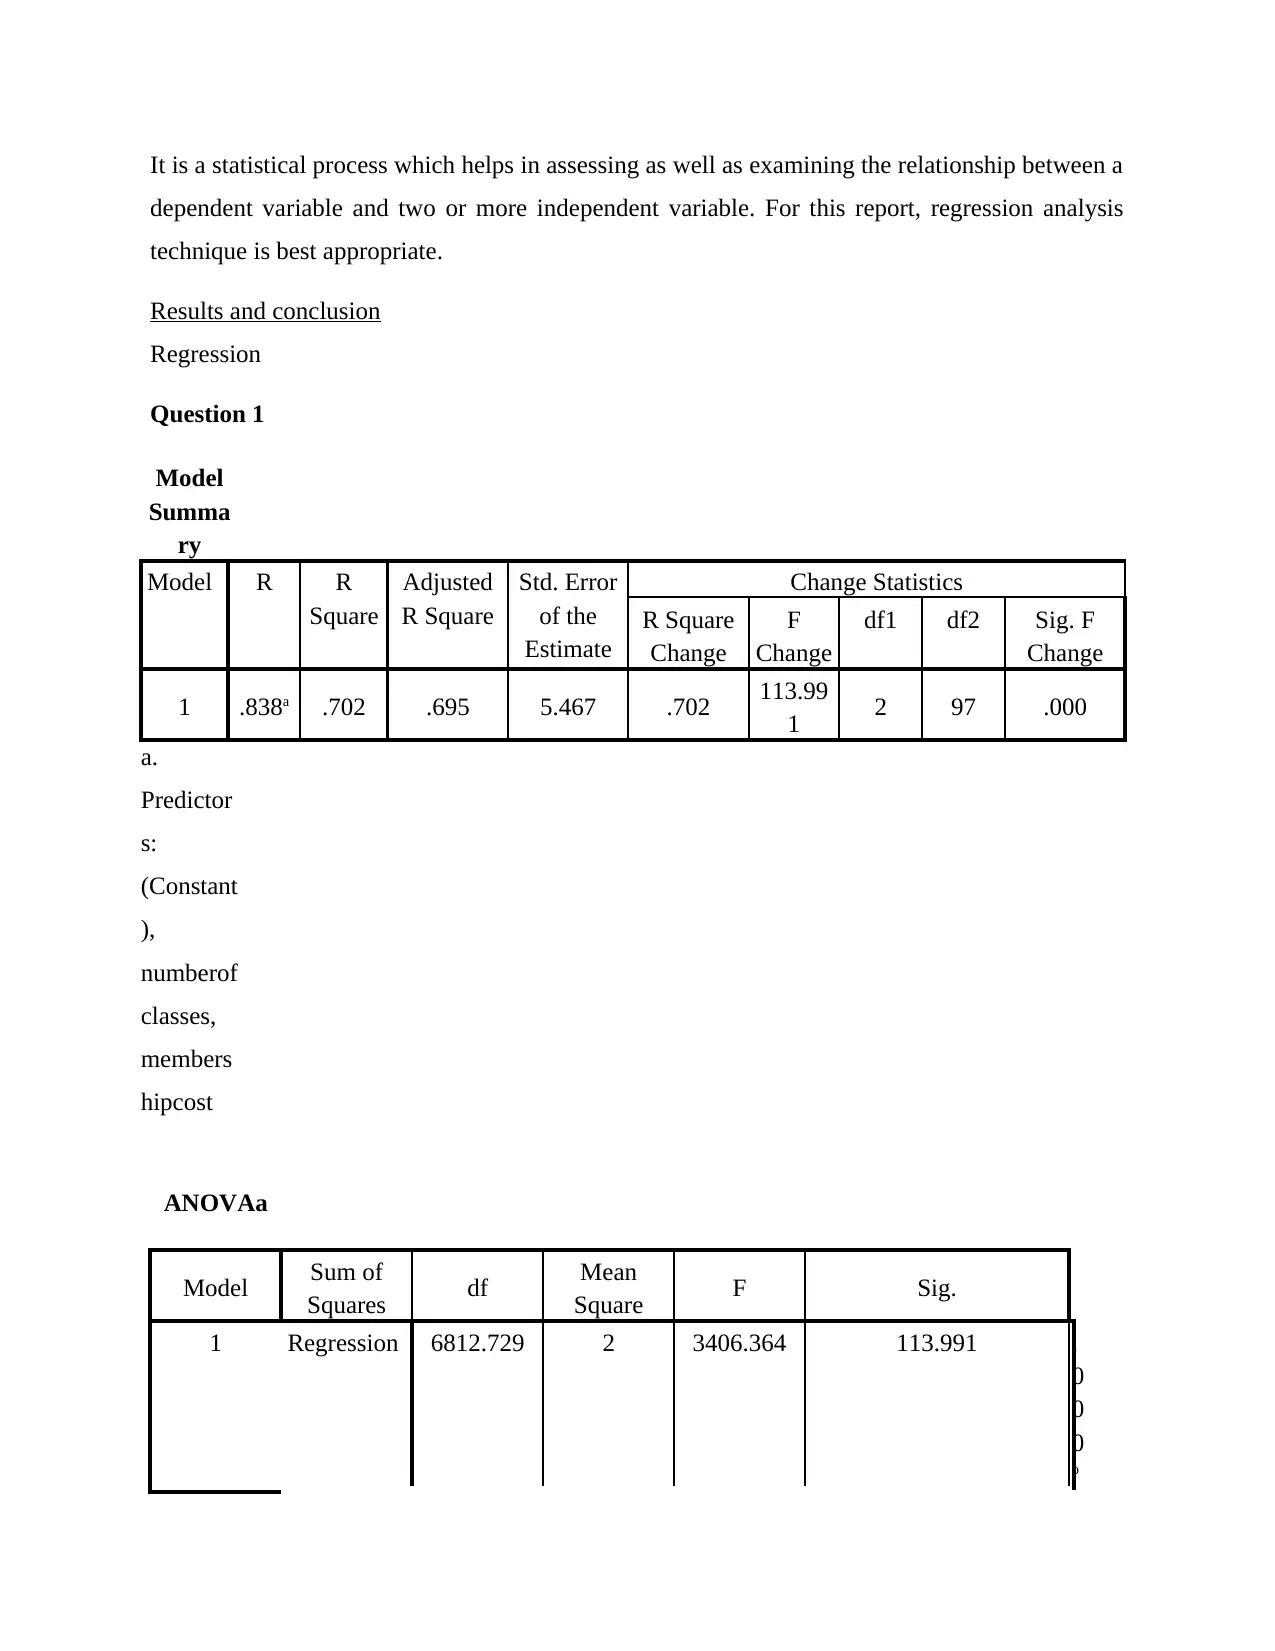
Results and conclusion
Regression
Question 1
Model
Summa
ry
Model R R
Square
Adjusted
R Square
Std. Error
of the
Estimate
Change Statistics
R Square
Change
F
Change
df1 df2 Sig. F
Change
1 .838a .702 .695 5.467 .702 113.99
1 2 97 .000
a.
Predictor
s:
(Constant
),
numberof
classes,
members
hipcost
ANOVAa
Model Sum of
Squares df Mean
Square F Sig.
1 Regression 6812.729 2 3406.364 113.991 .
0
0
0
b
dependent variable and two or more independent variable. For this report, regression analysis
technique is best appropriate.
Results and conclusion
Regression
Question 1
Model
Summa
ry
Model R R
Square
Adjusted
R Square
Std. Error
of the
Estimate
Change Statistics
R Square
Change
F
Change
df1 df2 Sig. F
Change
1 .838a .702 .695 5.467 .702 113.99
1 2 97 .000
a.
Predictor
s:
(Constant
),
numberof
classes,
members
hipcost
ANOVAa
Model Sum of
Squares df Mean
Square F Sig.
1 Regression 6812.729 2 3406.364 113.991 .
0
0
0
b
⊘ This is a preview!⊘
Do you want full access?
Subscribe today to unlock all pages.
Trusted by 1+ million students worldwide
Residual 2898.619 97 29.883
Total 9711.348 99
a.
Dependent
Variable:
averageweek
lyattendance
b.
Predictors:
(Constant),
numberofcla
sses,
membership
cost
Interpretation: From the above data analysis done by regression method, it can be
assessed that the average weekly attendance of the gym member is a dependent variable. This
dependent variable is depending on the factors viz. number of gym classes and the membership
cost of joining the gym. The regression value determined is 0.838 which shows that dependent
variable is depending on independent one. From regression value it can be identified that
variables are highly correlated to each other. It shows the influences of one or more independent
variables i.e. membership cost of gym and number of classes of gym on a single dependent
variable. With the help of R square, change in one factor brings what level of change in another
can be studied. The value of R square calculated is 0.702 which depicts that by changing the cost
or membership fees of gym and by increasing the number of gym classes, the average weekly
attendance of gym members can be improved. The Significance Value also known as P value
calculated is 0.000. This value is calculated by taking confidence level at 95 %. The significance
value calculated i.e. 0.000 is less than 0.05, therefore Alternative Hypothesis is accepted and null
hypothesis is rejected.
Conclusion: From the above data analysis, it can be concluded that regression value is
0.838. This shows that there is a good relationship between the dependent and one or more
Paraphrase This Document
Need a fresh take? Get an instant paraphrase of this document with our AI Paraphraser
independent variables. For improving the condition of dependent variable, changes have to be
made in the present one or more independent variable. By decreasing the fees or cost of joining
the gym as a member i.e. membership amount can help the entity in improving the position of
dependent variable. The average weekly attendance of member can be increased or improved
either by making reduction in the value of membership cost or by increasing the number of gym
classes as compared to the earlier one. Membership cost should be decided at that amount which
can be afforded by each individual so as to seek the health care benefits by doing gyming. The
change in membership cost as well as number of gym classes can be bring change in the average
weekly attendance of gym member. This change can be studied with the help of R square data
analysis tool.
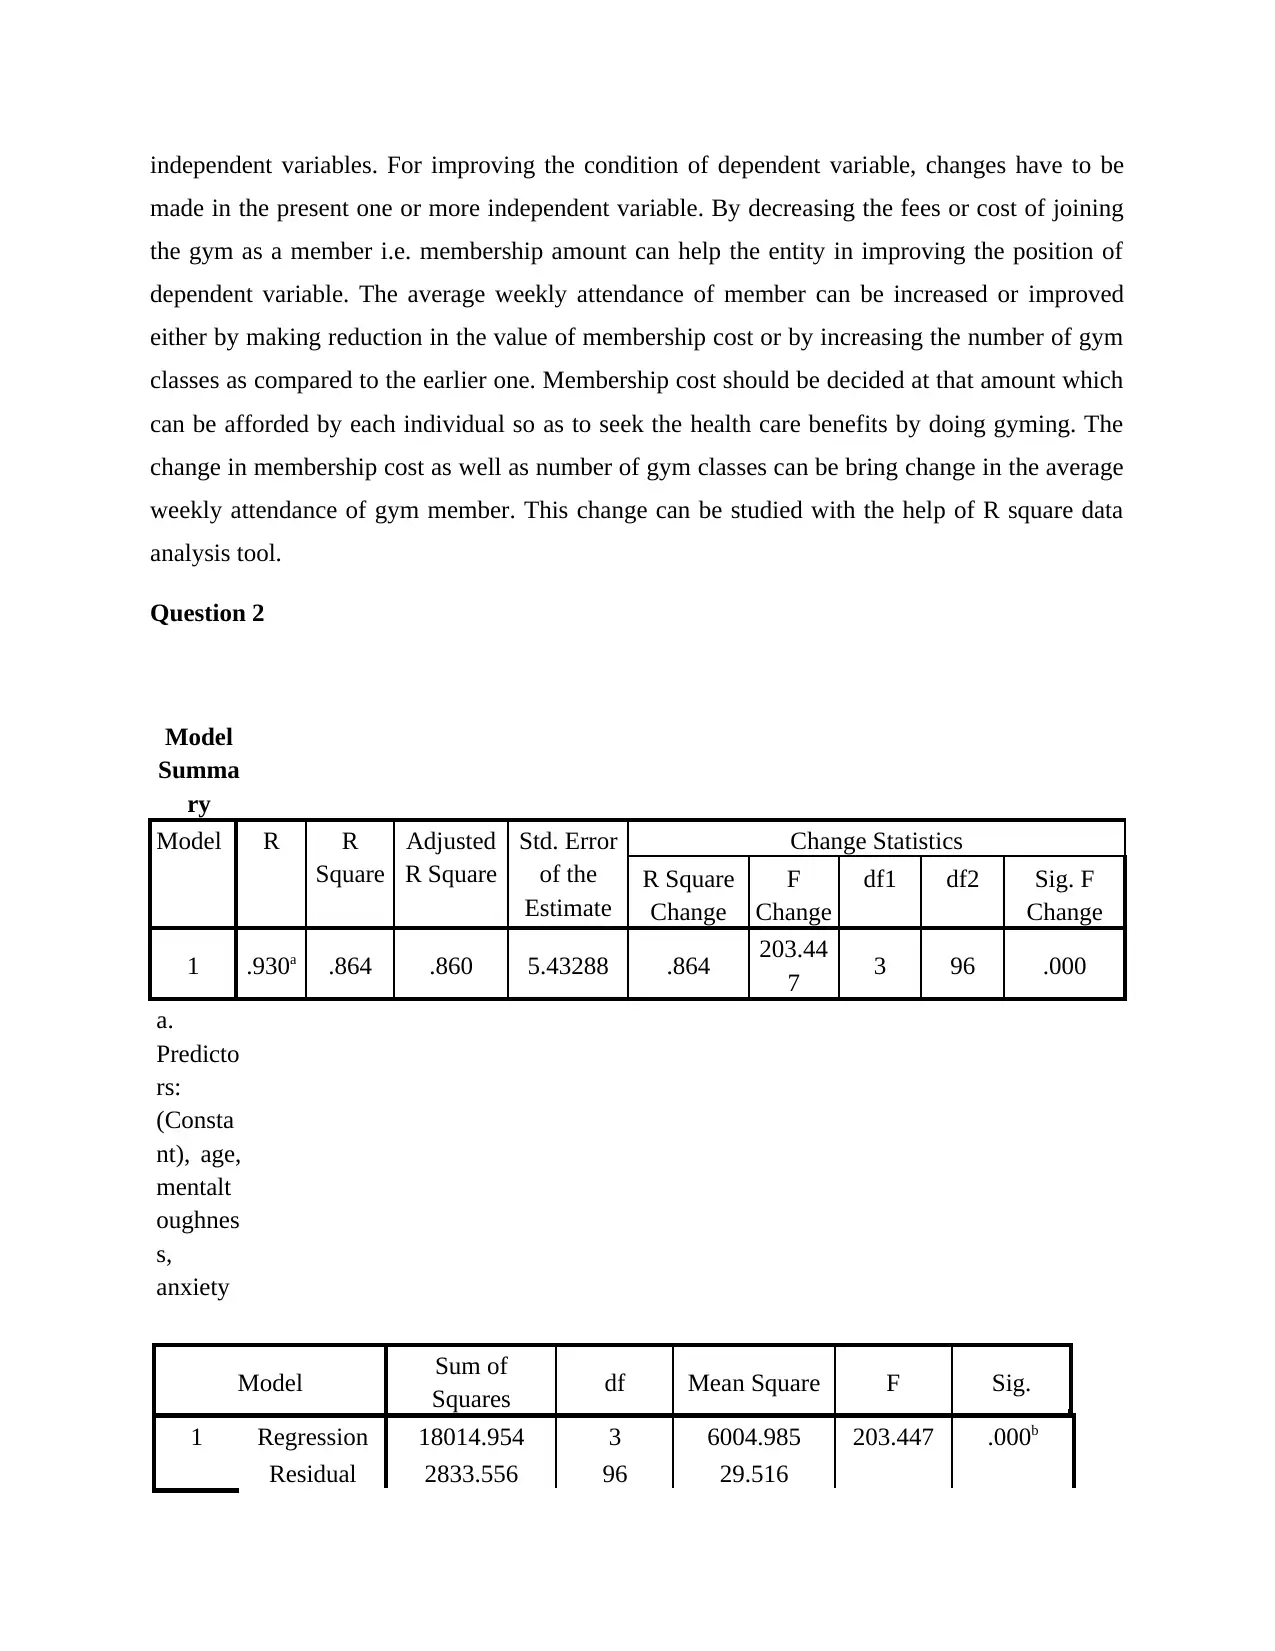
Question 2
Model
Summa
ry
Model R R
Square
Adjusted
R Square
Std. Error
of the
Estimate
Change Statistics
R Square
Change
F
Change
df1 df2 Sig. F
Change
1 .930a .864 .860 5.43288 .864 203.44
7 3 96 .000
a.
Predicto
rs:
(Consta
nt), age,
mentalt
oughnes
s,
anxiety
Model Sum of
Squares df Mean Square F Sig.
1 Regression 18014.954 3 6004.985 203.447 .000b
Residual 2833.556 96 29.516
made in the present one or more independent variable. By decreasing the fees or cost of joining
the gym as a member i.e. membership amount can help the entity in improving the position of
dependent variable. The average weekly attendance of member can be increased or improved
either by making reduction in the value of membership cost or by increasing the number of gym
classes as compared to the earlier one. Membership cost should be decided at that amount which
can be afforded by each individual so as to seek the health care benefits by doing gyming. The
change in membership cost as well as number of gym classes can be bring change in the average
weekly attendance of gym member. This change can be studied with the help of R square data
analysis tool.
Question 2
Model
Summa
ry
Model R R
Square
Adjusted
R Square
Std. Error
of the
Estimate
Change Statistics
R Square
Change
F
Change
df1 df2 Sig. F
Change
1 .930a .864 .860 5.43288 .864 203.44
7 3 96 .000
a.
Predicto
rs:
(Consta
nt), age,
mentalt
oughnes
s,
anxiety
Model Sum of
Squares df Mean Square F Sig.
1 Regression 18014.954 3 6004.985 203.447 .000b
Residual 2833.556 96 29.516
Total 20848.510 99
a.
Dependent
Variable:
performance
b.
Predictors:
(Constant),
age,
mentaltough
ness, anxiety
Interpretation: With the help of regression method of data analysis, it can be assessed
that the performance level helps in winning games. The dependent variable here is number of
games won on the basis of performance whereas the independent variable on which performance
depending includes Anxiety, Metal toughness and age factor of an individual tennis player. The
value of regression determined here is 0.930, from which it can be easily evaluate that dependent
variable is highly relies on the independent one. With high regression value it can be assessed
that variables are highly correlated to each other. It means that with the help of sound mental
fitness, good physic, strong anxiety level and adequate age can help in better performance in the
playground. This factors also helps in wining game. For good mental and physical health, players
should have a good intake of food. R square studies the level of change in one factor because of
change in another. The value of R square calculated is 0.864 which shows that with good
exercise, food intake and healthy lifestyle, players can win more games. The Significance Value
calculated is 0.000 which is less than 0.05, therefore Alternative Hypothesis is accepted.
Conclusion: From the analysis of data, it can be concluded there is a good relationship
between the dependent variable and its one or more independent variables. For improving the
condition of dependent variable, changes have to be made in the present one or more
independent variable. The performance level of individual player can be made better with proper
exercise, gyming, sports activities and other health related activities. Also, healthy and nutritious
⊘ This is a preview!⊘
Do you want full access?
Subscribe today to unlock all pages.
Trusted by 1+ million students worldwide
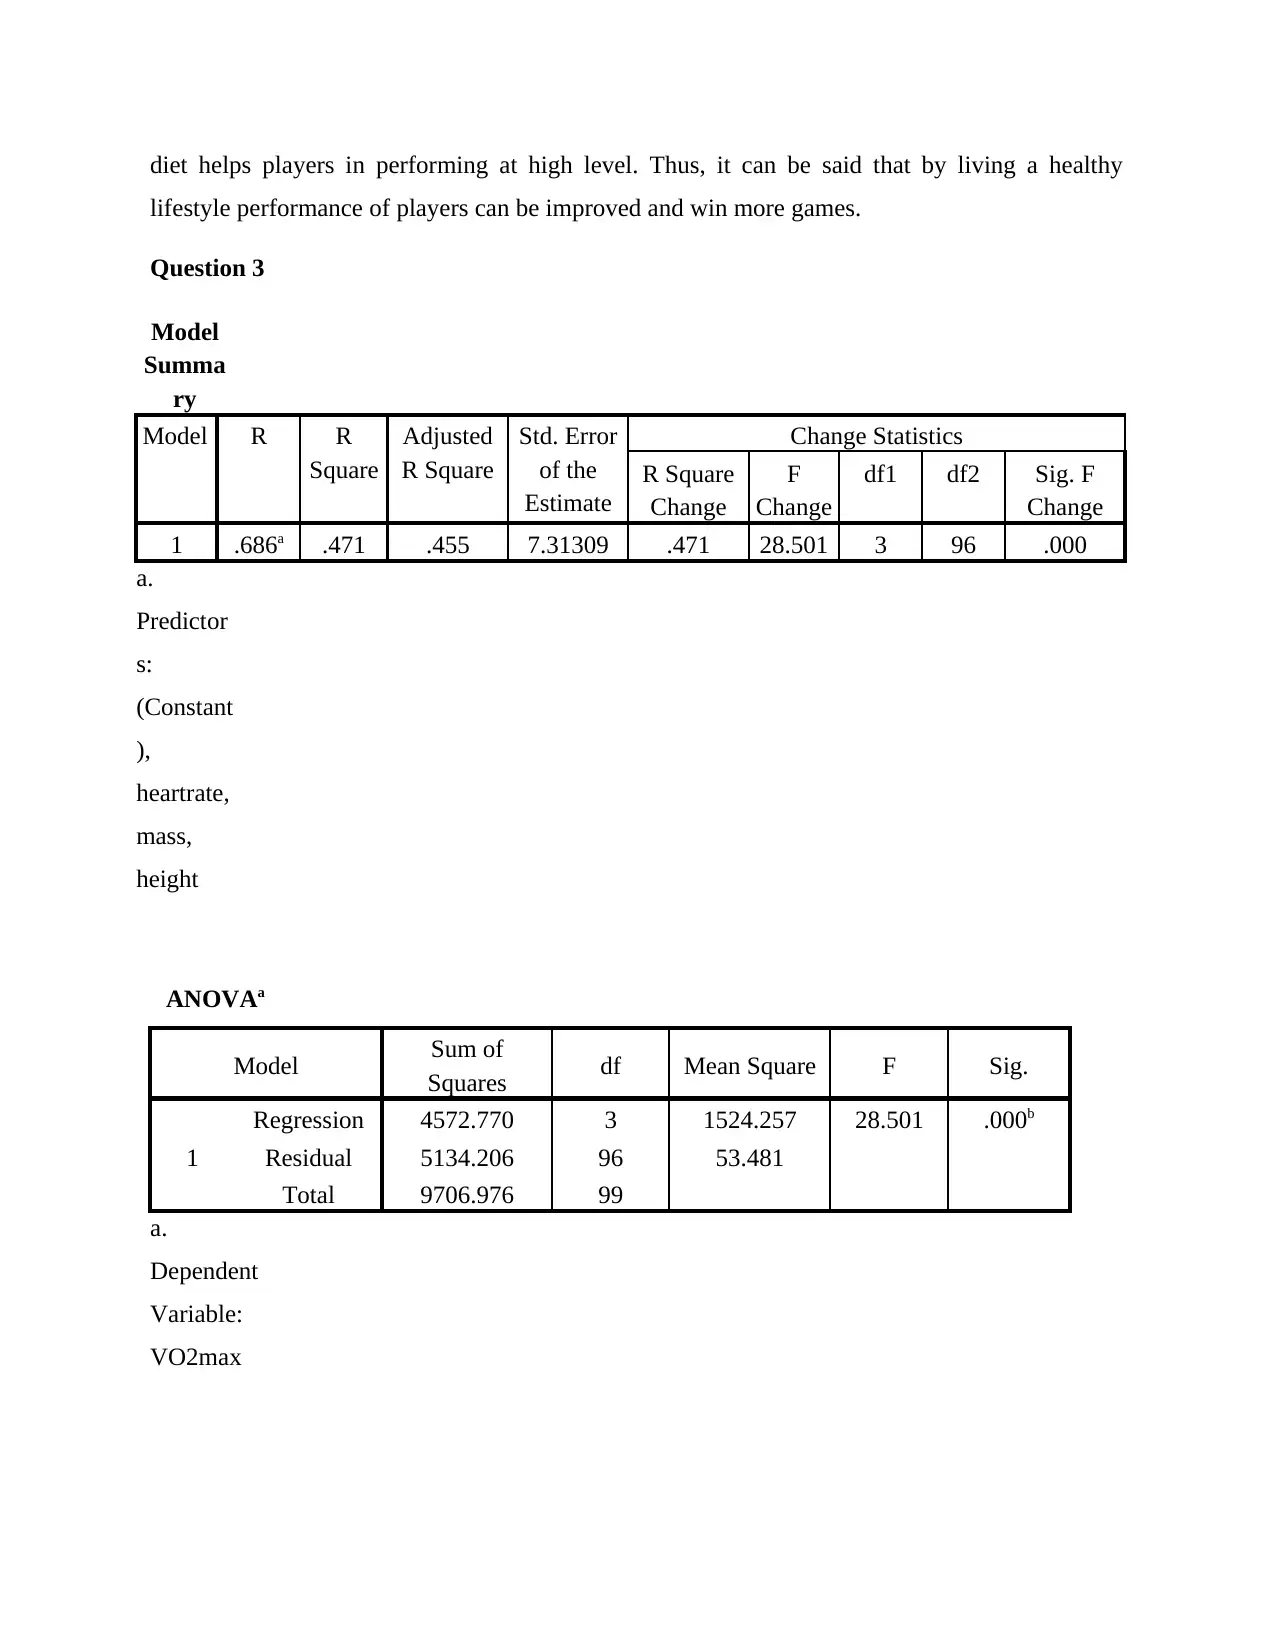
diet helps players in performing at high level. Thus, it can be said that by living a healthy
lifestyle performance of players can be improved and win more games.
Question 3
Model
Summa
ry
Model R R
Square
Adjusted
R Square
Std. Error
of the
Estimate
Change Statistics
R Square
Change
F
Change
df1 df2 Sig. F
Change
1 .686a .471 .455 7.31309 .471 28.501 3 96 .000
a.
Predictor
s:
(Constant
),
heartrate,
mass,
height
ANOVAa
Model Sum of
Squares df Mean Square F Sig.
1
Regression 4572.770 3 1524.257 28.501 .000b
Residual 5134.206 96 53.481
Total 9706.976 99
a.
Dependent
Variable:
VO2max
Paraphrase This Document
Need a fresh take? Get an instant paraphrase of this document with our AI Paraphraser
b. All
requested
variables
entered.
Interpretation: Regression analysis is used for making analysis of data. With such
analysis it has been identified that the VO2max is a dependent variable with the independent
variable including parameters such as Age, Height, Weight or Body Mass and Heart Rate of an
individual. The value of regression assessed is 0.686 from evaluation can be made that dependent
variable is relying on the independent one at same extent. It means that with the help of proper
intake of oxygen in the body, the mental and physical health of individual remains good. This
factors also helps better body functioning and heart performance. If an individual is a healthy
person, he will have good intake of oxygen amount. The value of R square calculated is 0.471
which shows that with sound body mass, weight, good exercise, food intake and healthy lifestyle,
individual can improve its oxygen intake. The Significance Value calculated is 0.000 which is
less than 0.05, therefore Alternative Hypothesis is accepted.
Conclusion: From the above data analysis, it can be concluded that body mass, age and
heart rate is related to the amount of oxygen taken in by the individual body. The dependent
variable is VO2max i.e. oxygen and independent variables are age, height, mass and heart rate.
For improving the dependent variable, changes have to be made in the present one or more
independent variable. The performance of heart and body can be done by having sufficient intake
of fresh oxygen with proper exercise, sports activities etc. Also, by having healthy and nutritious
diet will help in proper absorption of oxygen in the blood. It will result in overall health
improvement.
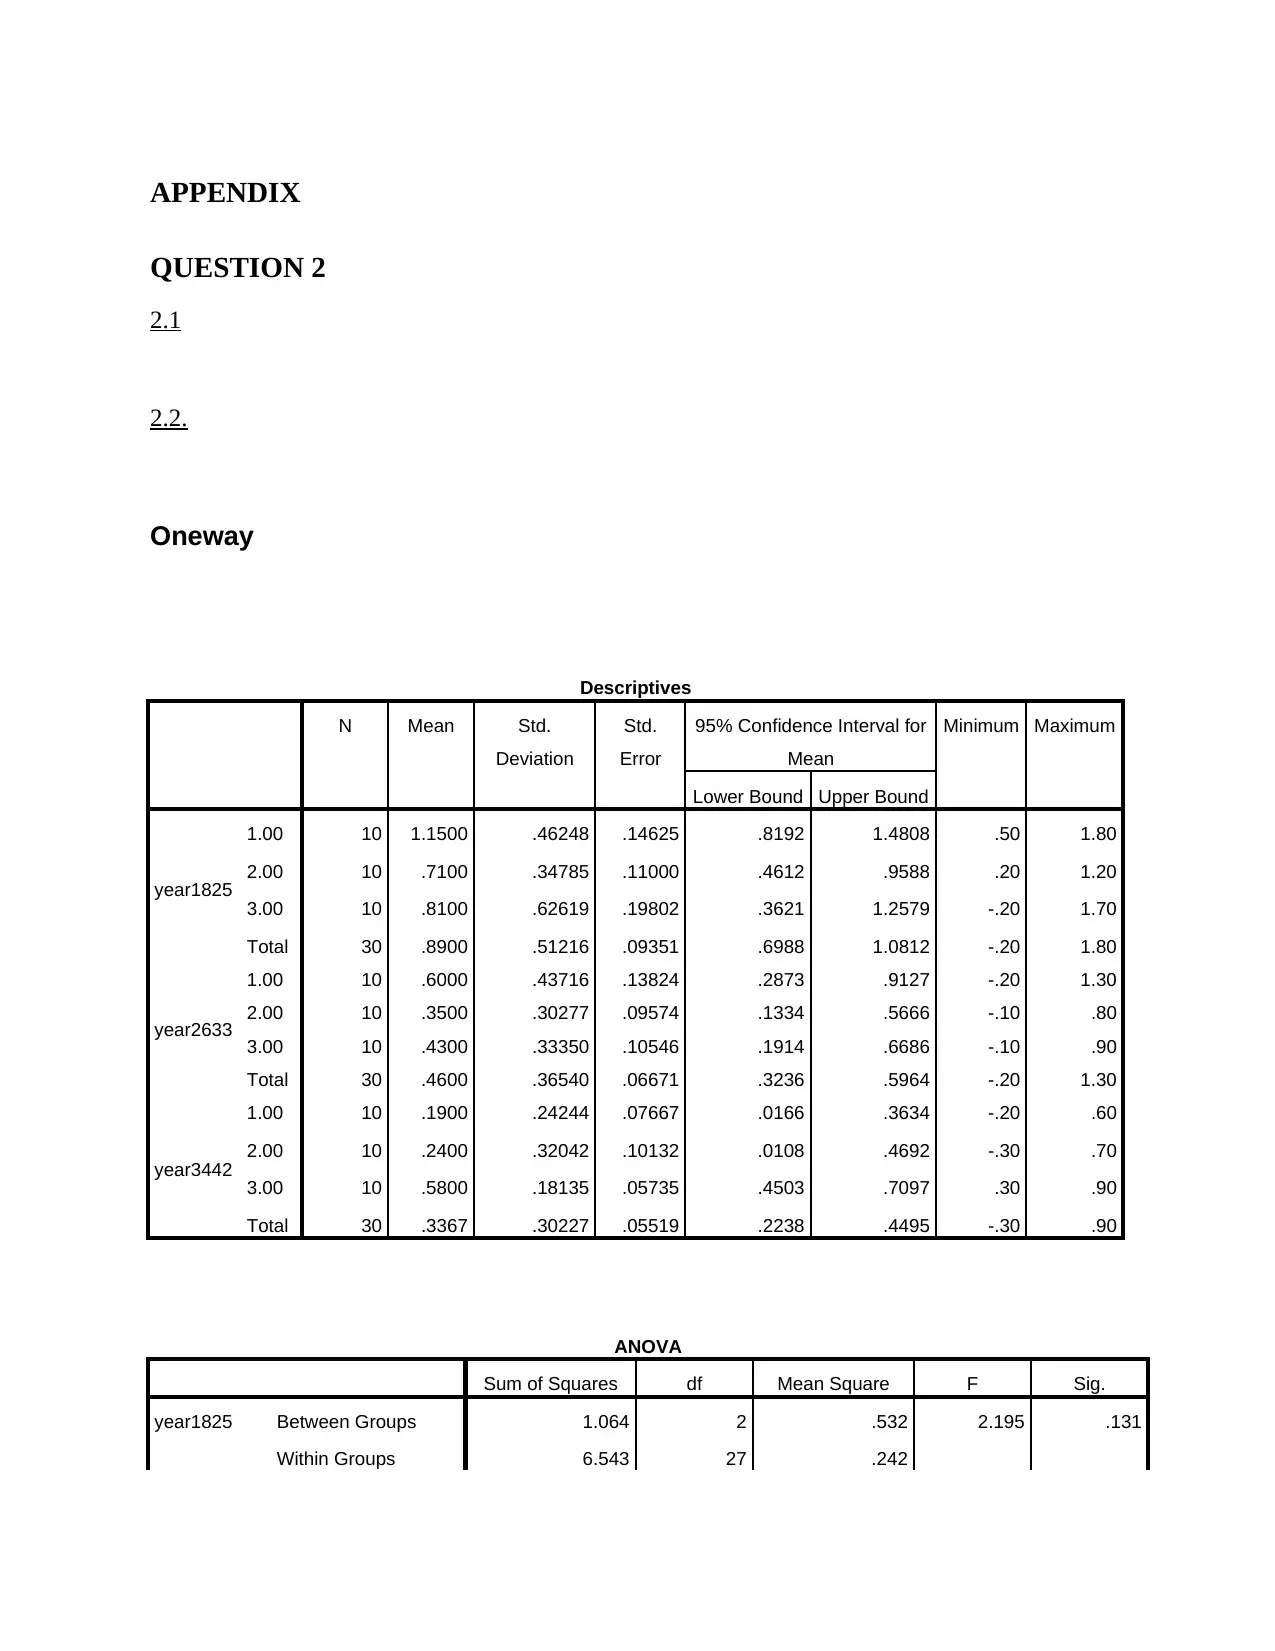
APPENDIX
QUESTION 2
2.1
2.2.
Oneway
Descriptives
N Mean Std.
Deviation
Std.
Error
95% Confidence Interval for
Mean
Minimum Maximum
Lower Bound Upper Bound
year1825
1.00 10 1.1500 .46248 .14625 .8192 1.4808 .50 1.80
2.00 10 .7100 .34785 .11000 .4612 .9588 .20 1.20
3.00 10 .8100 .62619 .19802 .3621 1.2579 -.20 1.70
Total 30 .8900 .51216 .09351 .6988 1.0812 -.20 1.80
year2633
1.00 10 .6000 .43716 .13824 .2873 .9127 -.20 1.30
2.00 10 .3500 .30277 .09574 .1334 .5666 -.10 .80
3.00 10 .4300 .33350 .10546 .1914 .6686 -.10 .90
Total 30 .4600 .36540 .06671 .3236 .5964 -.20 1.30
year3442
1.00 10 .1900 .24244 .07667 .0166 .3634 -.20 .60
2.00 10 .2400 .32042 .10132 .0108 .4692 -.30 .70
3.00 10 .5800 .18135 .05735 .4503 .7097 .30 .90
Total 30 .3367 .30227 .05519 .2238 .4495 -.30 .90
ANOVA
Sum of Squares df Mean Square F Sig.
year1825 Between Groups 1.064 2 .532 2.195 .131
Within Groups 6.543 27 .242
⊘ This is a preview!⊘
Do you want full access?
Subscribe today to unlock all pages.
Trusted by 1+ million students worldwide
1 out of 23
Related Documents


Your All-in-One AI-Powered Toolkit for Academic Success.
+13062052269
info@desklib.com
Available 24*7 on WhatsApp / Email
![[object Object]](/_next/static/media/star-bottom.7253800d.svg)
Unlock your academic potential
Copyright © 2020–2026 A2Z Services. All Rights Reserved. Developed and managed by ZUCOL.