Quantitative Research Methods Analysis Report - Statistical Analysis
VerifiedAdded on 2021/02/19
|12
|2841
|412
Report
AI Summary
This report presents a quantitative research analysis conducted to assess how to encourage young people to study arts, utilizing data collected by a local council-funded team. The analysis employs various SPSS models, including One-Sample T-tests, correlation statistics, and linear regression models to test several hypotheses. The report provides a description of the methodologies used, summarizes the findings, and draws conclusions based on the statistical outputs. Key areas of investigation include the impact of socioeconomic status on attitudes towards arts, the influence of current art activities and favorite subjects on engagement, and the relationship between gender and satisfaction levels. The analysis also examines how attitudes towards arts change over time. The report concludes by summarizing the key findings and emphasizing the usefulness of quantitative research methods in generating meaningful insights through data analysis.
QUANTITATIVE
RESEARCH
METHODS
RESEARCH
METHODS
Paraphrase This Document
Need a fresh take? Get an instant paraphrase of this document with our AI Paraphraser
Table of Contents
INTRODUCTION...........................................................................................................................1
QUESTION 1...................................................................................................................................1
a. Description of the Analysis......................................................................................................1
b. Summary of the Analyses........................................................................................................2
c. Conclusion................................................................................................................................2
QUESTION 2...................................................................................................................................2
a. Description of the Analysis......................................................................................................2
b. Summary of the Analyses........................................................................................................3
c. Conclusion................................................................................................................................3
QUESTION 3...................................................................................................................................3
a. Description of the Analysis......................................................................................................3
b. Summary of the Analyses........................................................................................................4
c. Conclusion................................................................................................................................4
QUESTION 4...................................................................................................................................4
a. Description of the Analysis......................................................................................................4
b. Summary of the Analyses........................................................................................................5
c. Conclusion................................................................................................................................5
CONCLUSION................................................................................................................................5
REFERENCES................................................................................................................................6
APPENDICES.................................................................................................................................7

⊘ This is a preview!⊘
Do you want full access?
Subscribe today to unlock all pages.
Trusted by 1+ million students worldwide
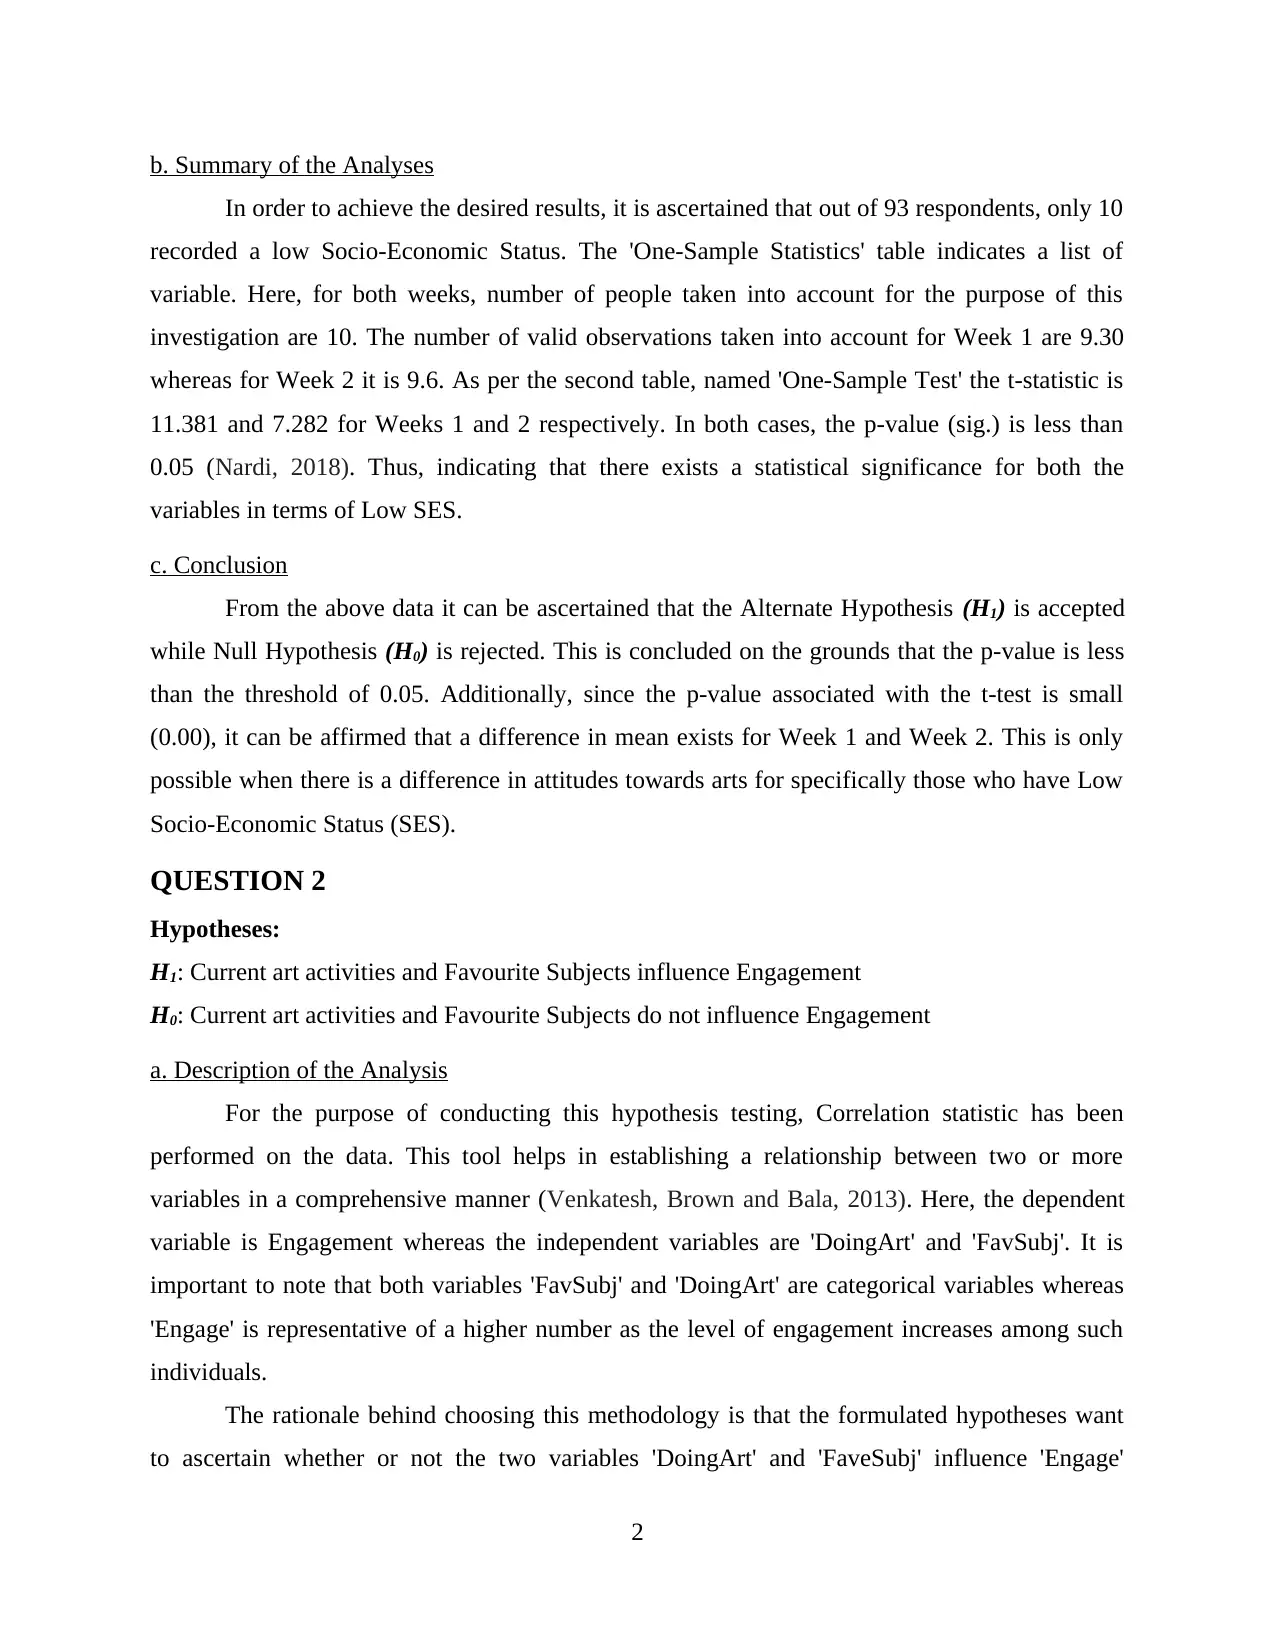
INTRODUCTION
Quantitative research methods play a crucial role from investigation purposes as they
help in the accumulation of raw data. This is helpful in quantifying the research and providing
empirical results by way of statistical, mathematical and computational methodologies (Bryman,
2017). This report aims to provide information regarding the data collected by a team funded by
the local council so as to assess the ways in which young people can be encouraged to study arts
in the area. For this purpose, various SPSS models have been utilised so as to achieve successful
completion of hypotheses testing.
QUESTION 1
Hypotheses:
H1: Difference between Week 1 and Week 2 in attitudes exists specifically for those with lowest
SES.
H0: No Difference between Week 1 and Week 2 in attitudes exists specifically for those with
lowest SES.
a. Description of the Analysis
For the purpose of achieving insights regarding whether H1 is true or not, Compare
Means methodology has been undertaken. Under this tool of analysis, One-Sample T-test has
been conducted so as to determine the difference between the Week 1 and 2 data provided for
those having Low Socio-Economic Status (SES). It is important to note that SES is a categorical
variable including four sub-categories viz. Low, Medium-Low, Medium-High and High. On the
other hand, Weeks 1 as well as 2 measure attitudes towards arts after first and second event
respectively.
The rationale behind choosing this methodology is that One-Sample T-test helps in
determination of whether a sample has a specific mean or not. Also, one of its assumptions states
that there should be no significant outliers (Hinton, McMurray and Brownlow, 2014). For the
data given, this is true since only those variables have been chosen which recorded low SES for
Week 1 and 2, thus, enabling simplification of data to a further extent. Since there is a
comparison between Week 1 and Week 2 in relation to Low SES, this tool seems to be the most
appropriate.
1
Paraphrase This Document
Need a fresh take? Get an instant paraphrase of this document with our AI Paraphraser
b. Summary of the Analyses
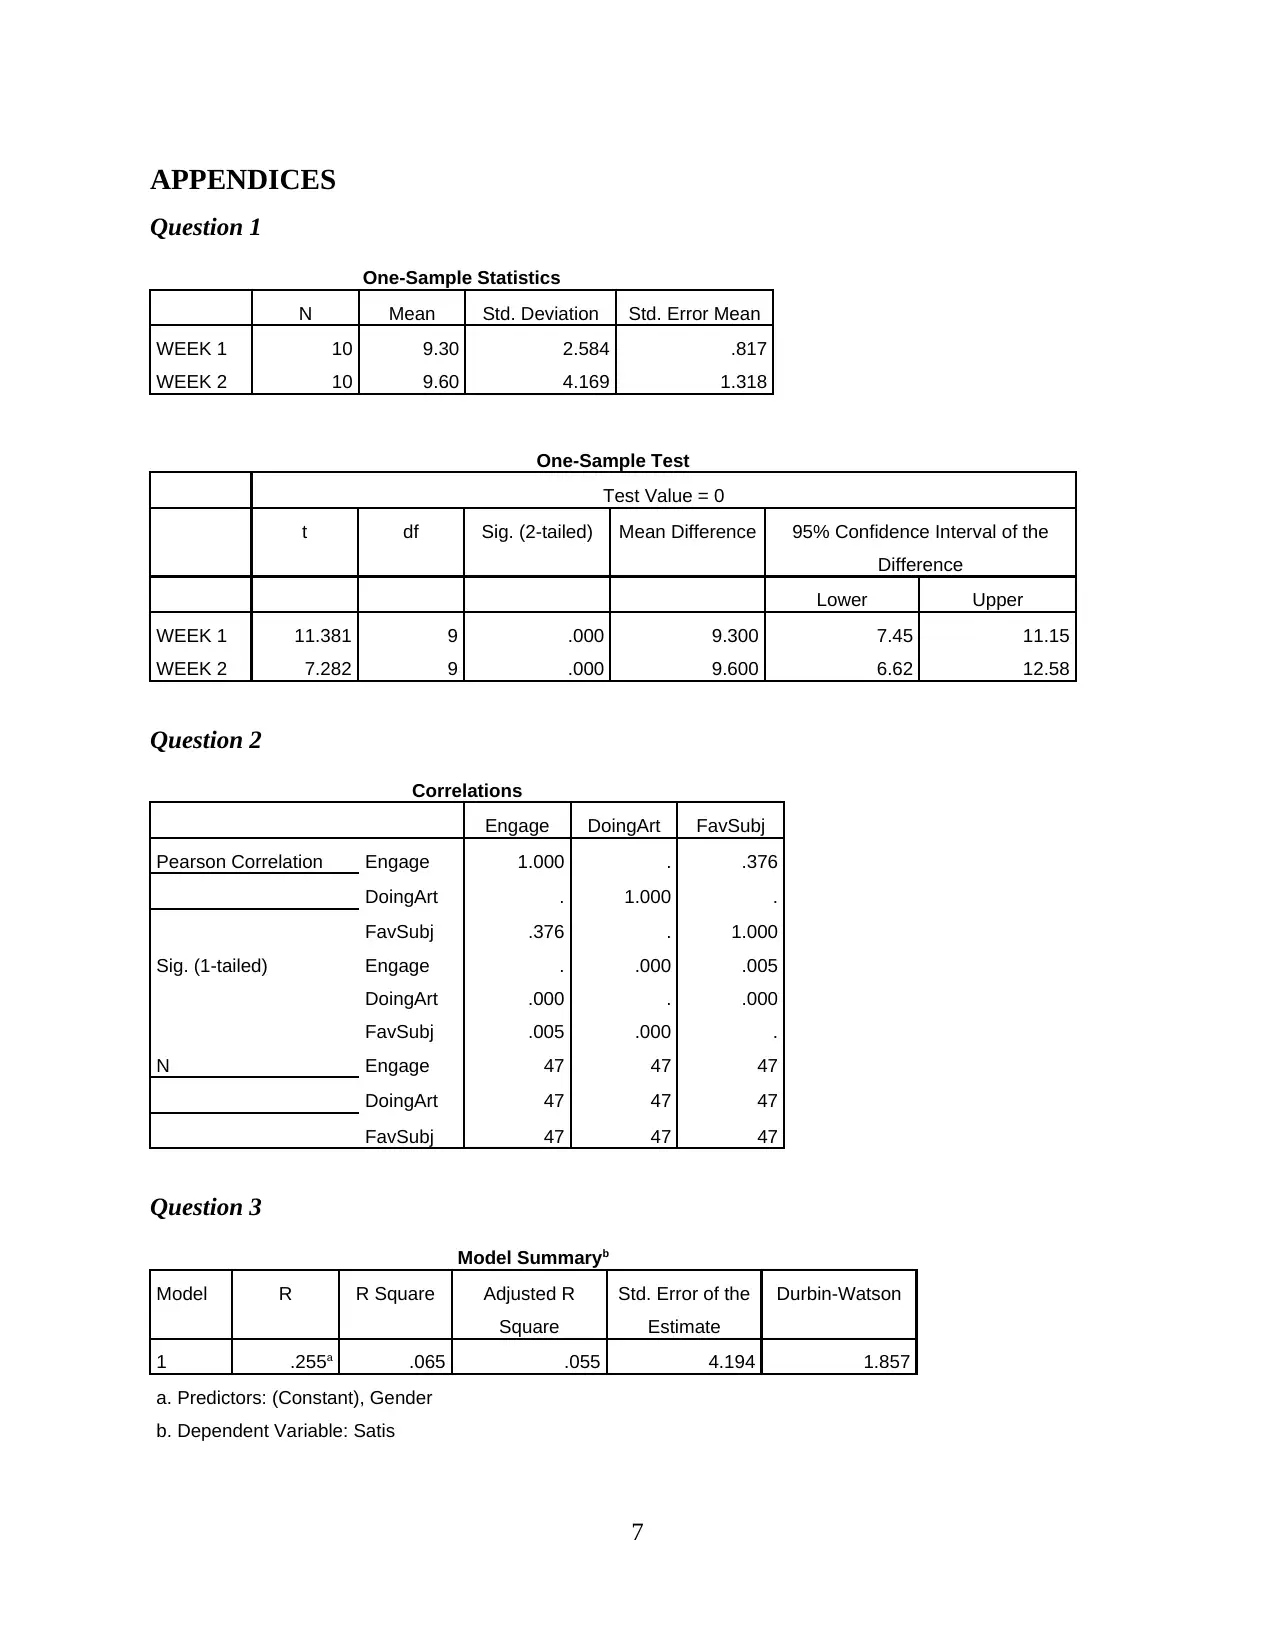
In order to achieve the desired results, it is ascertained that out of 93 respondents, only 10
recorded a low Socio-Economic Status. The 'One-Sample Statistics' table indicates a list of
variable. Here, for both weeks, number of people taken into account for the purpose of this
investigation are 10. The number of valid observations taken into account for Week 1 are 9.30
whereas for Week 2 it is 9.6. As per the second table, named 'One-Sample Test' the t-statistic is
11.381 and 7.282 for Weeks 1 and 2 respectively. In both cases, the p-value (sig.) is less than
0.05 (Nardi, 2018). Thus, indicating that there exists a statistical significance for both the
variables in terms of Low SES.
c. Conclusion
From the above data it can be ascertained that the Alternate Hypothesis (H1) is accepted
while Null Hypothesis (H0) is rejected. This is concluded on the grounds that the p-value is less
than the threshold of 0.05. Additionally, since the p-value associated with the t-test is small
(0.00), it can be affirmed that a difference in mean exists for Week 1 and Week 2. This is only
possible when there is a difference in attitudes towards arts for specifically those who have Low
Socio-Economic Status (SES).
QUESTION 2
Hypotheses:
H1: Current art activities and Favourite Subjects influence Engagement
H0: Current art activities and Favourite Subjects do not influence Engagement
a. Description of the Analysis
For the purpose of conducting this hypothesis testing, Correlation statistic has been
performed on the data. This tool helps in establishing a relationship between two or more
variables in a comprehensive manner (Venkatesh, Brown and Bala, 2013). Here, the dependent
variable is Engagement whereas the independent variables are 'DoingArt' and 'FavSubj'. It is
important to note that both variables 'FavSubj' and 'DoingArt' are categorical variables whereas
'Engage' is representative of a higher number as the level of engagement increases among such
individuals.
The rationale behind choosing this methodology is that the formulated hypotheses want
to ascertain whether or not the two variables 'DoingArt' and 'FaveSubj' influence 'Engage'
2
variable. For this to be plausible, it is only sensible to check whether the variables share any kind
of relationship that is strong enough to create an influence on the dependent variable. For this
purpose, 'Correlation' seems an appropriate technique to be implemented.
b. Summary of the Analyses
Out of 93 respondents' records, only 47 are currently involved in art activities. Further
breaking down these statistics, it is ascertained that Current Favourite Subjects of these are in the
following majorities:
Languages, Sports and Math is chosen by 12 respondents respectively.
Music is favourite of 11 respondents.
On the other hand, the data has been chosen for only those who are currently involved in doing
art activities. For this purpose, the correlation statistics state that 'FavSubj' variable has a
moderate correlation (R=0.376) with dependent variable while the other independent variable,
'DoingArt' do not have much influence on the engagement (R=0.00).
c. Conclusion
It can be concluded that the independent variable related to Current Favorite Subjects in
terms of those individuals who are currently doing art activities influences Engagement.
However, they are not the sole influencers since a person may not be mandated to be involved in
Art Activity so as to have engagement. This is due to the fact that individuals with artistic tastes
who are not actively involved in such activities may also be interested in such events. Thus,
'DoingArt' does not have much influence on the engagement.
QUESTION 3
Hypotheses:
H1: Gender influences satisfaction.
H0: Gender does not influence satisfaction.
a. Description of the Analysis
In order to conduct a successful hypothesis testing, Linear Regression Model has been
performed on the selected data. This SPSS model is an extended version of Correlation which
helps in forecasting a value of a dependent variable (Walliman, 2017). Here, the dependent
variable is Satisfaction (Satis) whereas the independent variable is Gender. It is important to note
3
⊘ This is a preview!⊘
Do you want full access?
Subscribe today to unlock all pages.
Trusted by 1+ million students worldwide
that the independent variable 'Gender' is a categorical variables having two sub-classes viz.
Males and Females.
The rationale behind choosing this methodology is that while correlation helps in the
establishing a relationship between two given variables, this models helps in indicating whether
this variable helps in the prediction of other variable or not. Since the formulated hypothesis
aims to ascertain whether or not Gender influences Satisfaction, it seems plausible to check that
whether one is able to predict another or not.
b. Summary of the Analyses
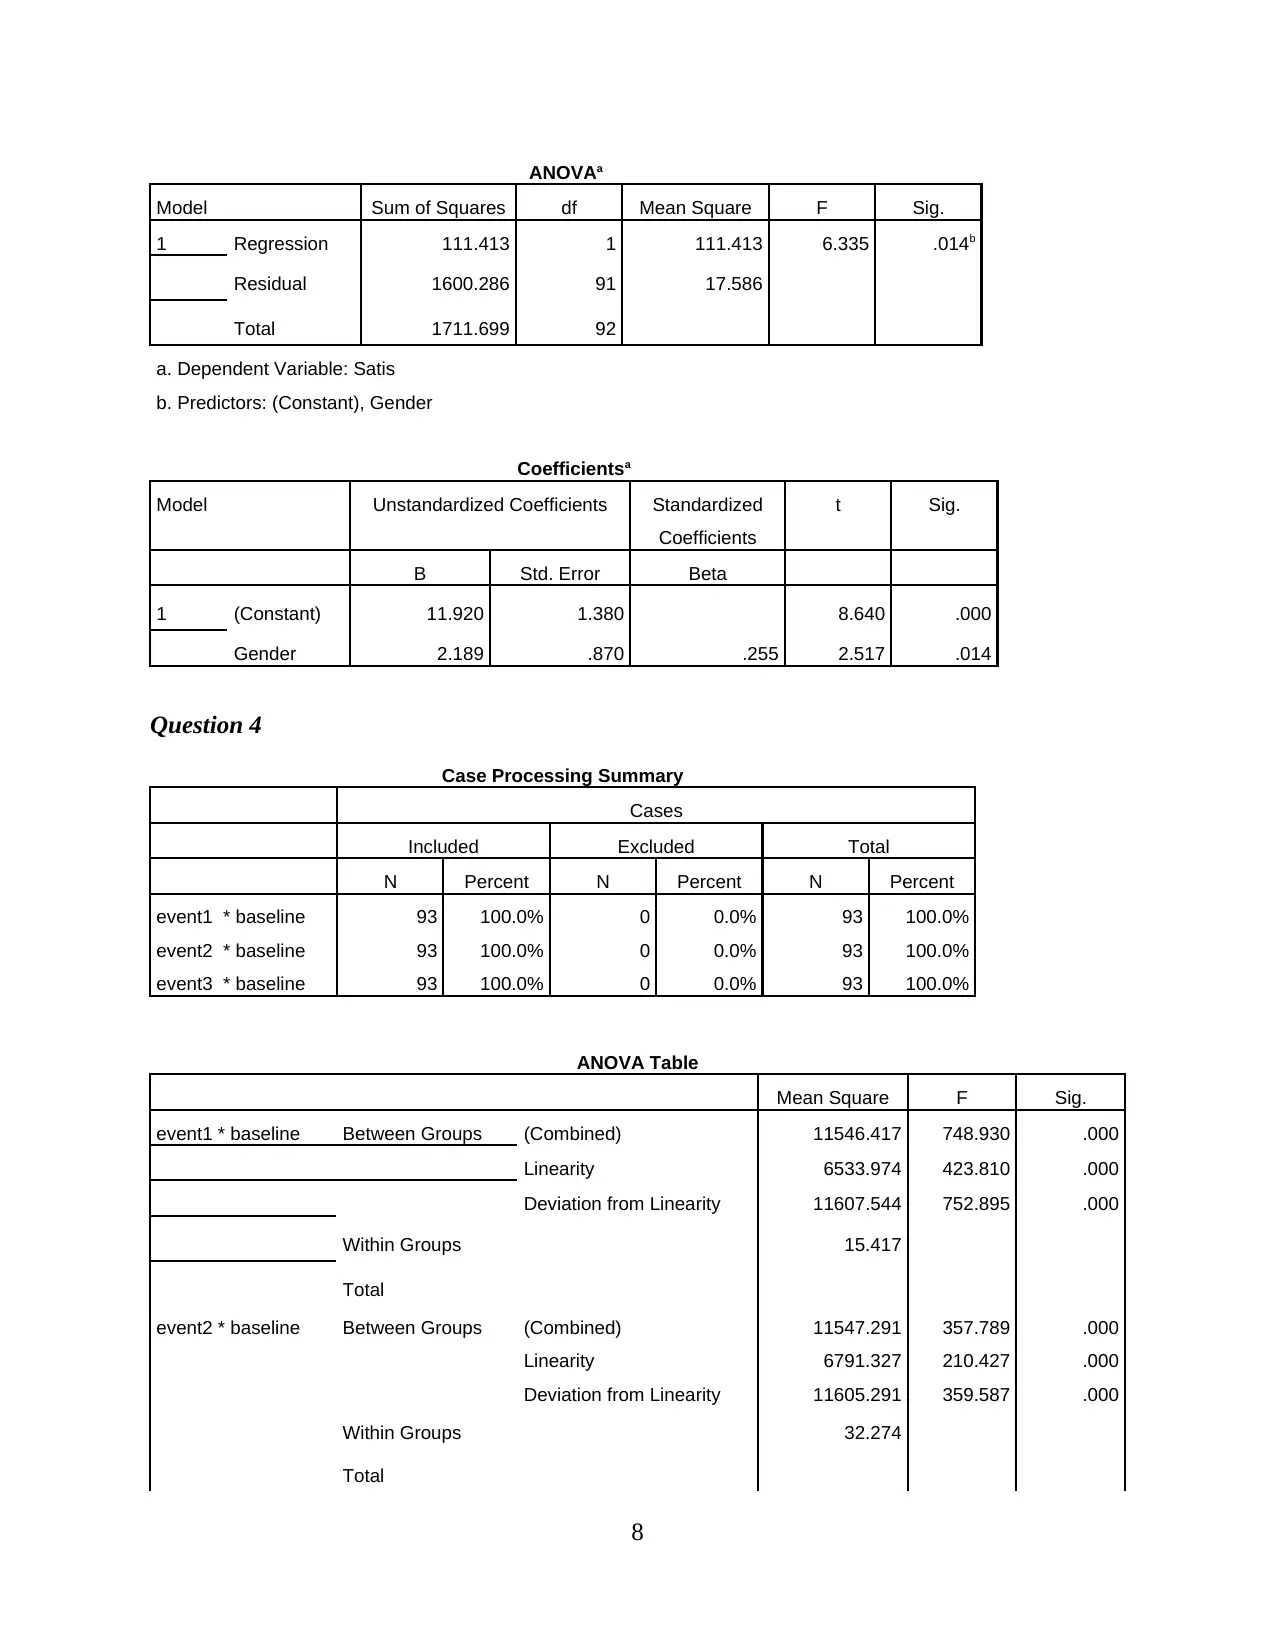
As per the output generated, the Model Summary Table states that the Correlation
between two variables is very weak, R=0.255. This is evident from the ANOVA Table too where
the level of statistical significance, p-value is more than threshold, 0.05 (p-value= 0.014).
c. Conclusion
From above summary of analyses, it can be concluded that the independent variable,
Gender, does not influence level of Satisfaction in a significant manner. As a result, null
hypothesis (H0) is accepted while alternate hypotheses (H1) is rejected.
QUESTION 4
Hypotheses:
H1: Attitudes towards arts improve over Time
H0: Attitudes towards arts does not improve over Time
a. Description of the Analysis
As per the aim of the hypothesis developed, it is required to be checked that whether or
not attitudes towards art improve over time. Time is a continuous variable which tends to impact
variables in a positive or negative manner. In order to successfully ascertain whether or not null
hypotheses (H0) is rejected, a SPSS model called 'Compare Means' has been taken into account.
For this purpose, four variables have been taken into account viz. Baseline, Event 1, Event 2 and
Event 3. Each of these three events occur on a weekly basis. Thus, giving a timeline of 21 days.
Specifically, in this model, variance, measures of association as well as ANOVA Test has
been taken into account. Thus, enabling the researcher to know if there is any kind of variance
existent between baseline and event 3. If the variance is less and association among them is
4
Males and Females.
The rationale behind choosing this methodology is that while correlation helps in the
establishing a relationship between two given variables, this models helps in indicating whether
this variable helps in the prediction of other variable or not. Since the formulated hypothesis
aims to ascertain whether or not Gender influences Satisfaction, it seems plausible to check that
whether one is able to predict another or not.
b. Summary of the Analyses
As per the output generated, the Model Summary Table states that the Correlation
between two variables is very weak, R=0.255. This is evident from the ANOVA Table too where
the level of statistical significance, p-value is more than threshold, 0.05 (p-value= 0.014).
c. Conclusion
From above summary of analyses, it can be concluded that the independent variable,
Gender, does not influence level of Satisfaction in a significant manner. As a result, null
hypothesis (H0) is accepted while alternate hypotheses (H1) is rejected.
QUESTION 4
Hypotheses:
H1: Attitudes towards arts improve over Time
H0: Attitudes towards arts does not improve over Time
a. Description of the Analysis
As per the aim of the hypothesis developed, it is required to be checked that whether or
not attitudes towards art improve over time. Time is a continuous variable which tends to impact
variables in a positive or negative manner. In order to successfully ascertain whether or not null
hypotheses (H0) is rejected, a SPSS model called 'Compare Means' has been taken into account.
For this purpose, four variables have been taken into account viz. Baseline, Event 1, Event 2 and
Event 3. Each of these three events occur on a weekly basis. Thus, giving a timeline of 21 days.
Specifically, in this model, variance, measures of association as well as ANOVA Test has
been taken into account. Thus, enabling the researcher to know if there is any kind of variance
existent between baseline and event 3. If the variance is less and association among them is
4
Paraphrase This Document
Need a fresh take? Get an instant paraphrase of this document with our AI Paraphraser
small, one can say that the level of attitude towards arts over time has decreased and vice versa
(Zohrabi, 2013).
b. Summary of the Analyses
As per the output generated, three tables have been taken into account viz. Case
Processing Summary, ANOVA Table and Measures of Association. Through these, one is able to
ascertain three important points of information:
Number of variables included in the model;
Significance of each variable in terms of the dependent variable;
Correlation among all the variables.
For all the three cases that assume 'Baseline' as the independent variable and 'Event1, 2
and 3' as dependent variables, no single point of data has been excluded. Thus, the whole of the
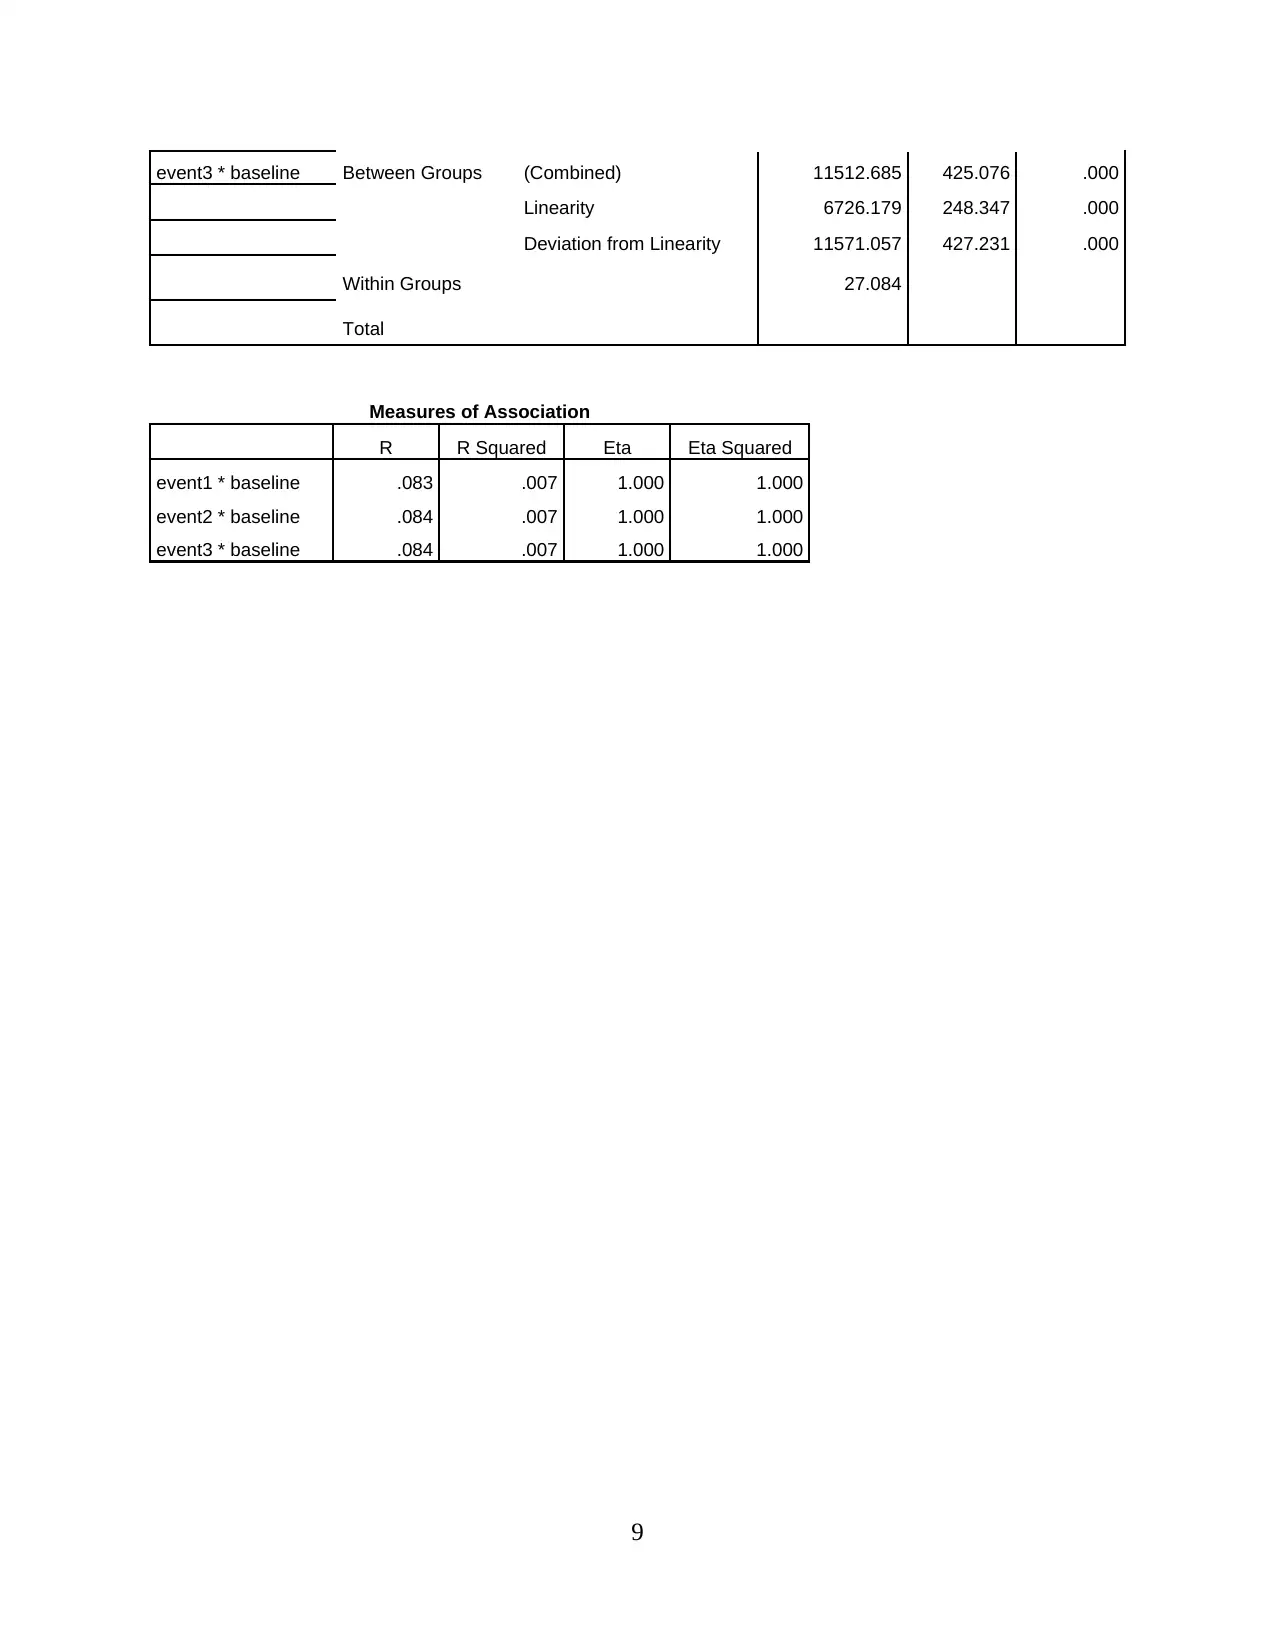
model is utilised on 93 responses recorded by the team. The ANOVA Table indicates that the p-
value for event1*baseline, event2*baseline and event3*baseline is 0.00 which indicates that
there is a statistical significance among all the variables. As a result, one can affirm that the
attitude does improve towards art over time. The last table indicates that association is highest
for Event 2 (R=0.84) and 3 (R=0.84) held in Weeks 2 and 3 respectively. While R=0.83 for
event1*baseline.
c. Conclusion
Thus, one can conclude that over time, attitude towards time has been positive with more
correlation occurring since baseline. This can be mainly due to the increase in level of awareness
that was limited at the Baseline level and gradually increased through the events over the weeks.
As a result, null hypotheses (H0) is rejected and alternate hypothesis (H1) is accepted for this
scenario.
CONCLUSION
From the above report, it can be inferred that the Quantitative research methods such as
Correlation, Linear Regression Models, Compare Means and T-tests are helpful in deriving
meaningful information. This is mainly done through the selection of a sample and processing it
so as to extract relevant data for performing further analysis. Thus, enabling the researcher to
promptly determine whether the hypotheses formulated by them is achieved or not in a
quantifiable manner.
5
(Zohrabi, 2013).
b. Summary of the Analyses
As per the output generated, three tables have been taken into account viz. Case
Processing Summary, ANOVA Table and Measures of Association. Through these, one is able to
ascertain three important points of information:
Number of variables included in the model;
Significance of each variable in terms of the dependent variable;
Correlation among all the variables.
For all the three cases that assume 'Baseline' as the independent variable and 'Event1, 2
and 3' as dependent variables, no single point of data has been excluded. Thus, the whole of the
model is utilised on 93 responses recorded by the team. The ANOVA Table indicates that the p-
value for event1*baseline, event2*baseline and event3*baseline is 0.00 which indicates that
there is a statistical significance among all the variables. As a result, one can affirm that the
attitude does improve towards art over time. The last table indicates that association is highest
for Event 2 (R=0.84) and 3 (R=0.84) held in Weeks 2 and 3 respectively. While R=0.83 for
event1*baseline.
c. Conclusion
Thus, one can conclude that over time, attitude towards time has been positive with more
correlation occurring since baseline. This can be mainly due to the increase in level of awareness
that was limited at the Baseline level and gradually increased through the events over the weeks.
As a result, null hypotheses (H0) is rejected and alternate hypothesis (H1) is accepted for this
scenario.
CONCLUSION
From the above report, it can be inferred that the Quantitative research methods such as
Correlation, Linear Regression Models, Compare Means and T-tests are helpful in deriving
meaningful information. This is mainly done through the selection of a sample and processing it
so as to extract relevant data for performing further analysis. Thus, enabling the researcher to
promptly determine whether the hypotheses formulated by them is achieved or not in a
quantifiable manner.
5
REFERENCES
Books and Journal
Bryman, A. (2017). Quantitative and qualitative research: further reflections on their integration.
In Mixing methods: Qualitative and quantitative research (pp. 57-78). Routledge.
Hinton, P. R., McMurray, I., & Brownlow, C. (2014). SPSS explained. Routledge.
Nardi, P. M. (2018). Doing survey research: A guide to quantitative methods. Routledge.
Venkatesh, V., Brown, S. A., & Bala, H. (2013). Bridging the qualitative-quantitative divide:
Guidelines for conducting mixed methods research in information systems. MIS
quarterly. 21-54.
Walliman, N. (2017). Research methods: The basics. Routledge.
Zohrabi, M. (2013). Mixed Method Research: Instruments, Validity, Reliability and Reporting
Findings. Theory & practice in language studies. 3(2).
6
⊘ This is a preview!⊘
Do you want full access?
Subscribe today to unlock all pages.
Trusted by 1+ million students worldwide
APPENDICES
Question 1
One-Sample Statistics
N Mean Std. Deviation Std. Error Mean
WEEK 1 10 9.30 2.584 .817
WEEK 2 10 9.60 4.169 1.318
One-Sample Test
Test Value = 0
t df Sig. (2-tailed) Mean Difference 95% Confidence Interval of the
Difference
Lower Upper
WEEK 1 11.381 9 .000 9.300 7.45 11.15
WEEK 2 7.282 9 .000 9.600 6.62 12.58
Question 2
Correlations
Engage DoingArt FavSubj
Pearson Correlation Engage 1.000 . .376
DoingArt . 1.000 .
FavSubj .376 . 1.000
Sig. (1-tailed) Engage . .000 .005
DoingArt .000 . .000
FavSubj .005 .000 .
N Engage 47 47 47
DoingArt 47 47 47
FavSubj 47 47 47
Question 3
Model Summaryb
Model R R Square Adjusted R
Square
Std. Error of the
Estimate
Durbin-Watson
1 .255a .065 .055 4.194 1.857
a. Predictors: (Constant), Gender
b. Dependent Variable: Satis
7
Paraphrase This Document
Need a fresh take? Get an instant paraphrase of this document with our AI Paraphraser
ANOVAa
Model Sum of Squares df Mean Square F Sig.
1 Regression 111.413 1 111.413 6.335 .014b
Residual 1600.286 91 17.586
Total 1711.699 92
a. Dependent Variable: Satis
b. Predictors: (Constant), Gender
Coefficientsa
Model Unstandardized Coefficients Standardized
Coefficients
t Sig.
B Std. Error Beta
1 (Constant) 11.920 1.380 8.640 .000
Gender 2.189 .870 .255 2.517 .014
Question 4
Case Processing Summary
Cases
Included Excluded Total
N Percent N Percent N Percent
event1 * baseline 93 100.0% 0 0.0% 93 100.0%
event2 * baseline 93 100.0% 0 0.0% 93 100.0%
event3 * baseline 93 100.0% 0 0.0% 93 100.0%
ANOVA Table
Mean Square F Sig.
event1 * baseline Between Groups (Combined) 11546.417 748.930 .000
Linearity 6533.974 423.810 .000
Deviation from Linearity 11607.544 752.895 .000
Within Groups 15.417
Total
event2 * baseline Between Groups (Combined) 11547.291 357.789 .000
Linearity 6791.327 210.427 .000
Deviation from Linearity 11605.291 359.587 .000
Within Groups 32.274
Total
8
event3 * baseline Between Groups (Combined) 11512.685 425.076 .000
Linearity 6726.179 248.347 .000
Deviation from Linearity 11571.057 427.231 .000
Within Groups 27.084
Total
Measures of Association
R R Squared Eta Eta Squared
event1 * baseline .083 .007 1.000 1.000
event2 * baseline .084 .007 1.000 1.000
event3 * baseline .084 .007 1.000 1.000
9
Linearity 6726.179 248.347 .000
Deviation from Linearity 11571.057 427.231 .000
Within Groups 27.084
Total
Measures of Association
R R Squared Eta Eta Squared
event1 * baseline .083 .007 1.000 1.000
event2 * baseline .084 .007 1.000 1.000
event3 * baseline .084 .007 1.000 1.000
9
⊘ This is a preview!⊘
Do you want full access?
Subscribe today to unlock all pages.
Trusted by 1+ million students worldwide
1 out of 12
Related Documents


Your All-in-One AI-Powered Toolkit for Academic Success.
+13062052269
info@desklib.com
Available 24*7 on WhatsApp / Email
![[object Object]](/_next/static/media/star-bottom.7253800d.svg)
Unlock your academic potential
Copyright © 2020–2026 A2Z Services. All Rights Reserved. Developed and managed by ZUCOL.