Quantitative Research Methods for Social Scientists: SPSS Analysis
VerifiedAdded on 2023/06/16
|8
|1412
|101
Report
AI Summary
This report provides an overview of quantitative research methods for social scientists, focusing on key concepts such as levels of measurement (nominal, ordinal, interval, and ratio), measures of central tendency and dispersion, and the difference between descriptive and inferential statistics. It incl...

Quantitative Research
Methods for Social
Scientists
Methods for Social
Scientists
Paraphrase This Document
Need a fresh take? Get an instant paraphrase of this document with our AI Paraphraser
Table of Contents
Introduction......................................................................................................................................3
Main Body.......................................................................................................................................3
Four levels of measurement giving examples of each............................................................3
Measures of Central Tendency and Measures of Dispersion.................................................3
Difference between Descriptive Statistics and Inferential Statistics......................................4
Explanation.............................................................................................................................4
The SPSS output and provide an interpretation of the results for the....................................5
Frequency table..................................................................................................................5
Cross tabulation.................................................................................................................5
Chi-square result................................................................................................................6
Phi/Cramer’s......................................................................................................................7
Conclusion.......................................................................................................................................7
References........................................................................................................................................8
Introduction
Quantitative methods in the research paper emphasis on use of mathematical, statical and
performs analysis of data collections techniques such as surveys, questionnaires etc. The
provided technique is useful for the researcher for interpretation of required information to
achieve research aims and objectives. The given report will provide briefings about key issues
covered in class over the previous weeks and will gather SPSS output with a suitable
interpretation (Peytcheva, 2020).
Main Body
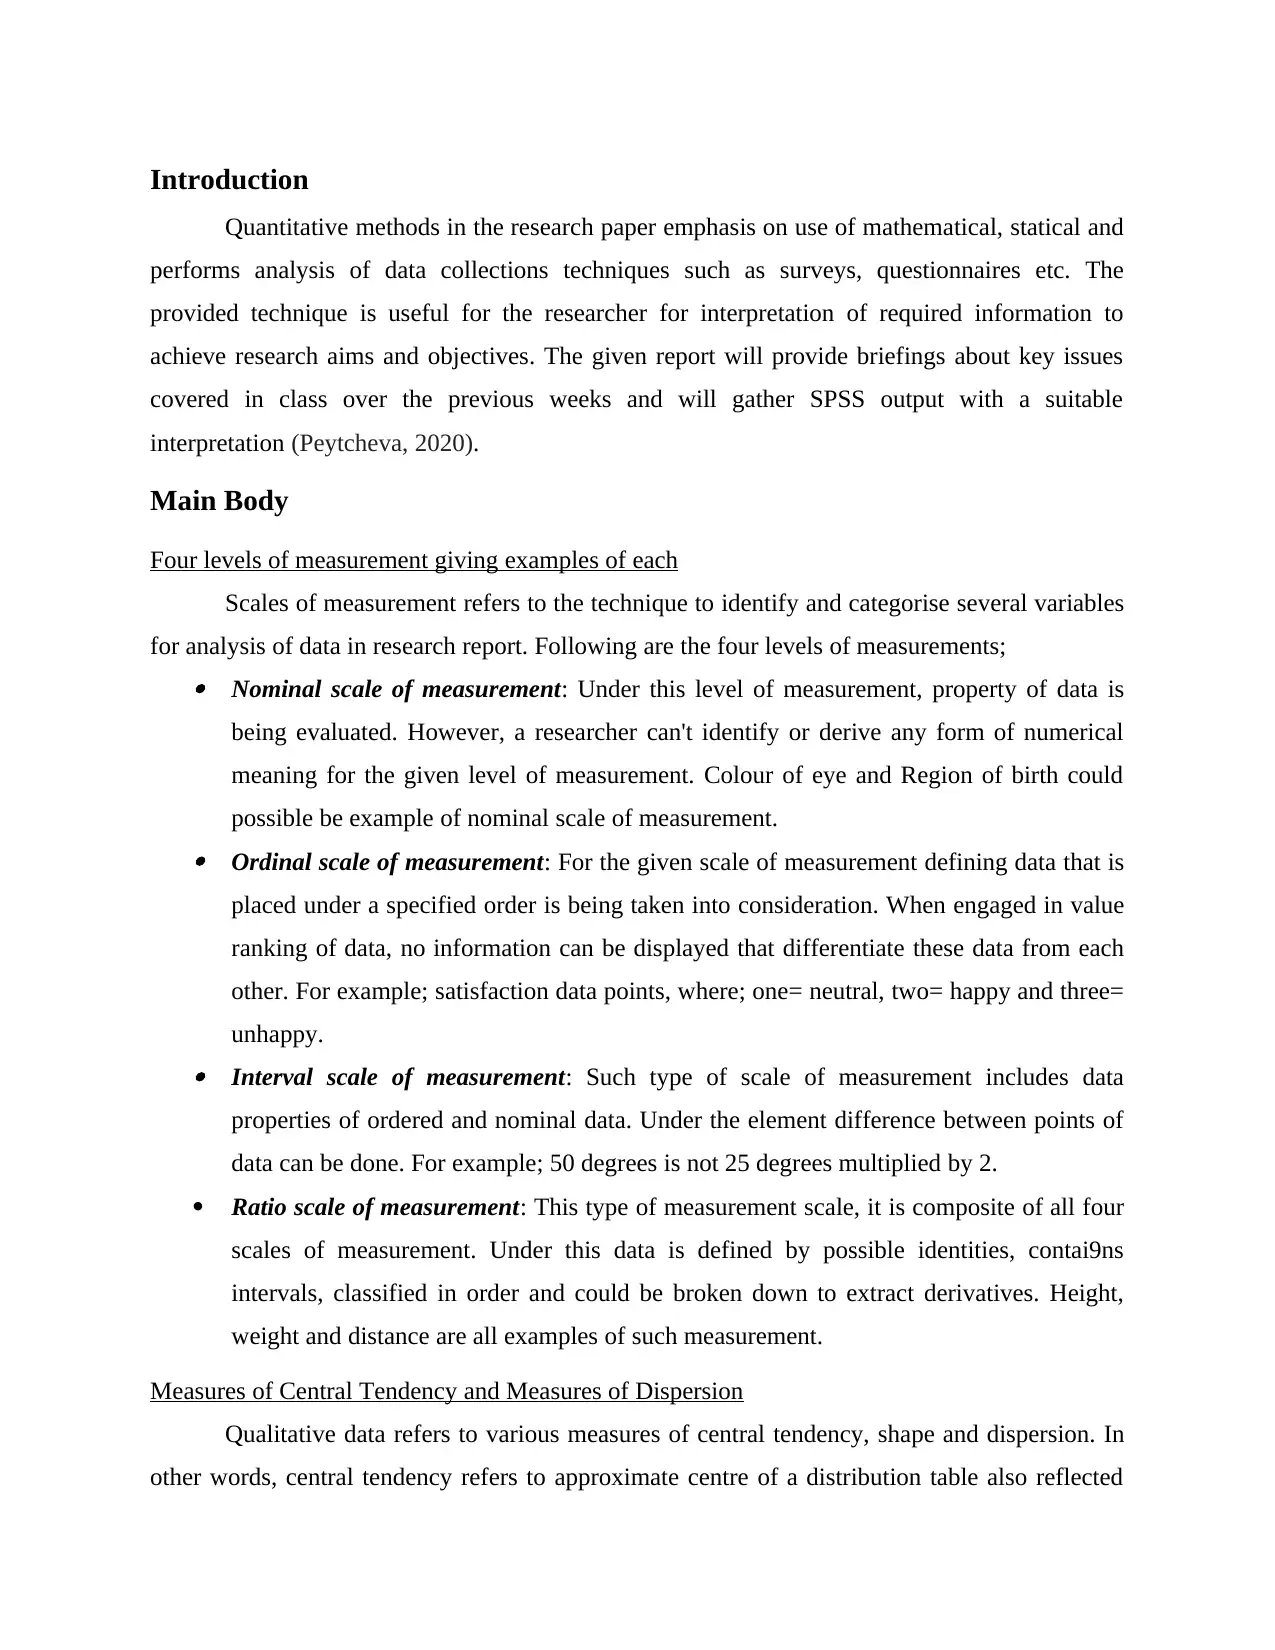
Four levels of measurement giving examples of each
Scales of measurement refers to the technique to identify and categorise several variables
for analysis of data in research report. Following are the four levels of measurements; Nominal scale of measurement: Under this level of measurement, property of data is
being evaluated. However, a researcher can't identify or derive any form of numerical
meaning for the given level of measurement. Colour of eye and Region of birth could
possible be example of nominal scale of measurement. Ordinal scale of measurement: For the given scale of measurement defining data that is
placed under a specified order is being taken into consideration. When engaged in value
ranking of data, no information can be displayed that differentiate these data from each
other. For example; satisfaction data points, where; one= neutral, two= happy and three=
unhappy. Interval scale of measurement: Such type of scale of measurement includes data
properties of ordered and nominal data. Under the element difference between points of
data can be done. For example; 50 degrees is not 25 degrees multiplied by 2.
Ratio scale of measurement: This type of measurement scale, it is composite of all four
scales of measurement. Under this data is defined by possible identities, contai9ns
intervals, classified in order and could be broken down to extract derivatives. Height,
weight and distance are all examples of such measurement.
Measures of Central Tendency and Measures of Dispersion
Qualitative data refers to various measures of central tendency, shape and dispersion. In
other words, central tendency refers to approximate centre of a distribution table also reflected
Quantitative methods in the research paper emphasis on use of mathematical, statical and
performs analysis of data collections techniques such as surveys, questionnaires etc. The
provided technique is useful for the researcher for interpretation of required information to
achieve research aims and objectives. The given report will provide briefings about key issues
covered in class over the previous weeks and will gather SPSS output with a suitable
interpretation (Peytcheva, 2020).
Main Body
Four levels of measurement giving examples of each
Scales of measurement refers to the technique to identify and categorise several variables
for analysis of data in research report. Following are the four levels of measurements; Nominal scale of measurement: Under this level of measurement, property of data is
being evaluated. However, a researcher can't identify or derive any form of numerical
meaning for the given level of measurement. Colour of eye and Region of birth could
possible be example of nominal scale of measurement. Ordinal scale of measurement: For the given scale of measurement defining data that is
placed under a specified order is being taken into consideration. When engaged in value
ranking of data, no information can be displayed that differentiate these data from each
other. For example; satisfaction data points, where; one= neutral, two= happy and three=
unhappy. Interval scale of measurement: Such type of scale of measurement includes data
properties of ordered and nominal data. Under the element difference between points of
data can be done. For example; 50 degrees is not 25 degrees multiplied by 2.
Ratio scale of measurement: This type of measurement scale, it is composite of all four
scales of measurement. Under this data is defined by possible identities, contai9ns
intervals, classified in order and could be broken down to extract derivatives. Height,
weight and distance are all examples of such measurement.
Measures of Central Tendency and Measures of Dispersion
Qualitative data refers to various measures of central tendency, shape and dispersion. In
other words, central tendency refers to approximate centre of a distribution table also reflected
⊘ This is a preview!⊘
Do you want full access?
Subscribe today to unlock all pages.
Trusted by 1+ million students worldwide
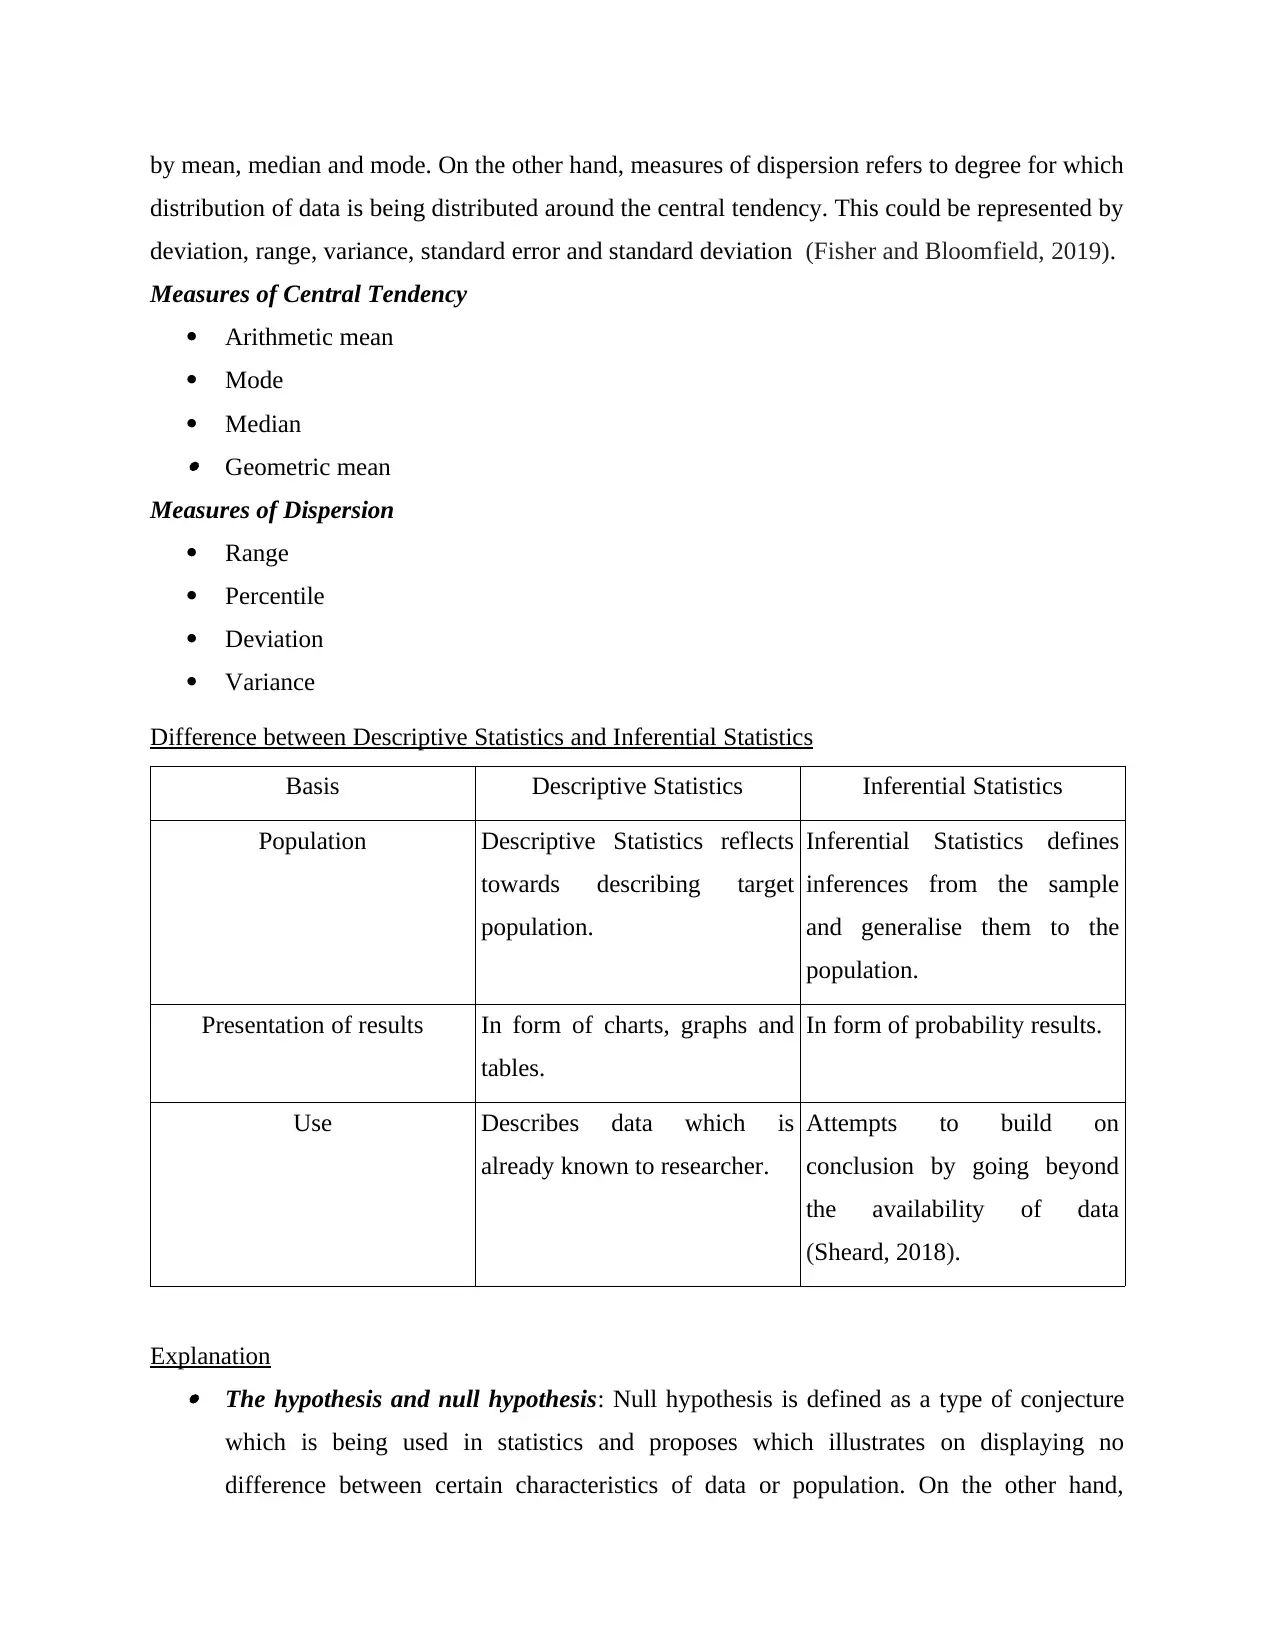
by mean, median and mode. On the other hand, measures of dispersion refers to degree for which
distribution of data is being distributed around the central tendency. This could be represented by
deviation, range, variance, standard error and standard deviation (Fisher and Bloomfield, 2019).
Measures of Central Tendency
Arithmetic mean
Mode
Median Geometric mean
Measures of Dispersion
Range
Percentile
Deviation
Variance
Difference between Descriptive Statistics and Inferential Statistics
Basis Descriptive Statistics Inferential Statistics
Population Descriptive Statistics reflects
towards describing target
population.
Inferential Statistics defines
inferences from the sample
and generalise them to the
population.
Presentation of results In form of charts, graphs and
tables.
In form of probability results.
Use Describes data which is
already known to researcher.
Attempts to build on
conclusion by going beyond
the availability of data
(Sheard, 2018).
Explanation The hypothesis and null hypothesis: Null hypothesis is defined as a type of conjecture
which is being used in statistics and proposes which illustrates on displaying no
difference between certain characteristics of data or population. On the other hand,
Paraphrase This Document
Need a fresh take? Get an instant paraphrase of this document with our AI Paraphraser
hypothesis is just an idea which is being proposed for the sake of argument so that
respective objectives of the report can be attained. Independent and dependent variable: Dependent variables are those variables that can't
be manipulated by any other constraint on the other hand independent variable are those
who can bear changes with affect of other variables present.
Extraneous variables: These are those variables that are no listed in independent variable
but can affect results of the provided experiment (Bloomfield and Fisher, 2019).
The SPSS output and provide an interpretation of the results for the
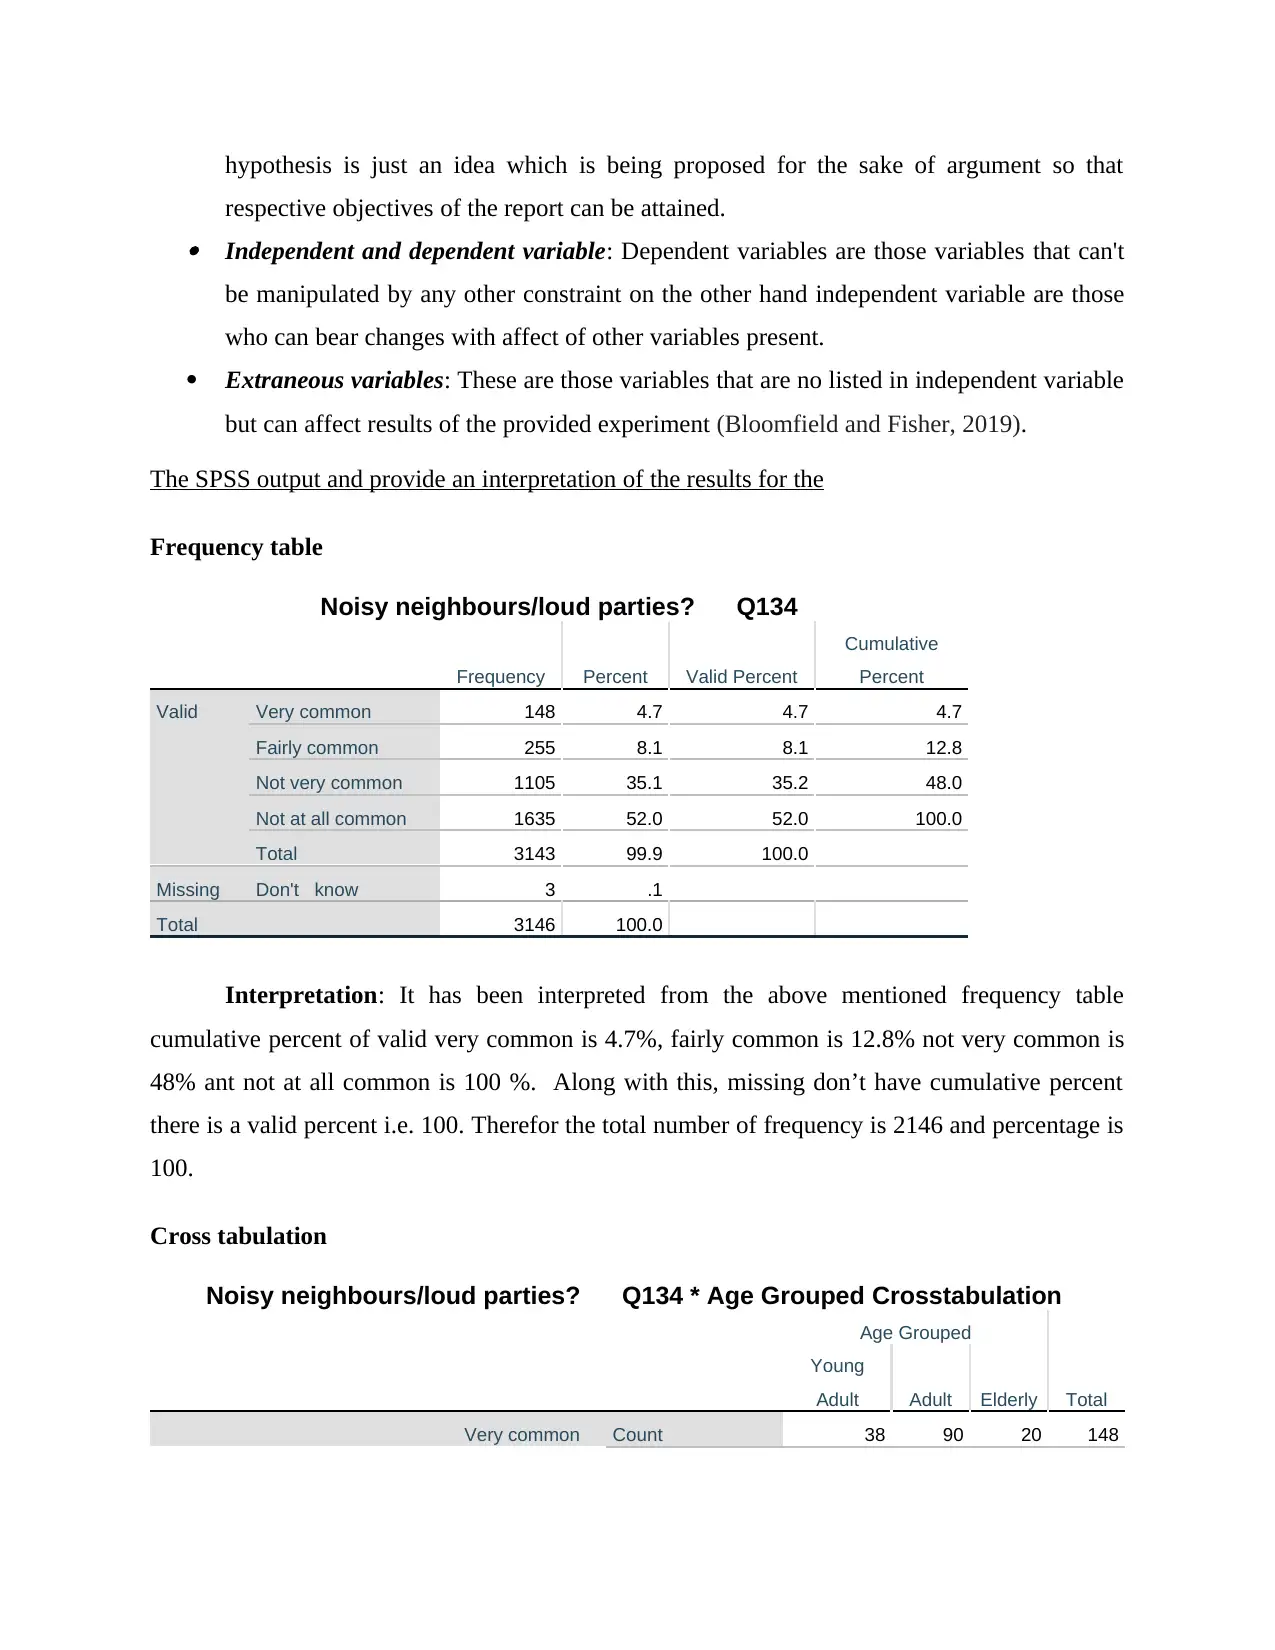
Frequency table
Noisy neighbours/loud parties? Q134
Frequency Percent Valid Percent
Cumulative
Percent
Valid Very common 148 4.7 4.7 4.7
Fairly common 255 8.1 8.1 12.8
Not very common 1105 35.1 35.2 48.0
Not at all common 1635 52.0 52.0 100.0
Total 3143 99.9 100.0
Missing Don't know 3 .1
Total 3146 100.0
Interpretation: It has been interpreted from the above mentioned frequency table
cumulative percent of valid very common is 4.7%, fairly common is 12.8% not very common is
48% ant not at all common is 100 %. Along with this, missing don’t have cumulative percent
there is a valid percent i.e. 100. Therefor the total number of frequency is 2146 and percentage is
100.
Cross tabulation
Noisy neighbours/loud parties? Q134 * Age Grouped Crosstabulation
Age Grouped
Total
Young
Adult Adult Elderly
Very common Count 38 90 20 148
respective objectives of the report can be attained. Independent and dependent variable: Dependent variables are those variables that can't
be manipulated by any other constraint on the other hand independent variable are those
who can bear changes with affect of other variables present.
Extraneous variables: These are those variables that are no listed in independent variable
but can affect results of the provided experiment (Bloomfield and Fisher, 2019).
The SPSS output and provide an interpretation of the results for the
Frequency table
Noisy neighbours/loud parties? Q134
Frequency Percent Valid Percent
Cumulative
Percent
Valid Very common 148 4.7 4.7 4.7
Fairly common 255 8.1 8.1 12.8
Not very common 1105 35.1 35.2 48.0
Not at all common 1635 52.0 52.0 100.0
Total 3143 99.9 100.0
Missing Don't know 3 .1
Total 3146 100.0
Interpretation: It has been interpreted from the above mentioned frequency table
cumulative percent of valid very common is 4.7%, fairly common is 12.8% not very common is
48% ant not at all common is 100 %. Along with this, missing don’t have cumulative percent
there is a valid percent i.e. 100. Therefor the total number of frequency is 2146 and percentage is
100.
Cross tabulation
Noisy neighbours/loud parties? Q134 * Age Grouped Crosstabulation
Age Grouped
Total
Young
Adult Adult Elderly
Very common Count 38 90 20 148
Noisy neighbours/loud parties?
Q134
% within Age
Grouped
6.6% 5.5% 2.2% 4.7%
Fairly common Count 67 134 54 255
% within Age
Grouped
11.6% 8.2% 5.9% 8.1%
Not very
common
Count 235 608 259 1102
% within Age
Grouped
40.7% 37.1% 28.3% 35.2%
Not at all
common
Count 238 808 583 1629
% within Age
Grouped
41.2% 49.3% 63.6% 52.0%
Total Count 578 1640 916 3134
% within Age
Grouped
100.0% 100.0% 100.0% 100.0%
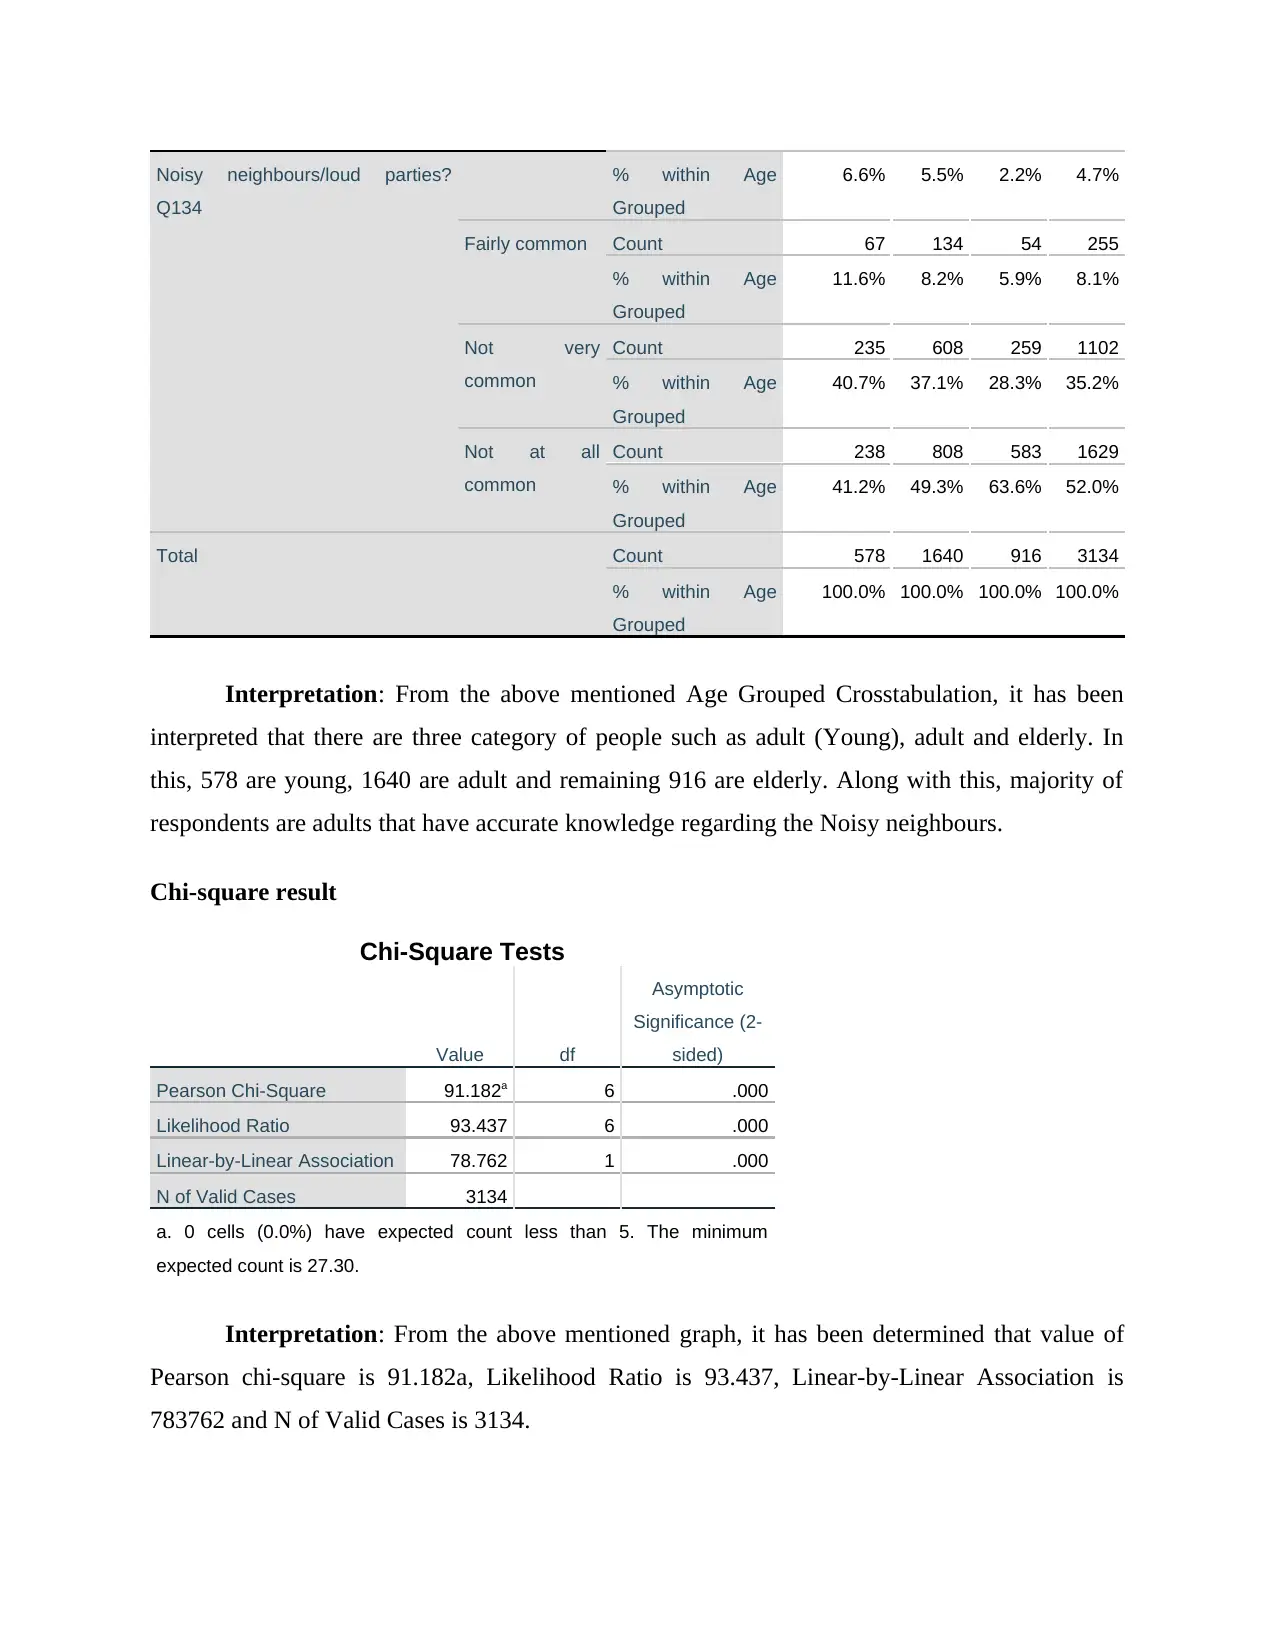
Interpretation: From the above mentioned Age Grouped Crosstabulation, it has been
interpreted that there are three category of people such as adult (Young), adult and elderly. In
this, 578 are young, 1640 are adult and remaining 916 are elderly. Along with this, majority of
respondents are adults that have accurate knowledge regarding the Noisy neighbours.
Chi-square result
Chi-Square Tests
Value df
Asymptotic
Significance (2-
sided)
Pearson Chi-Square 91.182a 6 .000
Likelihood Ratio 93.437 6 .000
Linear-by-Linear Association 78.762 1 .000
N of Valid Cases 3134
a. 0 cells (0.0%) have expected count less than 5. The minimum
expected count is 27.30.
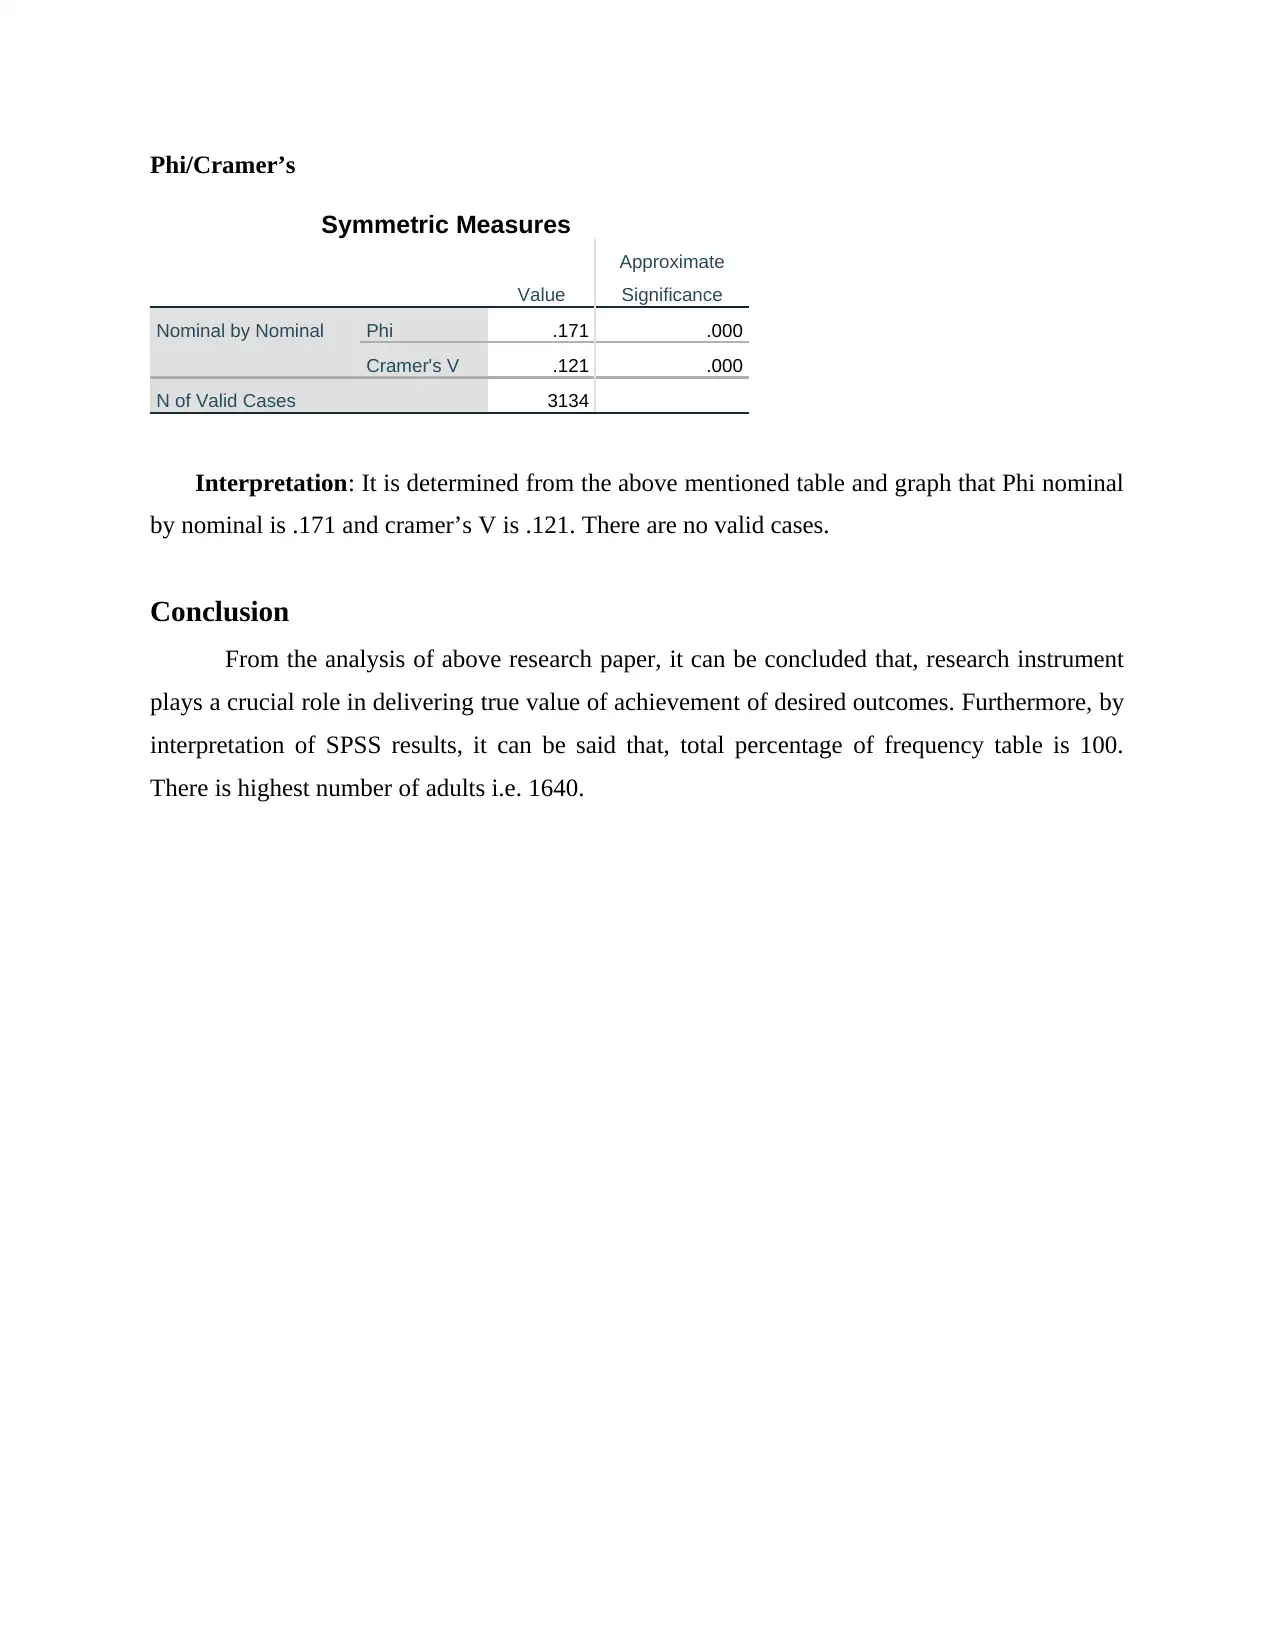
Interpretation: From the above mentioned graph, it has been determined that value of
Pearson chi-square is 91.182a, Likelihood Ratio is 93.437, Linear-by-Linear Association is
783762 and N of Valid Cases is 3134.
Q134
% within Age
Grouped
6.6% 5.5% 2.2% 4.7%
Fairly common Count 67 134 54 255
% within Age
Grouped
11.6% 8.2% 5.9% 8.1%
Not very
common
Count 235 608 259 1102
% within Age
Grouped
40.7% 37.1% 28.3% 35.2%
Not at all
common
Count 238 808 583 1629
% within Age
Grouped
41.2% 49.3% 63.6% 52.0%
Total Count 578 1640 916 3134
% within Age
Grouped
100.0% 100.0% 100.0% 100.0%
Interpretation: From the above mentioned Age Grouped Crosstabulation, it has been
interpreted that there are three category of people such as adult (Young), adult and elderly. In
this, 578 are young, 1640 are adult and remaining 916 are elderly. Along with this, majority of
respondents are adults that have accurate knowledge regarding the Noisy neighbours.
Chi-square result
Chi-Square Tests
Value df
Asymptotic
Significance (2-
sided)
Pearson Chi-Square 91.182a 6 .000
Likelihood Ratio 93.437 6 .000
Linear-by-Linear Association 78.762 1 .000
N of Valid Cases 3134
a. 0 cells (0.0%) have expected count less than 5. The minimum
expected count is 27.30.
Interpretation: From the above mentioned graph, it has been determined that value of
Pearson chi-square is 91.182a, Likelihood Ratio is 93.437, Linear-by-Linear Association is
783762 and N of Valid Cases is 3134.
⊘ This is a preview!⊘
Do you want full access?
Subscribe today to unlock all pages.
Trusted by 1+ million students worldwide
Phi/Cramer’s
Symmetric Measures
Value
Approximate
Significance
Nominal by Nominal Phi .171 .000
Cramer's V .121 .000
N of Valid Cases 3134
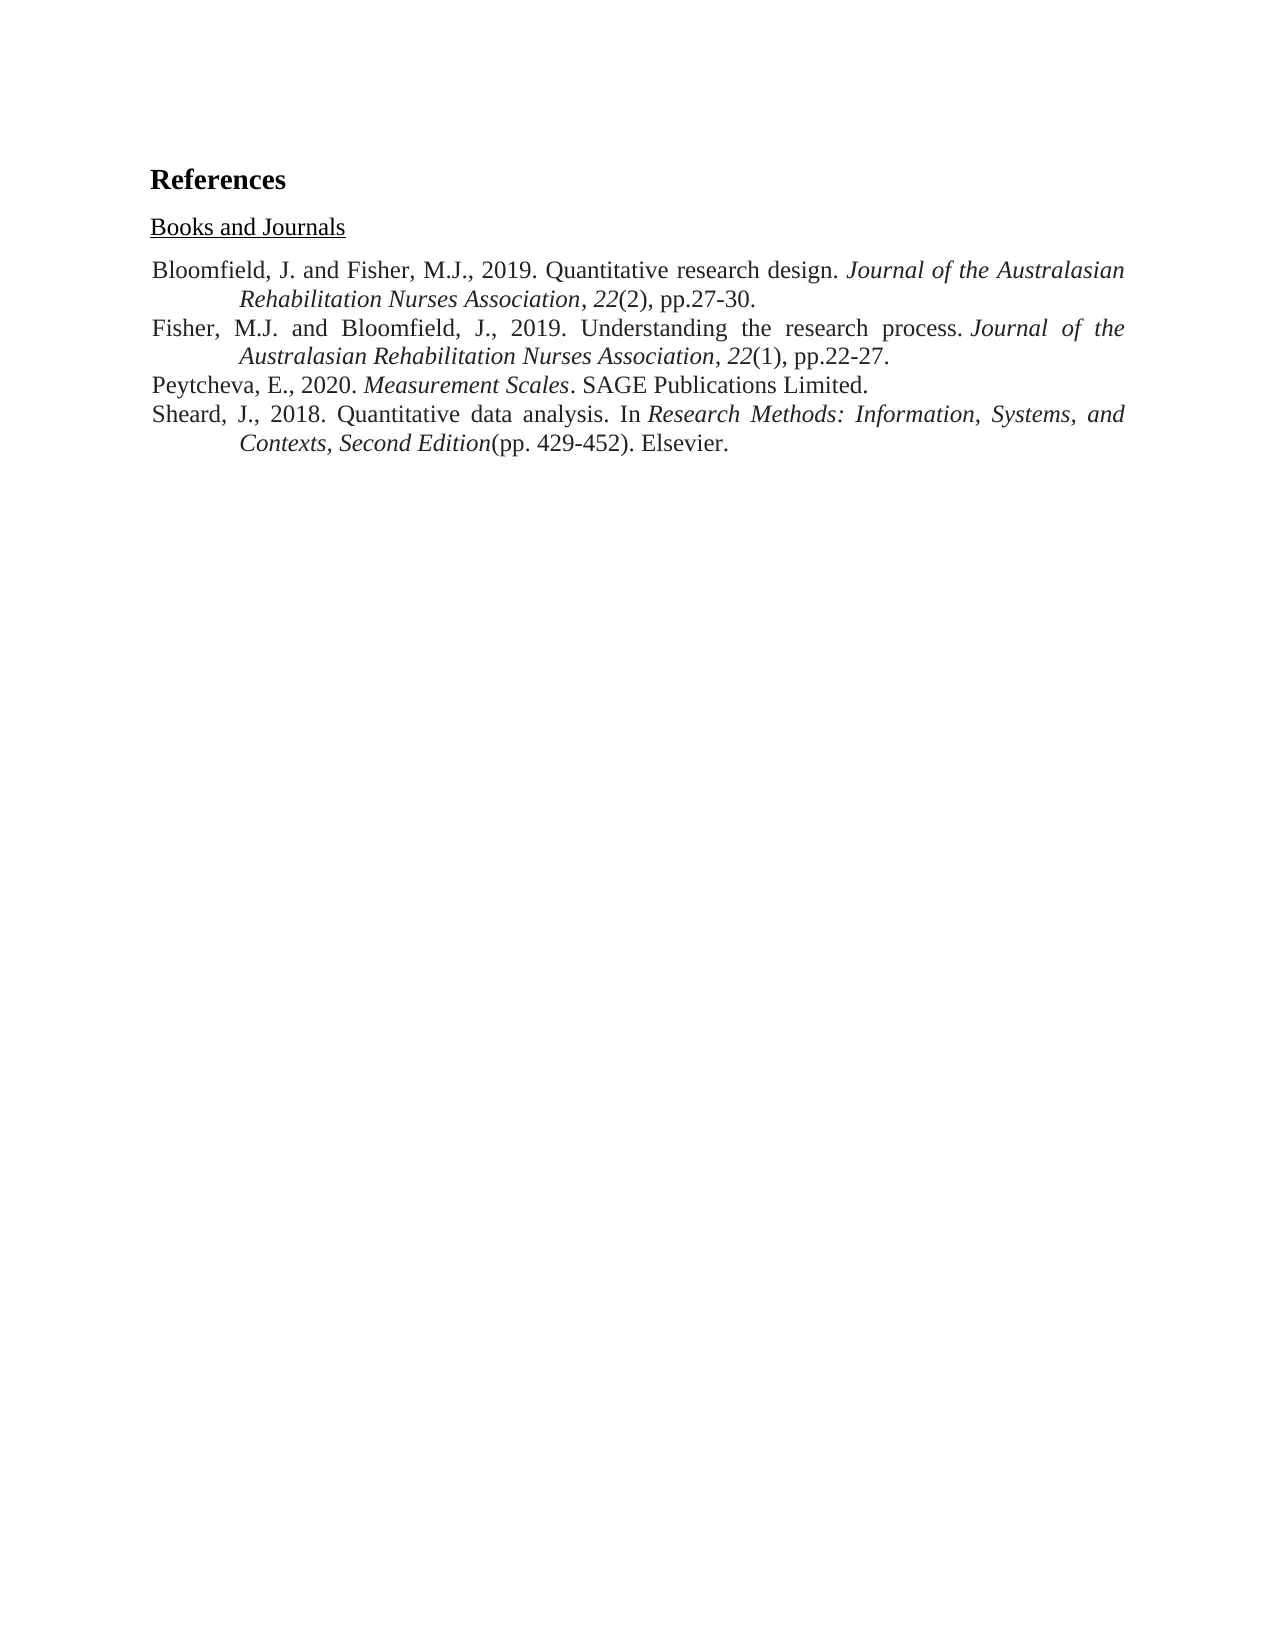
Interpretation: It is determined from the above mentioned table and graph that Phi nominal
by nominal is .171 and cramer’s V is .121. There are no valid cases.
Conclusion
From the analysis of above research paper, it can be concluded that, research instrument
plays a crucial role in delivering true value of achievement of desired outcomes. Furthermore, by
interpretation of SPSS results, it can be said that, total percentage of frequency table is 100.
There is highest number of adults i.e. 1640.
Symmetric Measures
Value
Approximate
Significance
Nominal by Nominal Phi .171 .000
Cramer's V .121 .000
N of Valid Cases 3134
Interpretation: It is determined from the above mentioned table and graph that Phi nominal
by nominal is .171 and cramer’s V is .121. There are no valid cases.
Conclusion
From the analysis of above research paper, it can be concluded that, research instrument
plays a crucial role in delivering true value of achievement of desired outcomes. Furthermore, by
interpretation of SPSS results, it can be said that, total percentage of frequency table is 100.
There is highest number of adults i.e. 1640.
Paraphrase This Document
Need a fresh take? Get an instant paraphrase of this document with our AI Paraphraser
References
Books and Journals
Bloomfield, J. and Fisher, M.J., 2019. Quantitative research design. Journal of the Australasian
Rehabilitation Nurses Association, 22(2), pp.27-30.
Fisher, M.J. and Bloomfield, J., 2019. Understanding the research process. Journal of the
Australasian Rehabilitation Nurses Association, 22(1), pp.22-27.
Peytcheva, E., 2020. Measurement Scales. SAGE Publications Limited.
Sheard, J., 2018. Quantitative data analysis. In Research Methods: Information, Systems, and
Contexts, Second Edition(pp. 429-452). Elsevier.
1 out of 8
Related Documents


Your All-in-One AI-Powered Toolkit for Academic Success.
+13062052269
info@desklib.com
Available 24*7 on WhatsApp / Email
![[object Object]](/_next/static/media/star-bottom.7253800d.svg)
Unlock your academic potential
© 2024 | Zucol Services PVT LTD | All rights reserved.