Quantitative Research Practice in Health PG (9585): Sem 1, 2021 - Quiz #2
VerifiedAdded on 2022/11/29
|4
|2057
|327
AI Summary
This document is a quiz for the course Quantitative Research Practice in Health PG (9585) for Semester 1, 2021. It includes multiple-choice questions and short answer questions related to research methods and statistical analysis.
Contribute Materials
Your contribution can guide someone’s learning journey. Share your
documents today.
QRMHP-Unit 9585 Semester 1, 2021
-----------------------------------------------------------------------------------------------------------------------------------------------
Quantitative Research Practice in Health PG (9585): Sem 1, 2021 - Quiz #2
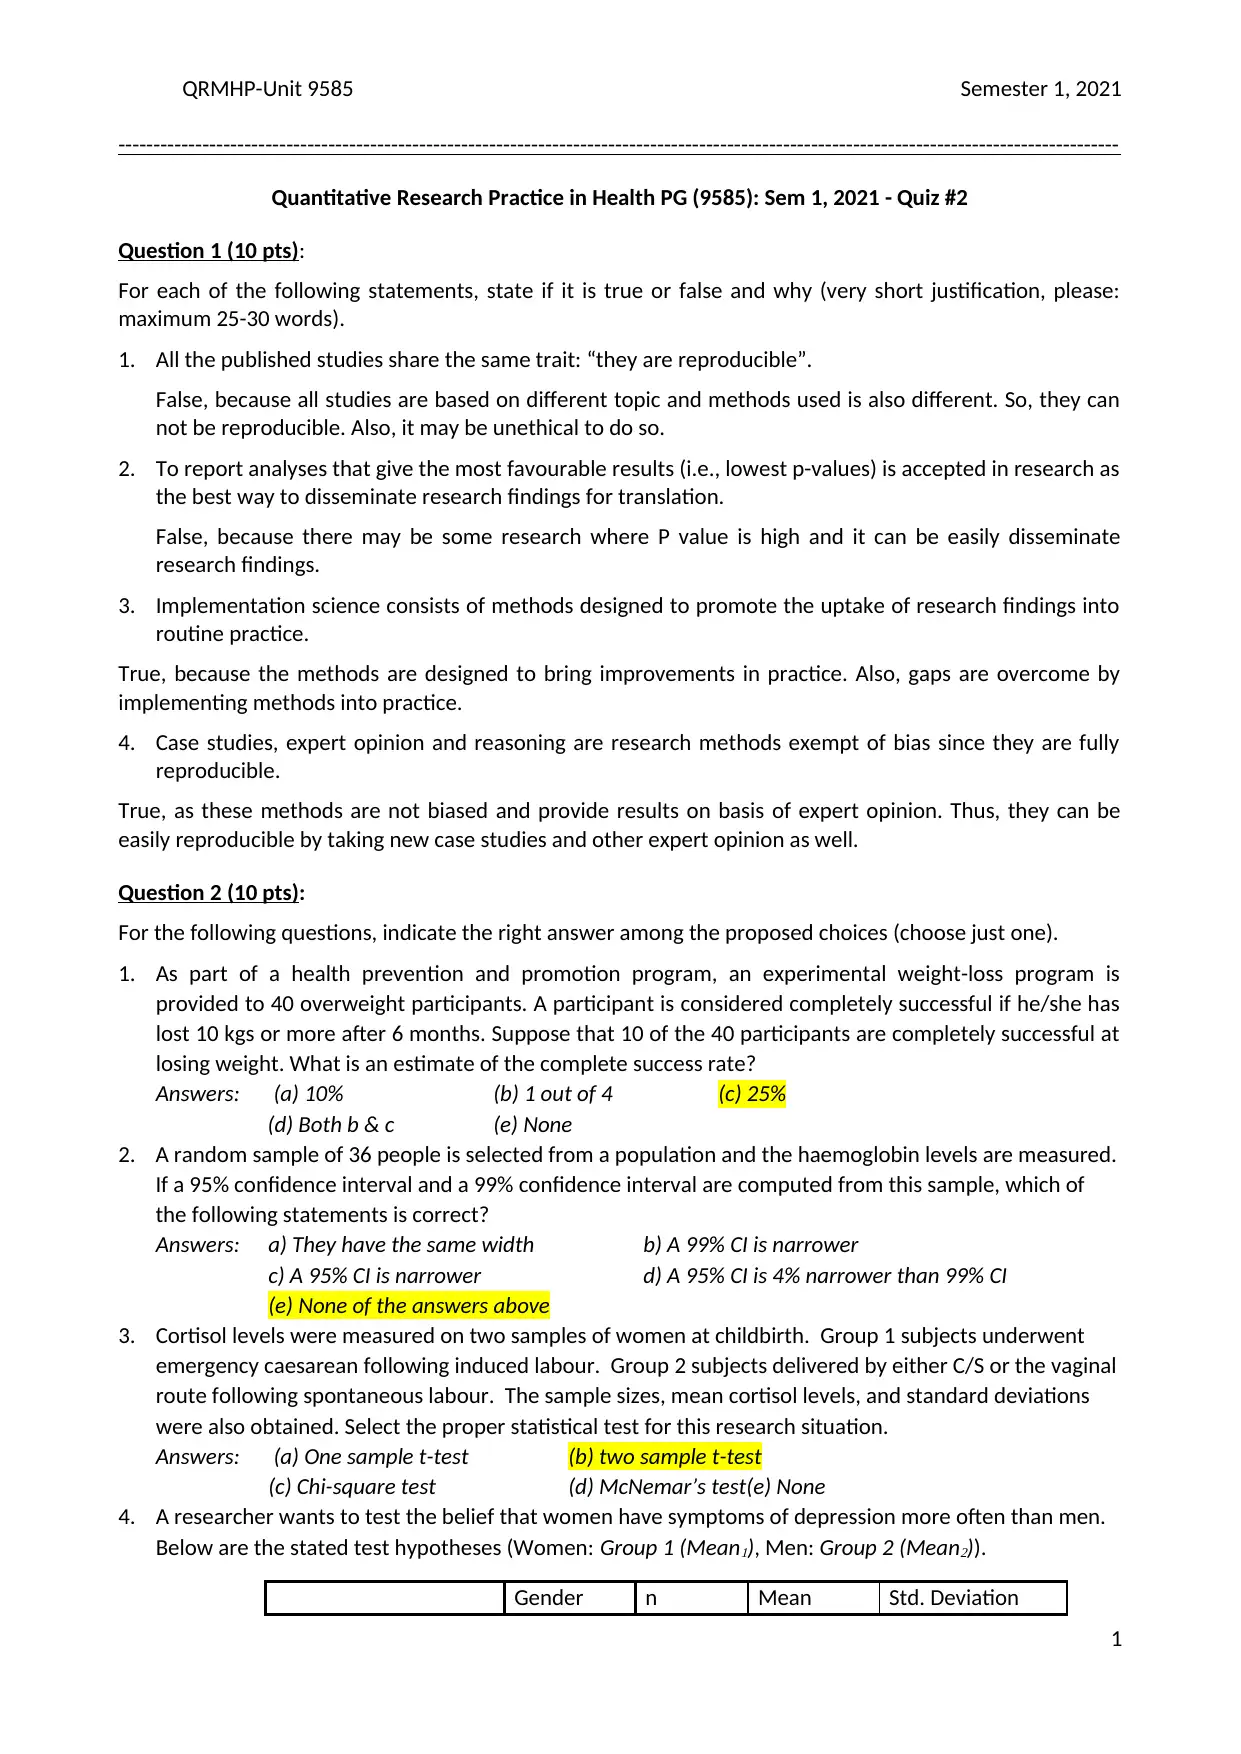
Question 1 (10 pts):
For each of the following statements, state if it is true or false and why (very short justification, please:
maximum 25-30 words).
1. All the published studies share the same trait: “they are reproducible”.
False, because all studies are based on different topic and methods used is also different. So, they can
not be reproducible. Also, it may be unethical to do so.
2. To report analyses that give the most favourable results (i.e., lowest p-values) is accepted in research as
the best way to disseminate research findings for translation.
False, because there may be some research where P value is high and it can be easily disseminate
research findings.
3. Implementation science consists of methods designed to promote the uptake of research findings into
routine practice.
True, because the methods are designed to bring improvements in practice. Also, gaps are overcome by
implementing methods into practice.
4. Case studies, expert opinion and reasoning are research methods exempt of bias since they are fully
reproducible.
True, as these methods are not biased and provide results on basis of expert opinion. Thus, they can be
easily reproducible by taking new case studies and other expert opinion as well.
Question 2 (10 pts):
For the following questions, indicate the right answer among the proposed choices (choose just one).
1. As part of a health prevention and promotion program, an experimental weight-loss program is
provided to 40 overweight participants. A participant is considered completely successful if he/she has
lost 10 kgs or more after 6 months. Suppose that 10 of the 40 participants are completely successful at
losing weight. What is an estimate of the complete success rate?
Answers: (a) 10% (b) 1 out of 4 (c) 25%
(d) Both b & c (e) None
2. A random sample of 36 people is selected from a population and the haemoglobin levels are measured.
If a 95% confidence interval and a 99% confidence interval are computed from this sample, which of
the following statements is correct?
Answers: a) They have the same width b) A 99% CI is narrower
c) A 95% CI is narrower d) A 95% CI is 4% narrower than 99% CI
(e) None of the answers above
3. Cortisol levels were measured on two samples of women at childbirth. Group 1 subjects underwent
emergency caesarean following induced labour. Group 2 subjects delivered by either C/S or the vaginal
route following spontaneous labour. The sample sizes, mean cortisol levels, and standard deviations
were also obtained. Select the proper statistical test for this research situation.
Answers: (a) One sample t-test (b) two sample t-test
(c) Chi-square test (d) McNemar’s test(e) None
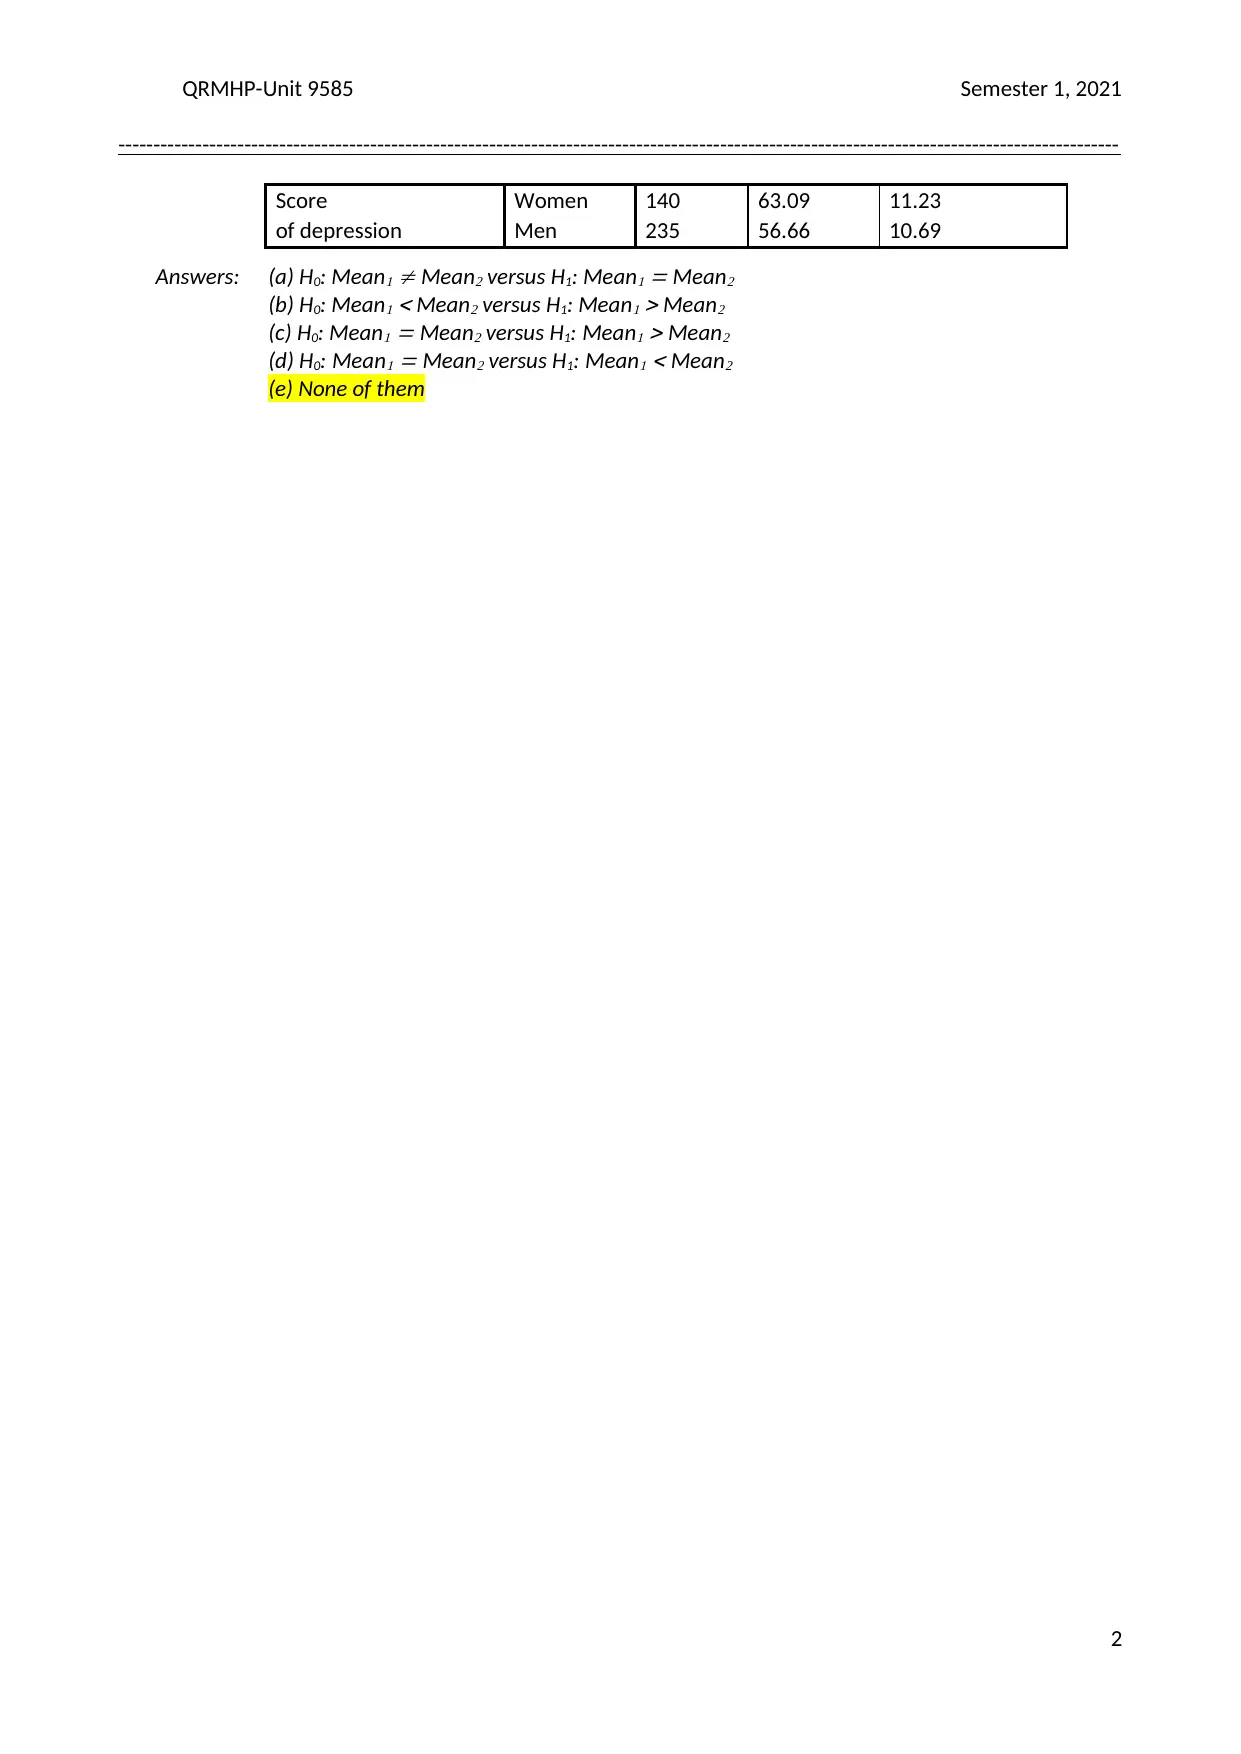
4. A researcher wants to test the belief that women have symptoms of depression more often than men.
Below are the stated test hypotheses (Women: Group 1 (Mean
), Men: Group 2 (Mean
)).
Gender n Mean Std. Deviation
1
-----------------------------------------------------------------------------------------------------------------------------------------------
Quantitative Research Practice in Health PG (9585): Sem 1, 2021 - Quiz #2
Question 1 (10 pts):
For each of the following statements, state if it is true or false and why (very short justification, please:
maximum 25-30 words).
1. All the published studies share the same trait: “they are reproducible”.
False, because all studies are based on different topic and methods used is also different. So, they can
not be reproducible. Also, it may be unethical to do so.
2. To report analyses that give the most favourable results (i.e., lowest p-values) is accepted in research as
the best way to disseminate research findings for translation.
False, because there may be some research where P value is high and it can be easily disseminate
research findings.
3. Implementation science consists of methods designed to promote the uptake of research findings into
routine practice.
True, because the methods are designed to bring improvements in practice. Also, gaps are overcome by
implementing methods into practice.
4. Case studies, expert opinion and reasoning are research methods exempt of bias since they are fully
reproducible.
True, as these methods are not biased and provide results on basis of expert opinion. Thus, they can be
easily reproducible by taking new case studies and other expert opinion as well.
Question 2 (10 pts):
For the following questions, indicate the right answer among the proposed choices (choose just one).
1. As part of a health prevention and promotion program, an experimental weight-loss program is
provided to 40 overweight participants. A participant is considered completely successful if he/she has
lost 10 kgs or more after 6 months. Suppose that 10 of the 40 participants are completely successful at
losing weight. What is an estimate of the complete success rate?
Answers: (a) 10% (b) 1 out of 4 (c) 25%
(d) Both b & c (e) None
2. A random sample of 36 people is selected from a population and the haemoglobin levels are measured.
If a 95% confidence interval and a 99% confidence interval are computed from this sample, which of
the following statements is correct?
Answers: a) They have the same width b) A 99% CI is narrower
c) A 95% CI is narrower d) A 95% CI is 4% narrower than 99% CI
(e) None of the answers above
3. Cortisol levels were measured on two samples of women at childbirth. Group 1 subjects underwent
emergency caesarean following induced labour. Group 2 subjects delivered by either C/S or the vaginal
route following spontaneous labour. The sample sizes, mean cortisol levels, and standard deviations
were also obtained. Select the proper statistical test for this research situation.
Answers: (a) One sample t-test (b) two sample t-test
(c) Chi-square test (d) McNemar’s test(e) None
4. A researcher wants to test the belief that women have symptoms of depression more often than men.
Below are the stated test hypotheses (Women: Group 1 (Mean
), Men: Group 2 (Mean
)).
Gender n Mean Std. Deviation
1
Secure Best Marks with AI Grader
Need help grading? Try our AI Grader for instant feedback on your assignments.
QRMHP-Unit 9585 Semester 1, 2021
-----------------------------------------------------------------------------------------------------------------------------------------------
Score Women 140 63.09 11.23
of depression Men 235 56.66 10.69
Answers: (a) H0: Mean
Mean
versus H1: Mean
Mean
(b) H0: Mean
Mean
versus H1: Mean
Mean
(c) H0: Mean
Mean
versus H1: Mean
Mean
(d) H0: Mean
Mean
versus H1: Mean
Mean
(e) None of them
2
QRMHP-Unit 9585 Semester 1, 2021
-----------------------------------------------------------------------------------------------------------------------------------------------
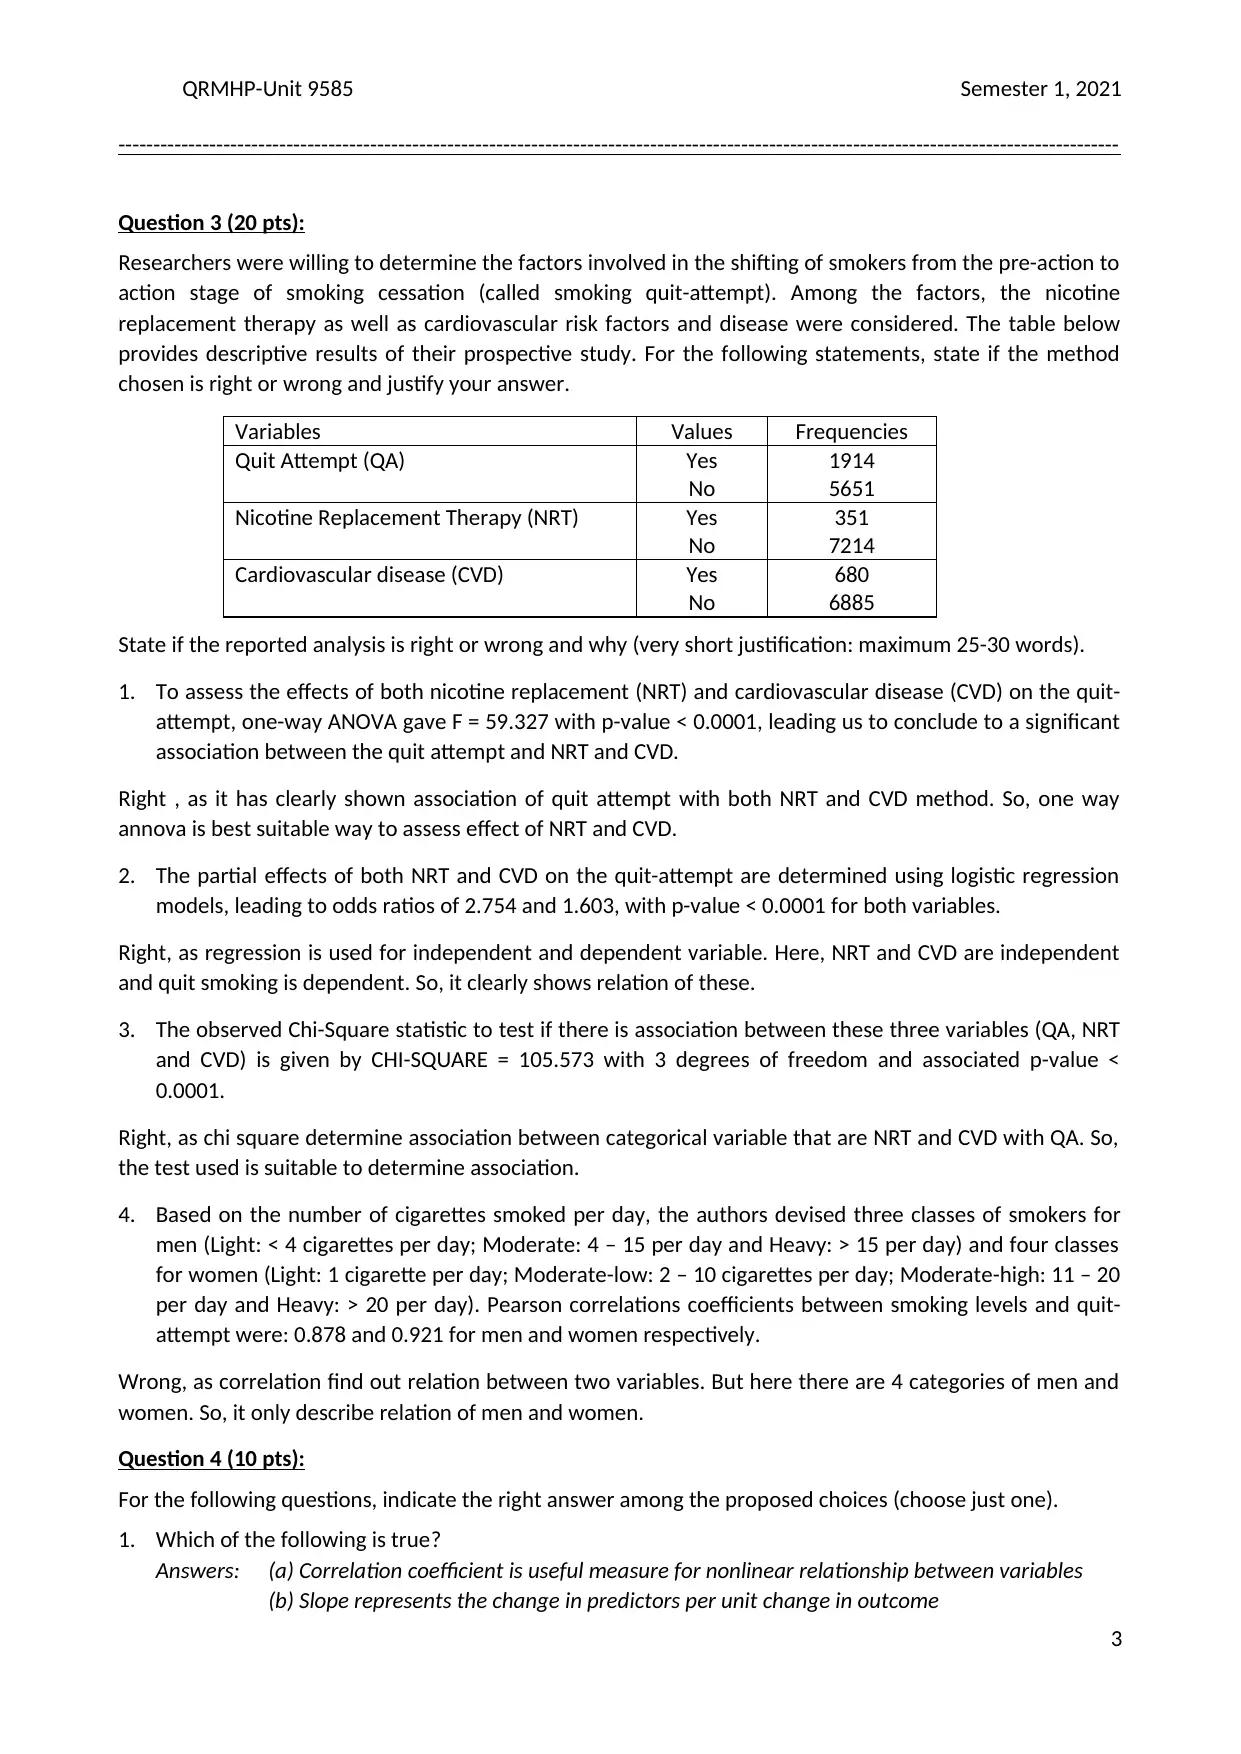
Question 3 (20 pts):
Researchers were willing to determine the factors involved in the shifting of smokers from the pre-action to
action stage of smoking cessation (called smoking quit-attempt). Among the factors, the nicotine
replacement therapy as well as cardiovascular risk factors and disease were considered. The table below
provides descriptive results of their prospective study. For the following statements, state if the method
chosen is right or wrong and justify your answer.
Variables Values Frequencies
Quit Attempt (QA) Yes
No
1914
5651
Nicotine Replacement Therapy (NRT) Yes
No
351
7214
Cardiovascular disease (CVD) Yes
No
680
6885
State if the reported analysis is right or wrong and why (very short justification: maximum 25-30 words).
1. To assess the effects of both nicotine replacement (NRT) and cardiovascular disease (CVD) on the quit-
attempt, one-way ANOVA gave F = 59.327 with p-value < 0.0001, leading us to conclude to a significant
association between the quit attempt and NRT and CVD.
Right , as it has clearly shown association of quit attempt with both NRT and CVD method. So, one way
annova is best suitable way to assess effect of NRT and CVD.
2. The partial effects of both NRT and CVD on the quit-attempt are determined using logistic regression
models, leading to odds ratios of 2.754 and 1.603, with p-value < 0.0001 for both variables.
Right, as regression is used for independent and dependent variable. Here, NRT and CVD are independent
and quit smoking is dependent. So, it clearly shows relation of these.
3. The observed Chi-Square statistic to test if there is association between these three variables (QA, NRT
and CVD) is given by CHI-SQUARE = 105.573 with 3 degrees of freedom and associated p-value <
0.0001.
Right, as chi square determine association between categorical variable that are NRT and CVD with QA. So,
the test used is suitable to determine association.
4. Based on the number of cigarettes smoked per day, the authors devised three classes of smokers for
men (Light: < 4 cigarettes per day; Moderate: 4 – 15 per day and Heavy: > 15 per day) and four classes
for women (Light: 1 cigarette per day; Moderate-low: 2 – 10 cigarettes per day; Moderate-high: 11 – 20
per day and Heavy: > 20 per day). Pearson correlations coefficients between smoking levels and quit-
attempt were: 0.878 and 0.921 for men and women respectively.
Wrong, as correlation find out relation between two variables. But here there are 4 categories of men and
women. So, it only describe relation of men and women.
Question 4 (10 pts):
For the following questions, indicate the right answer among the proposed choices (choose just one).
1. Which of the following is true?
Answers: (a) Correlation coefficient is useful measure for nonlinear relationship between variables
(b) Slope represents the change in predictors per unit change in outcome
3
-----------------------------------------------------------------------------------------------------------------------------------------------
Question 3 (20 pts):
Researchers were willing to determine the factors involved in the shifting of smokers from the pre-action to
action stage of smoking cessation (called smoking quit-attempt). Among the factors, the nicotine
replacement therapy as well as cardiovascular risk factors and disease were considered. The table below
provides descriptive results of their prospective study. For the following statements, state if the method
chosen is right or wrong and justify your answer.
Variables Values Frequencies
Quit Attempt (QA) Yes
No
1914
5651
Nicotine Replacement Therapy (NRT) Yes
No
351
7214
Cardiovascular disease (CVD) Yes
No
680
6885
State if the reported analysis is right or wrong and why (very short justification: maximum 25-30 words).
1. To assess the effects of both nicotine replacement (NRT) and cardiovascular disease (CVD) on the quit-
attempt, one-way ANOVA gave F = 59.327 with p-value < 0.0001, leading us to conclude to a significant
association between the quit attempt and NRT and CVD.
Right , as it has clearly shown association of quit attempt with both NRT and CVD method. So, one way
annova is best suitable way to assess effect of NRT and CVD.
2. The partial effects of both NRT and CVD on the quit-attempt are determined using logistic regression
models, leading to odds ratios of 2.754 and 1.603, with p-value < 0.0001 for both variables.
Right, as regression is used for independent and dependent variable. Here, NRT and CVD are independent
and quit smoking is dependent. So, it clearly shows relation of these.
3. The observed Chi-Square statistic to test if there is association between these three variables (QA, NRT
and CVD) is given by CHI-SQUARE = 105.573 with 3 degrees of freedom and associated p-value <
0.0001.
Right, as chi square determine association between categorical variable that are NRT and CVD with QA. So,
the test used is suitable to determine association.
4. Based on the number of cigarettes smoked per day, the authors devised three classes of smokers for
men (Light: < 4 cigarettes per day; Moderate: 4 – 15 per day and Heavy: > 15 per day) and four classes
for women (Light: 1 cigarette per day; Moderate-low: 2 – 10 cigarettes per day; Moderate-high: 11 – 20
per day and Heavy: > 20 per day). Pearson correlations coefficients between smoking levels and quit-
attempt were: 0.878 and 0.921 for men and women respectively.
Wrong, as correlation find out relation between two variables. But here there are 4 categories of men and
women. So, it only describe relation of men and women.
Question 4 (10 pts):
For the following questions, indicate the right answer among the proposed choices (choose just one).
1. Which of the following is true?
Answers: (a) Correlation coefficient is useful measure for nonlinear relationship between variables
(b) Slope represents the change in predictors per unit change in outcome
3
QRMHP-Unit 9585 Semester 1, 2021
-----------------------------------------------------------------------------------------------------------------------------------------------
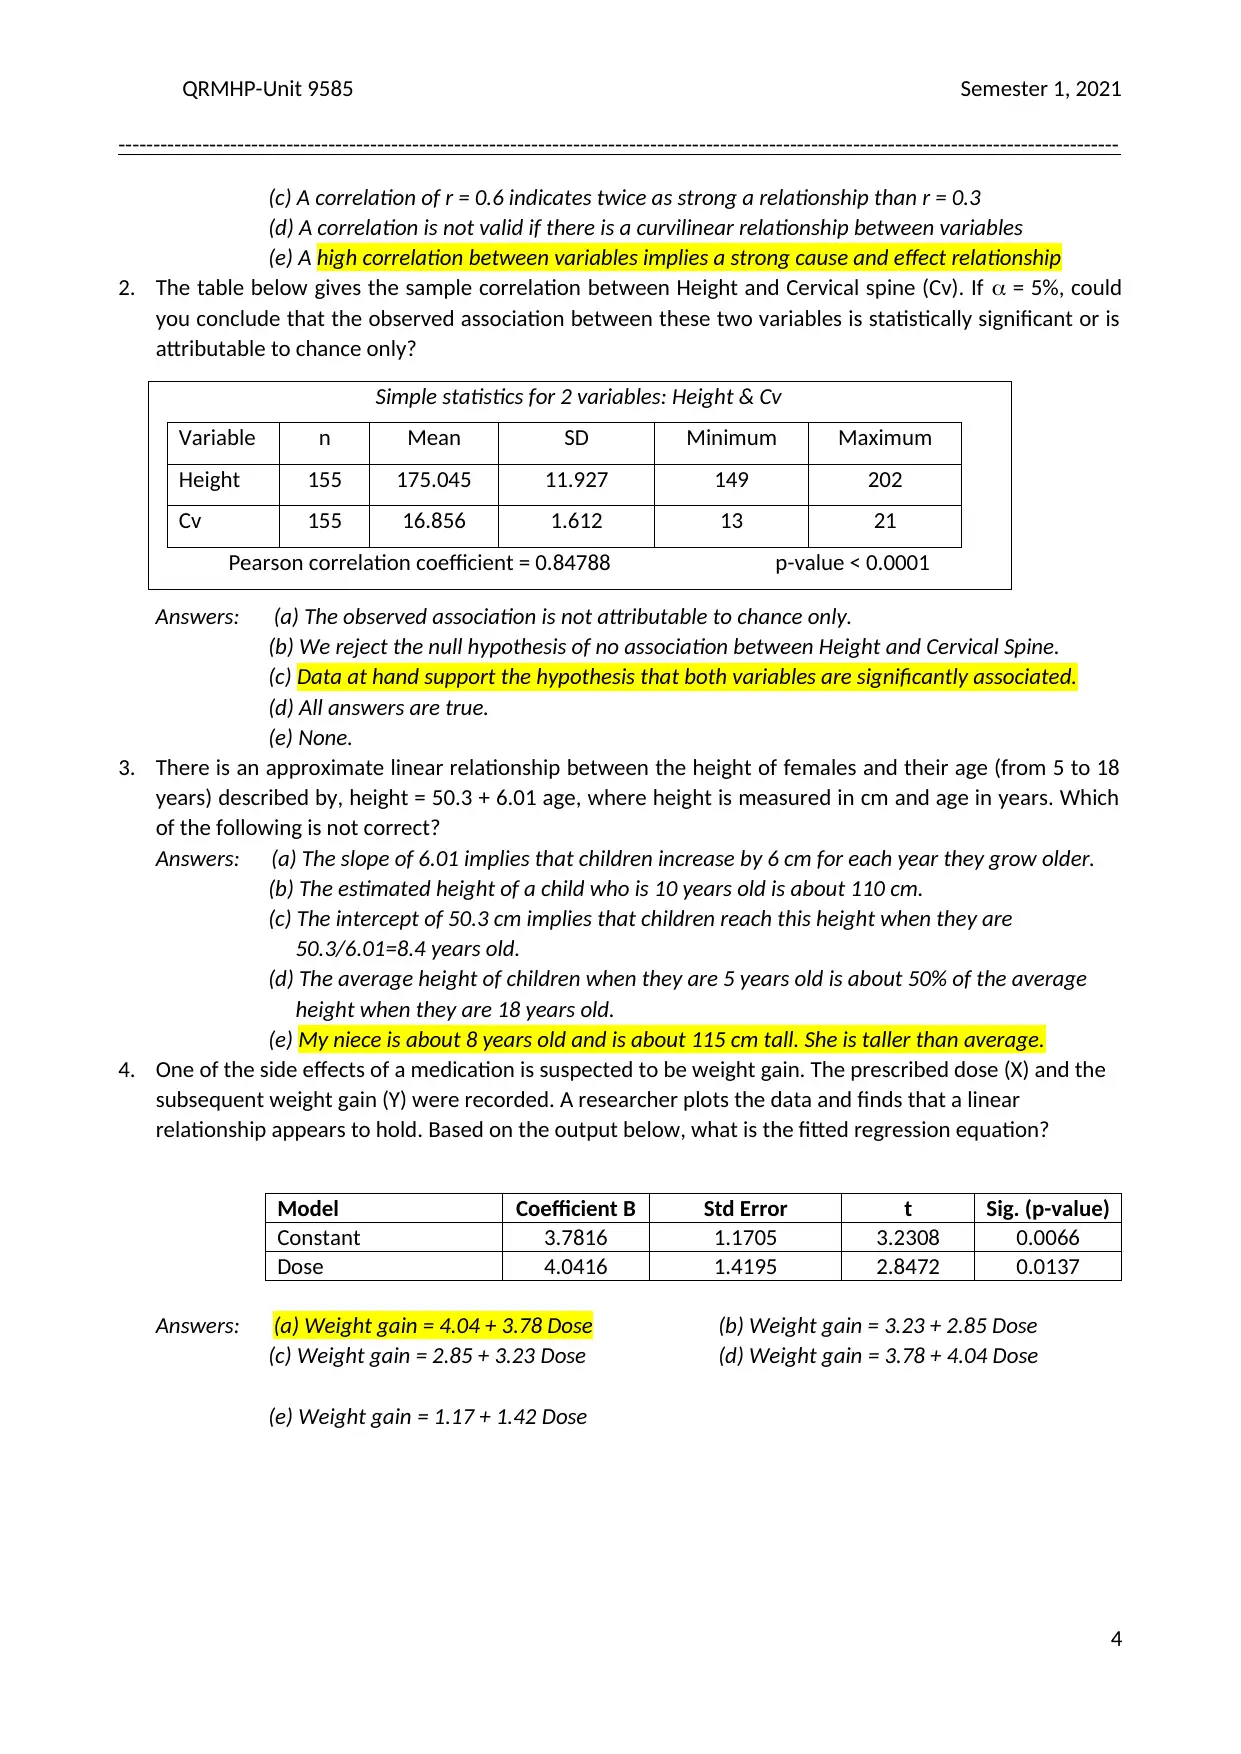
(c) A correlation of r = 0.6 indicates twice as strong a relationship than r = 0.3
(d) A correlation is not valid if there is a curvilinear relationship between variables
(e) A high correlation between variables implies a strong cause and effect relationship
2. The table below gives the sample correlation between Height and Cervical spine (Cv). If = 5%, could
you conclude that the observed association between these two variables is statistically significant or is
attributable to chance only?
Simple statistics for 2 variables: Height & Cv
Variable n Mean SD Minimum Maximum
Height 155 175.045 11.927 149 202
Cv 155 16.856 1.612 13 21
Pearson correlation coefficient = 0.84788 p-value < 0.0001
Answers: (a) The observed association is not attributable to chance only.
(b) We reject the null hypothesis of no association between Height and Cervical Spine.
(c) Data at hand support the hypothesis that both variables are significantly associated.
(d) All answers are true.
(e) None.
3. There is an approximate linear relationship between the height of females and their age (from 5 to 18
years) described by, height = 50.3 + 6.01 age, where height is measured in cm and age in years. Which
of the following is not correct?
Answers: (a) The slope of 6.01 implies that children increase by 6 cm for each year they grow older.
(b) The estimated height of a child who is 10 years old is about 110 cm.
(c) The intercept of 50.3 cm implies that children reach this height when they are
50.3/6.01=8.4 years old.
(d) The average height of children when they are 5 years old is about 50% of the average
height when they are 18 years old.
(e) My niece is about 8 years old and is about 115 cm tall. She is taller than average.
4. One of the side effects of a medication is suspected to be weight gain. The prescribed dose (X) and the
subsequent weight gain (Y) were recorded. A researcher plots the data and finds that a linear
relationship appears to hold. Based on the output below, what is the fitted regression equation?
Model Coefficient B Std Error t Sig. (p-value)
Constant 3.7816 1.1705 3.2308 0.0066
Dose 4.0416 1.4195 2.8472 0.0137
Answers: (a) Weight gain = 4.04 + 3.78 Dose (b) Weight gain = 3.23 + 2.85 Dose
(c) Weight gain = 2.85 + 3.23 Dose (d) Weight gain = 3.78 + 4.04 Dose
(e) Weight gain = 1.17 + 1.42 Dose
4
-----------------------------------------------------------------------------------------------------------------------------------------------
(c) A correlation of r = 0.6 indicates twice as strong a relationship than r = 0.3
(d) A correlation is not valid if there is a curvilinear relationship between variables
(e) A high correlation between variables implies a strong cause and effect relationship
2. The table below gives the sample correlation between Height and Cervical spine (Cv). If = 5%, could
you conclude that the observed association between these two variables is statistically significant or is
attributable to chance only?
Simple statistics for 2 variables: Height & Cv
Variable n Mean SD Minimum Maximum
Height 155 175.045 11.927 149 202
Cv 155 16.856 1.612 13 21
Pearson correlation coefficient = 0.84788 p-value < 0.0001
Answers: (a) The observed association is not attributable to chance only.
(b) We reject the null hypothesis of no association between Height and Cervical Spine.
(c) Data at hand support the hypothesis that both variables are significantly associated.
(d) All answers are true.
(e) None.
3. There is an approximate linear relationship between the height of females and their age (from 5 to 18
years) described by, height = 50.3 + 6.01 age, where height is measured in cm and age in years. Which
of the following is not correct?
Answers: (a) The slope of 6.01 implies that children increase by 6 cm for each year they grow older.
(b) The estimated height of a child who is 10 years old is about 110 cm.
(c) The intercept of 50.3 cm implies that children reach this height when they are
50.3/6.01=8.4 years old.
(d) The average height of children when they are 5 years old is about 50% of the average
height when they are 18 years old.
(e) My niece is about 8 years old and is about 115 cm tall. She is taller than average.
4. One of the side effects of a medication is suspected to be weight gain. The prescribed dose (X) and the
subsequent weight gain (Y) were recorded. A researcher plots the data and finds that a linear
relationship appears to hold. Based on the output below, what is the fitted regression equation?
Model Coefficient B Std Error t Sig. (p-value)
Constant 3.7816 1.1705 3.2308 0.0066
Dose 4.0416 1.4195 2.8472 0.0137
Answers: (a) Weight gain = 4.04 + 3.78 Dose (b) Weight gain = 3.23 + 2.85 Dose
(c) Weight gain = 2.85 + 3.23 Dose (d) Weight gain = 3.78 + 4.04 Dose
(e) Weight gain = 1.17 + 1.42 Dose
4
1 out of 4


Your All-in-One AI-Powered Toolkit for Academic Success.
+13062052269
info@desklib.com
Available 24*7 on WhatsApp / Email
![[object Object]](/_next/static/media/star-bottom.7253800d.svg)
Unlock your academic potential
© 2024 | Zucol Services PVT LTD | All rights reserved.