Curtin University ECOM2001 Project: Financial Asset Portfolio Analysis
VerifiedAdded on 2023/06/03
|15
|1655
|255
Project
AI Summary
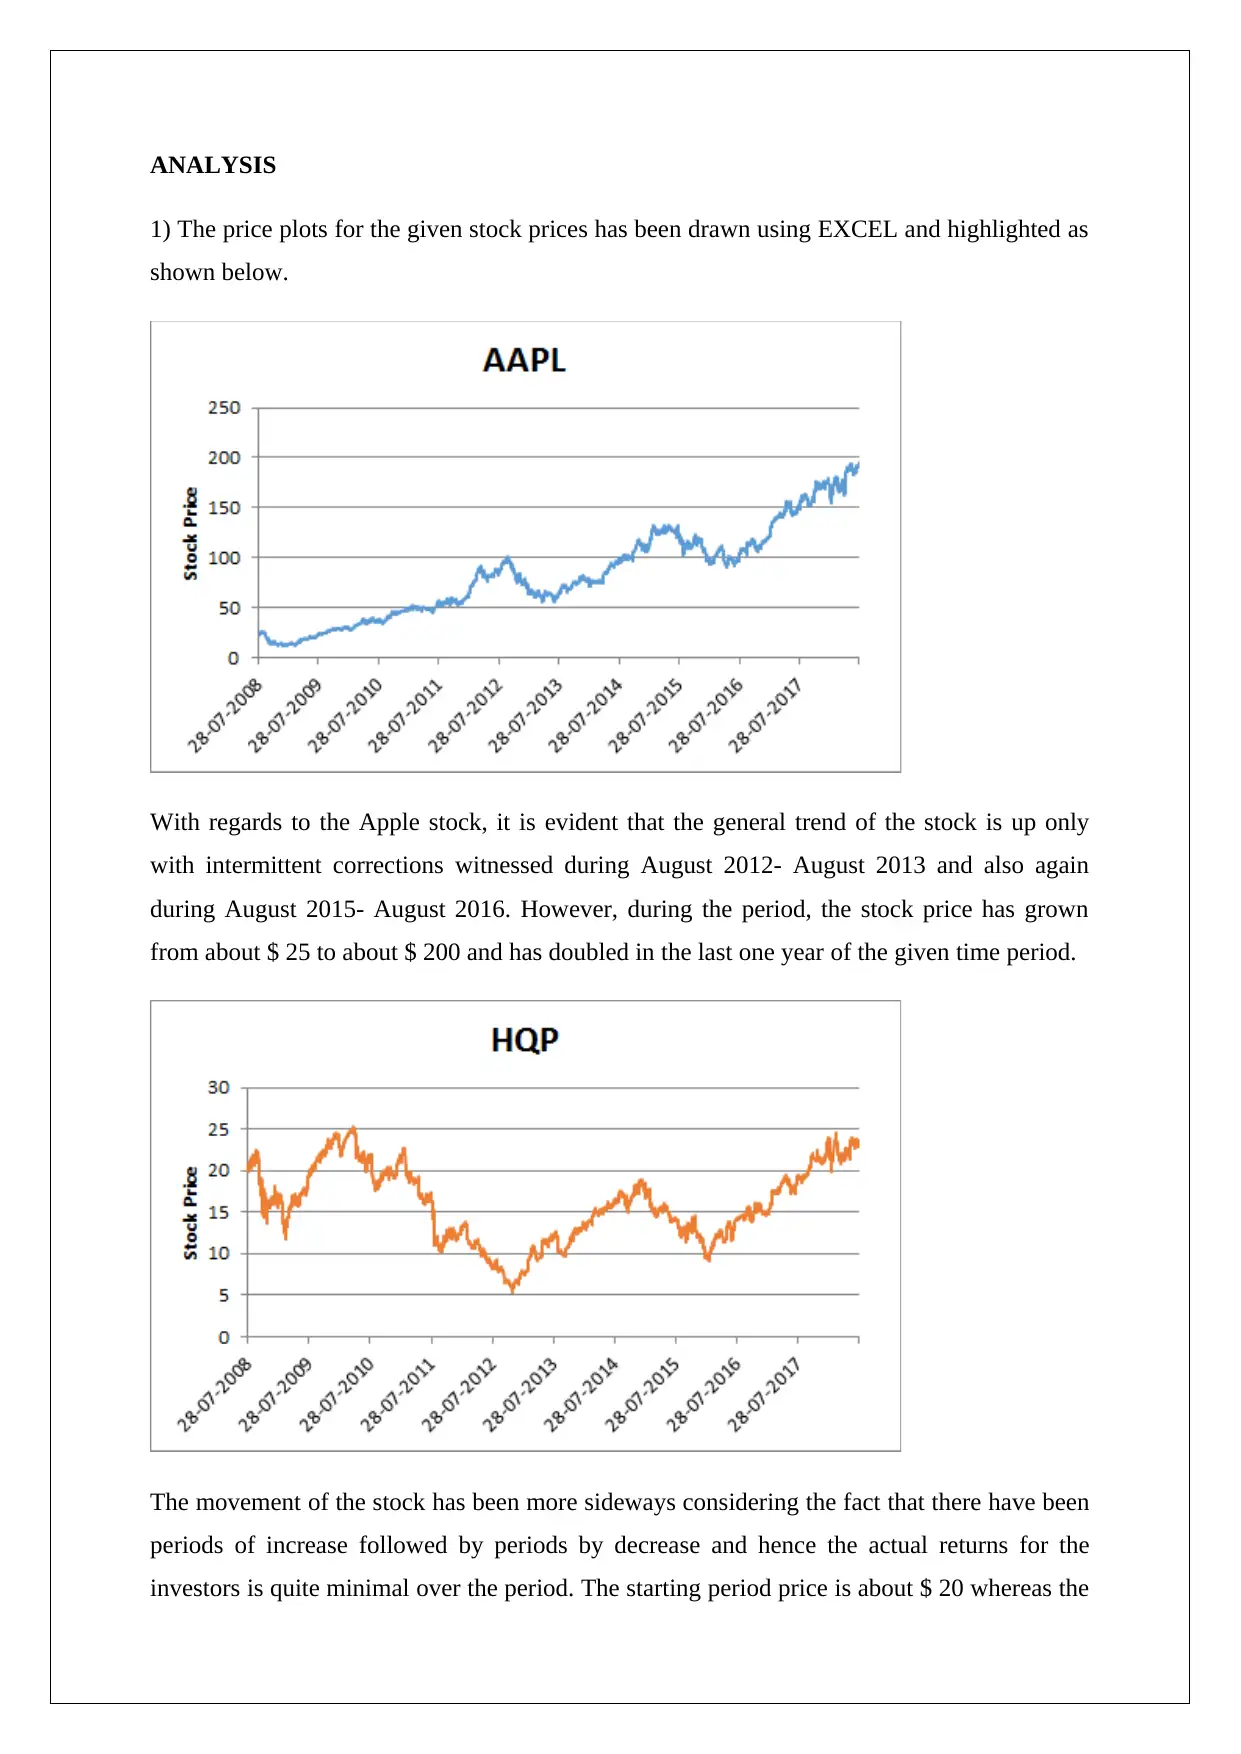
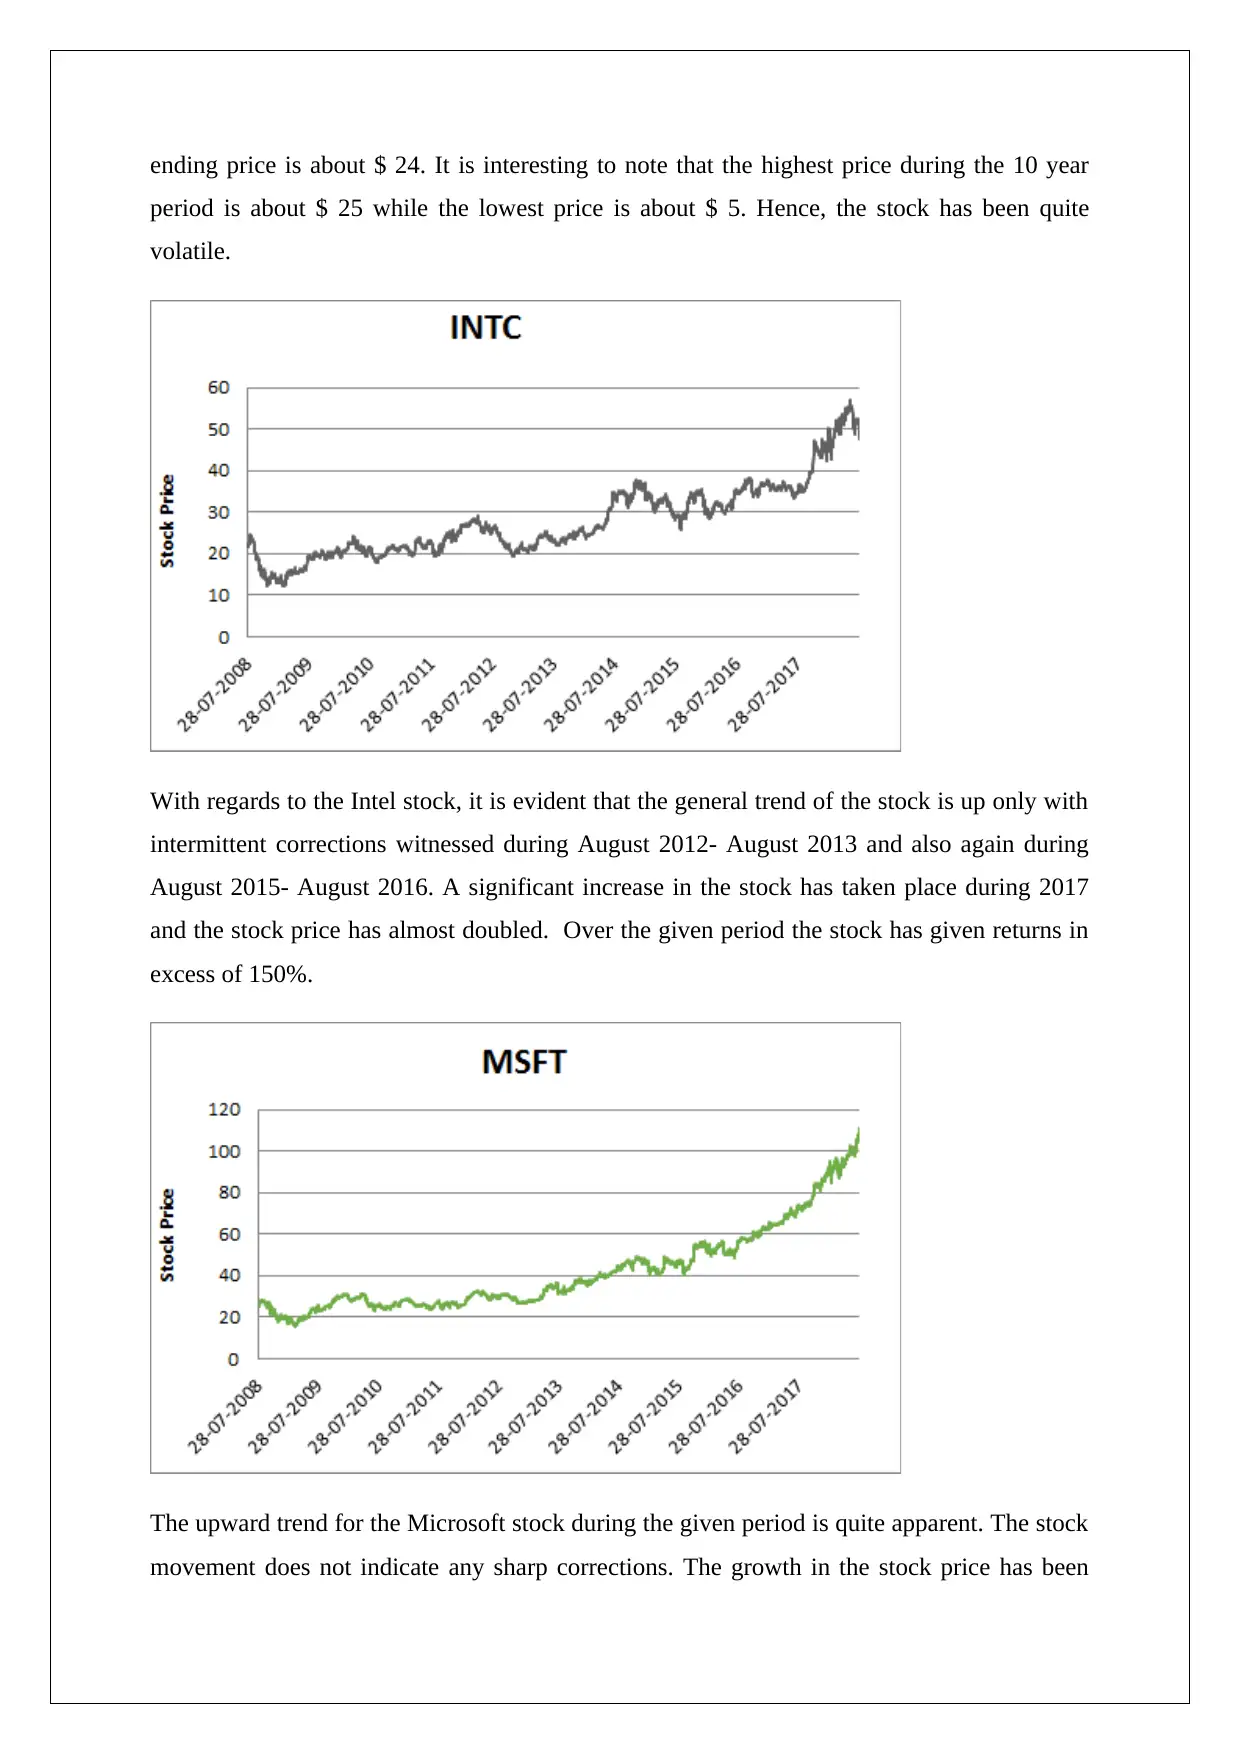
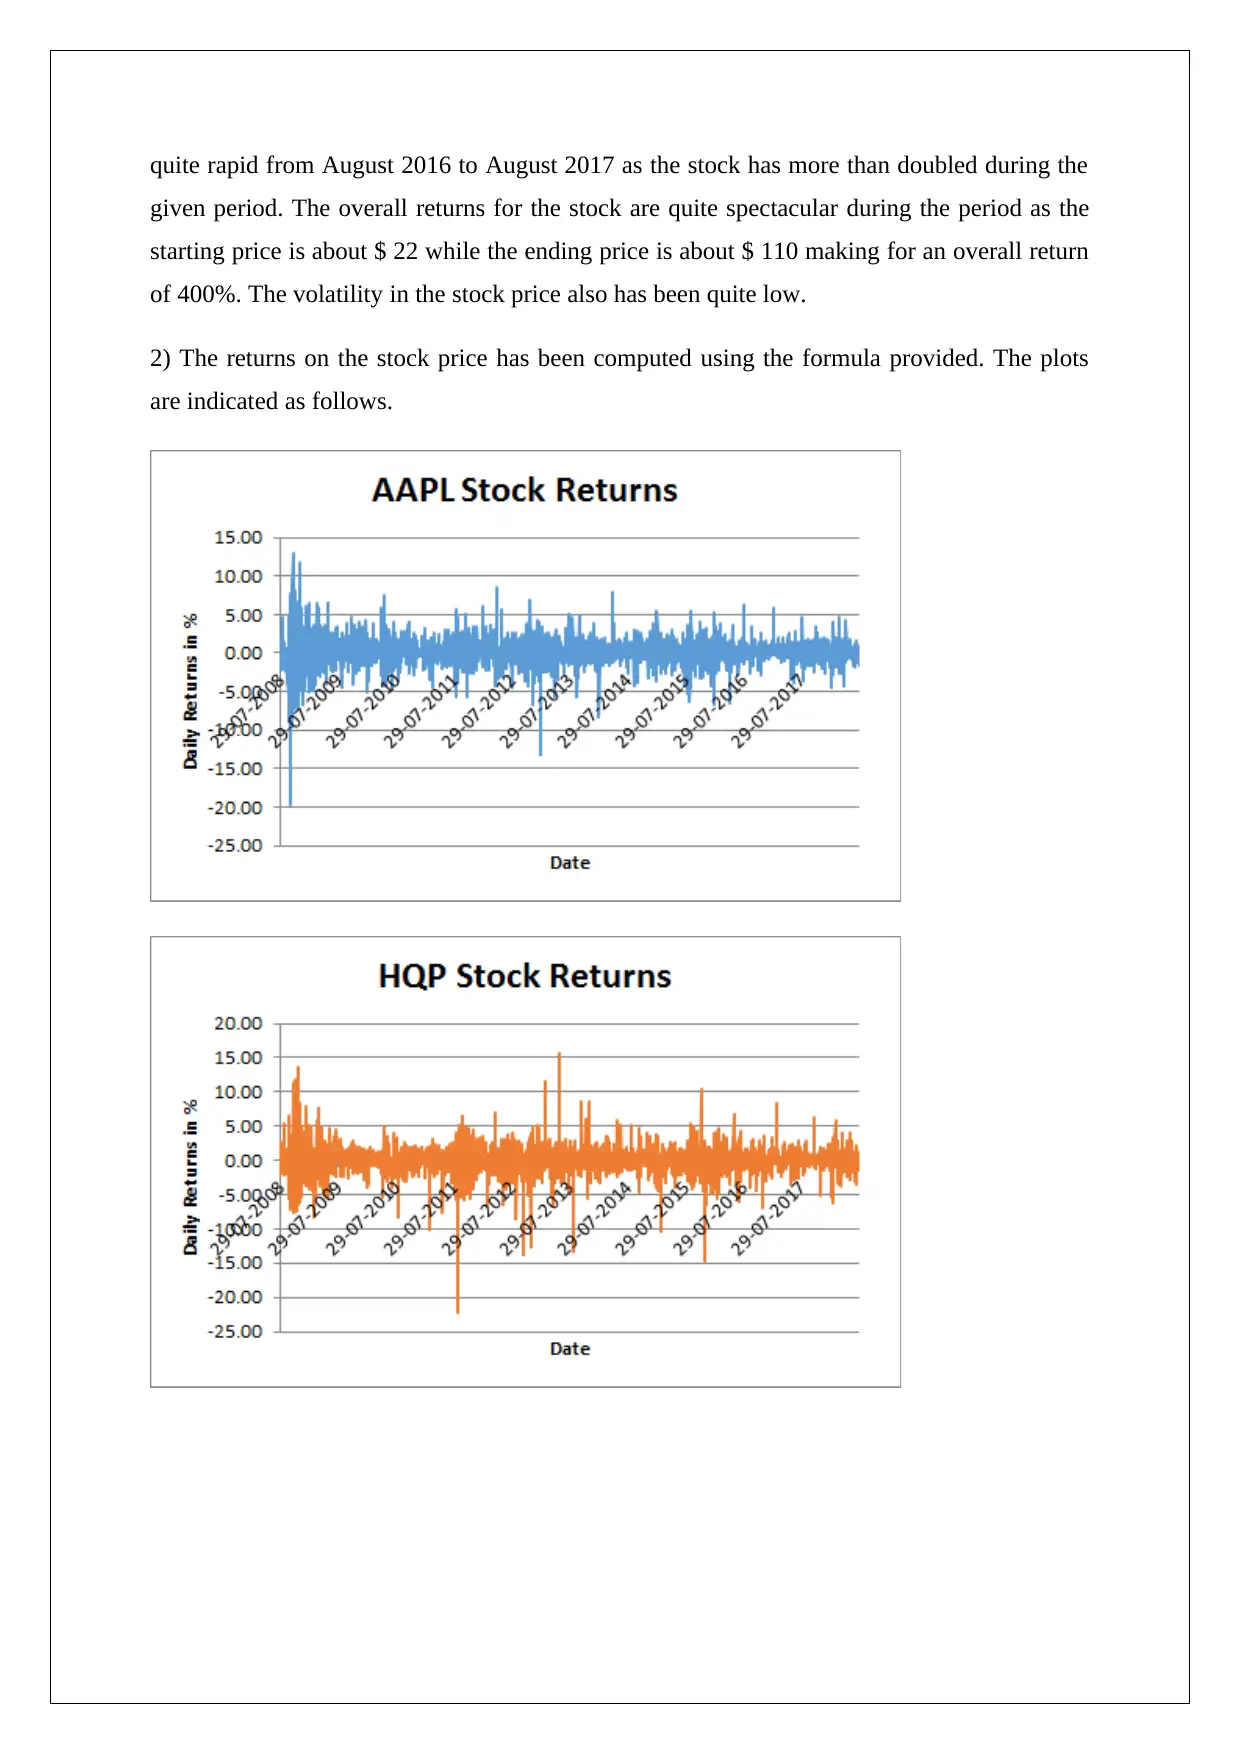
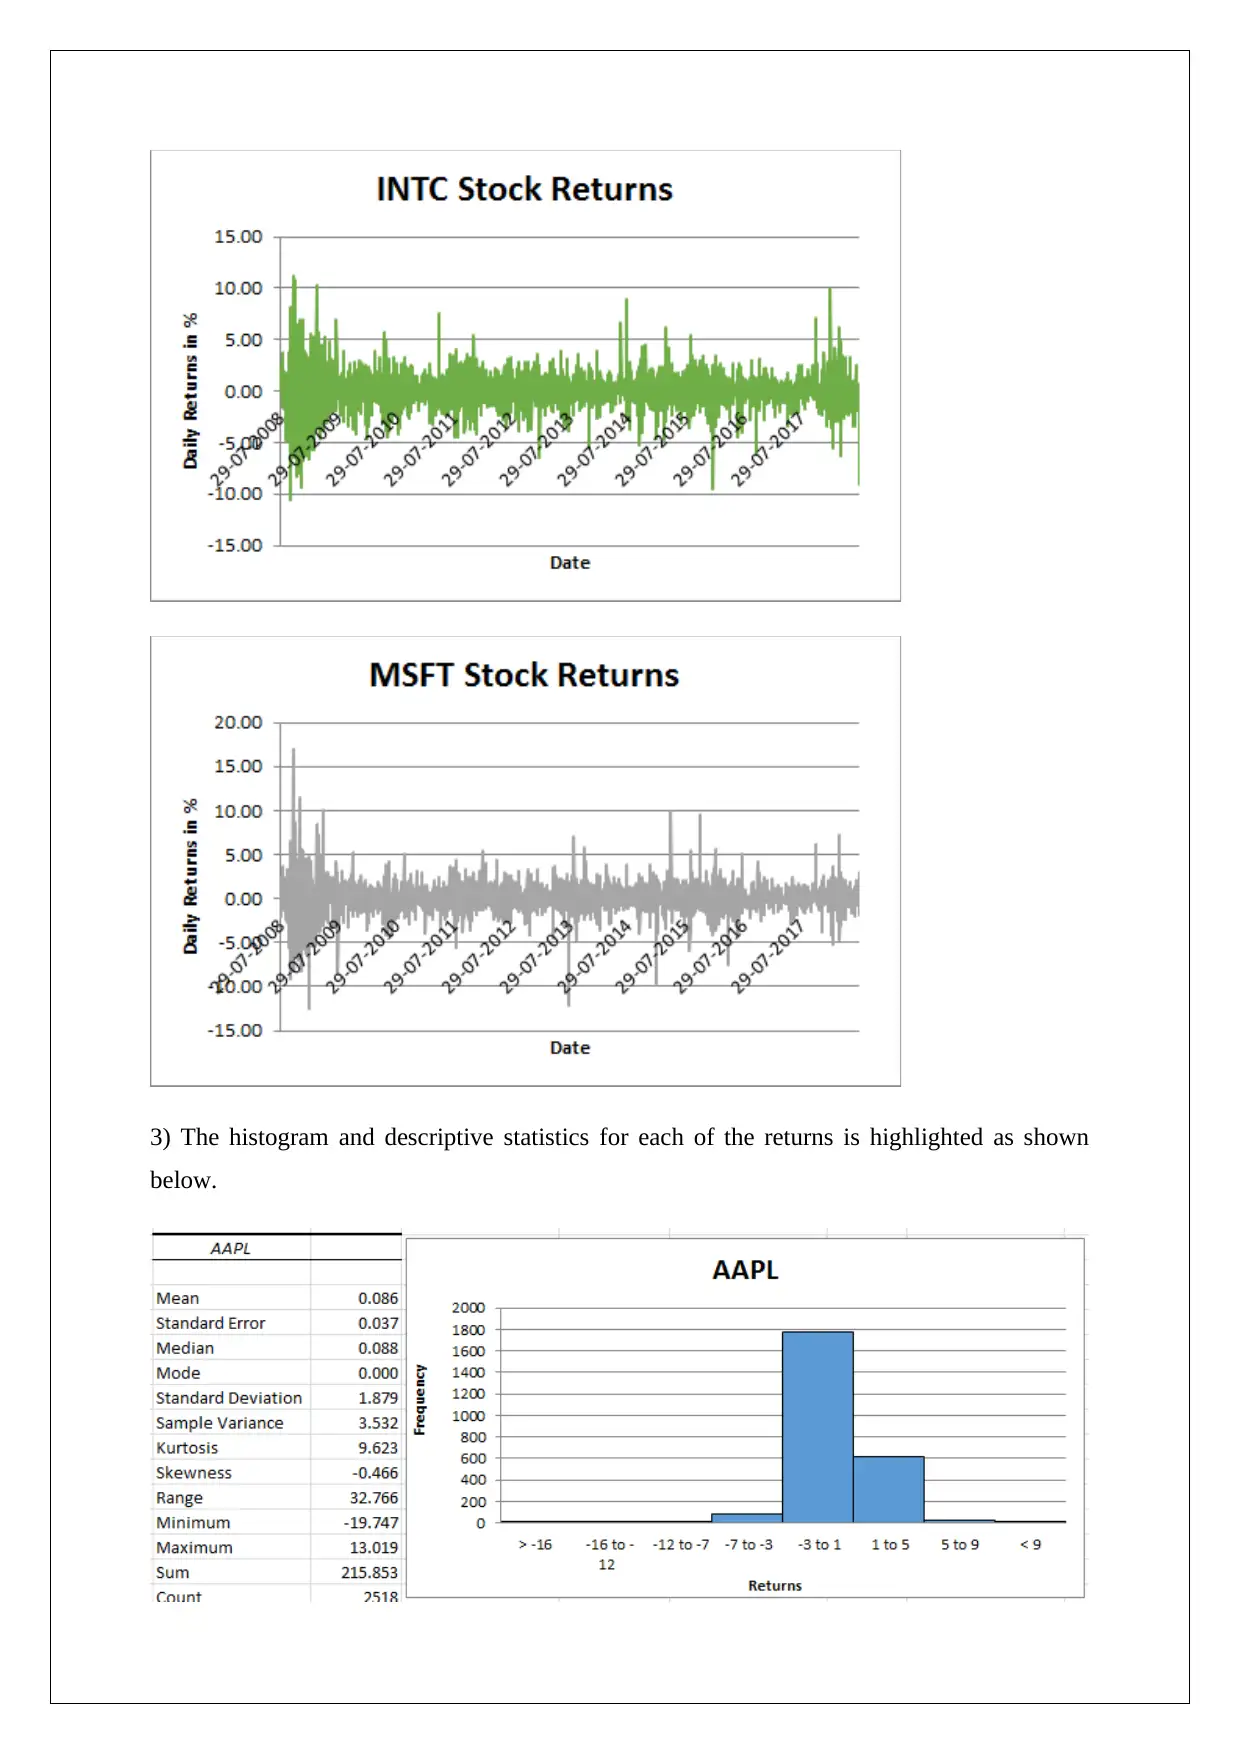
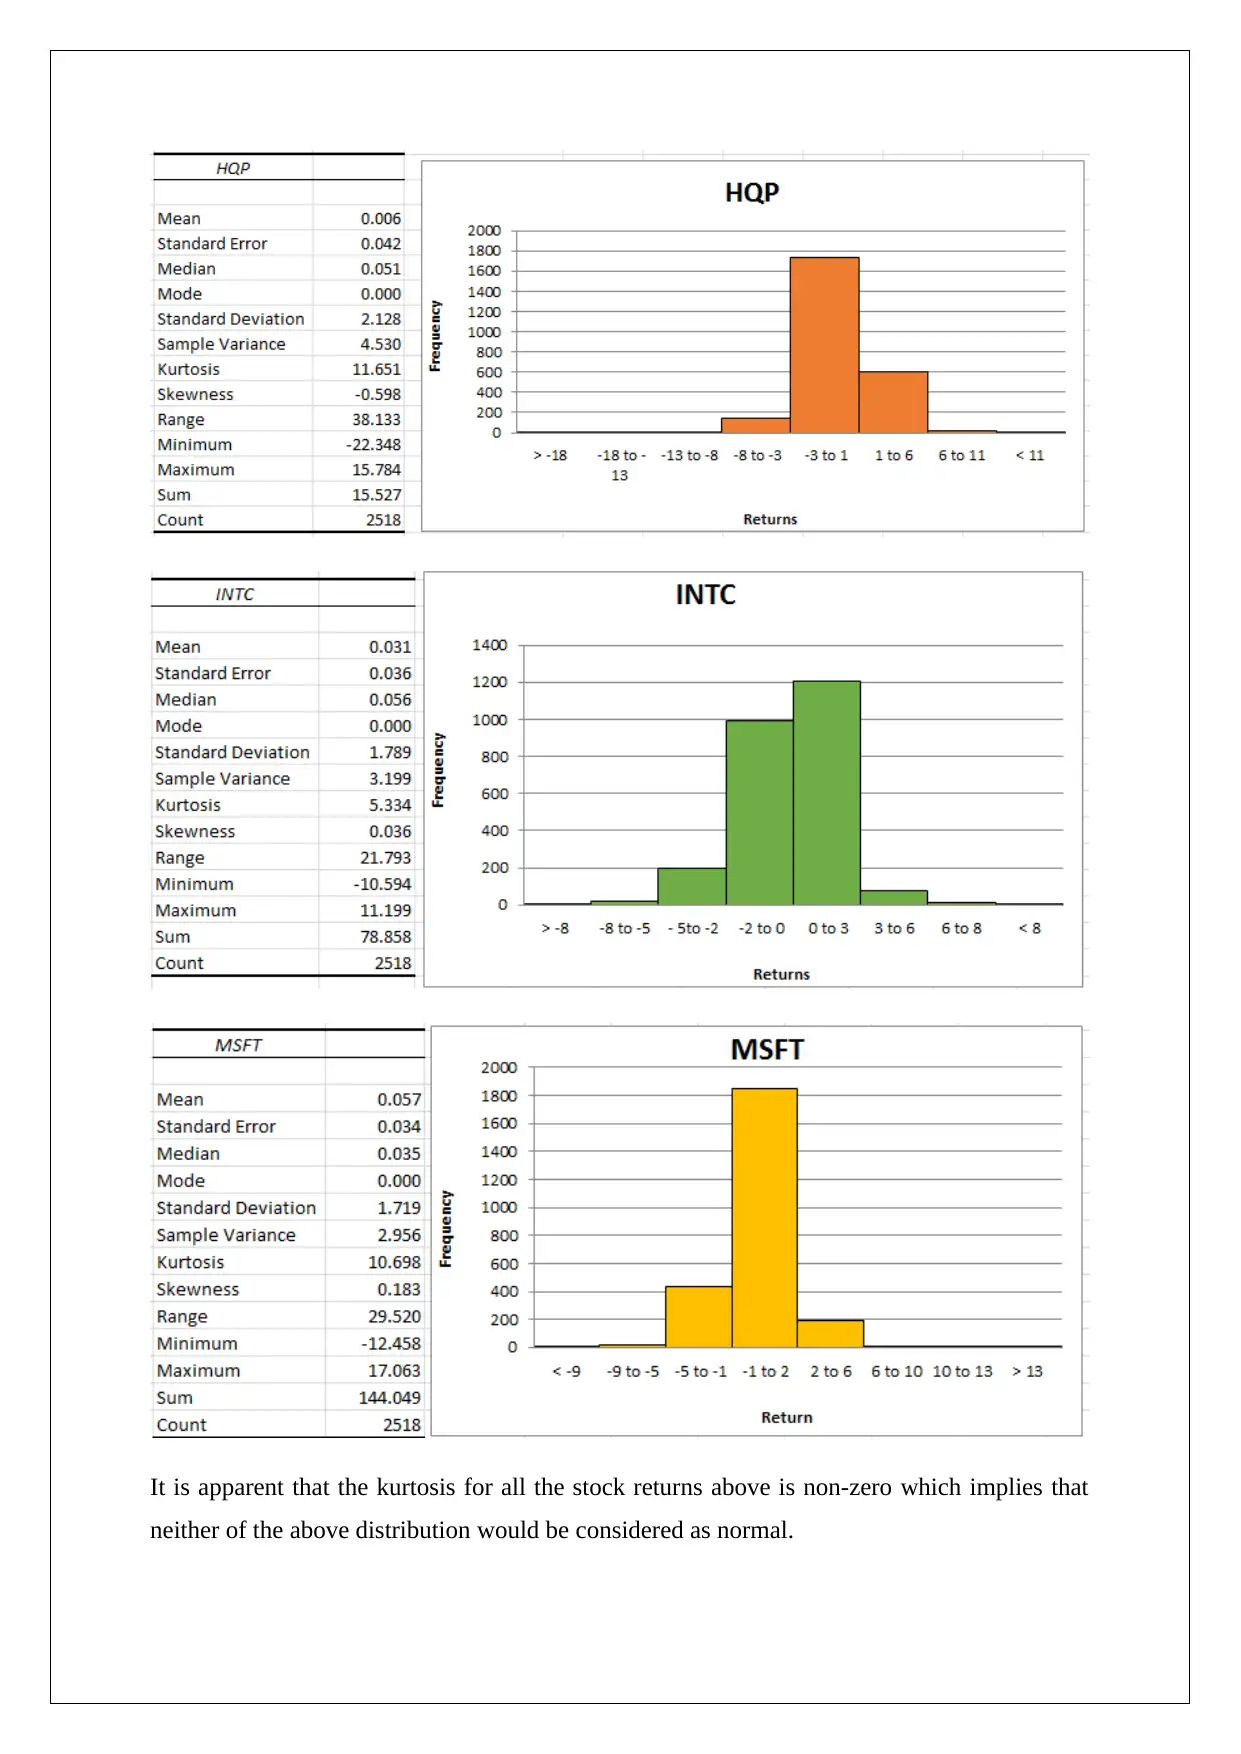
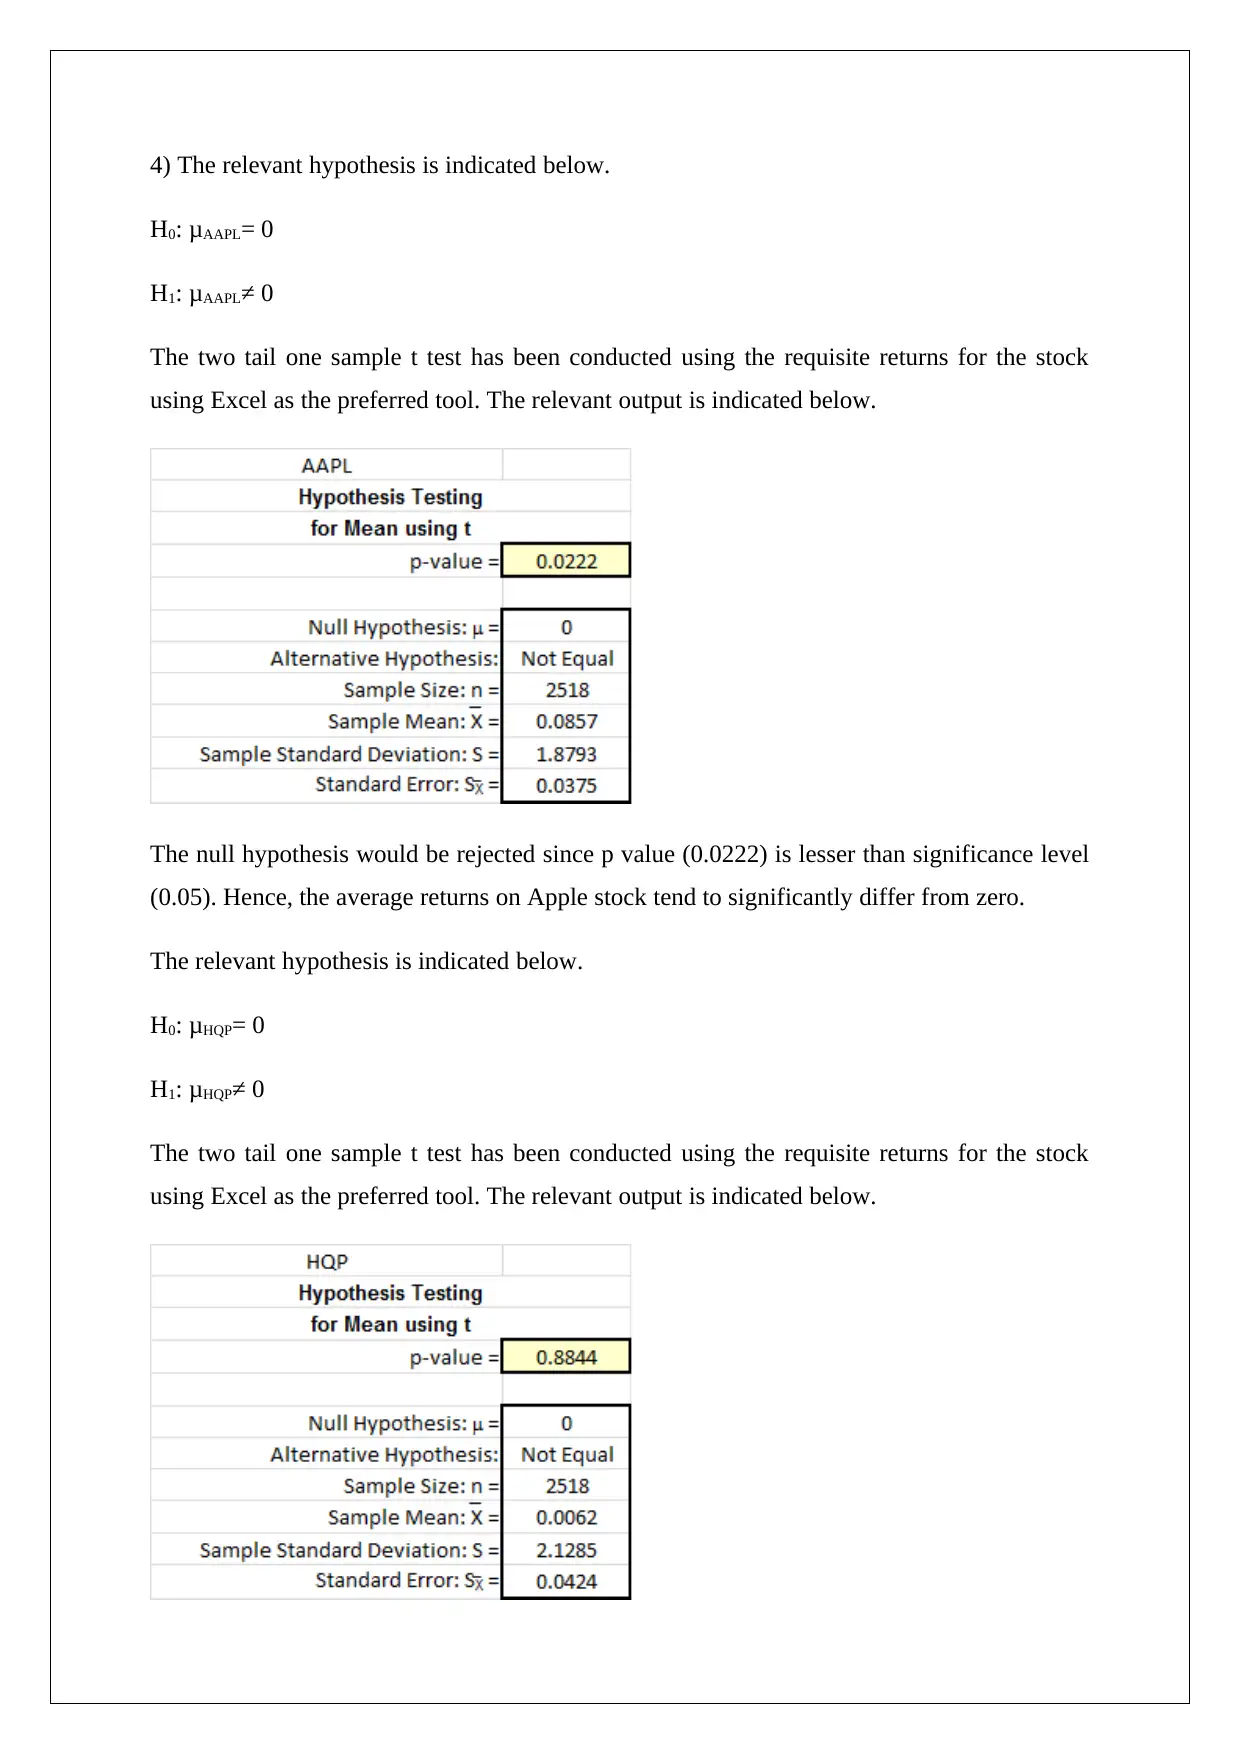
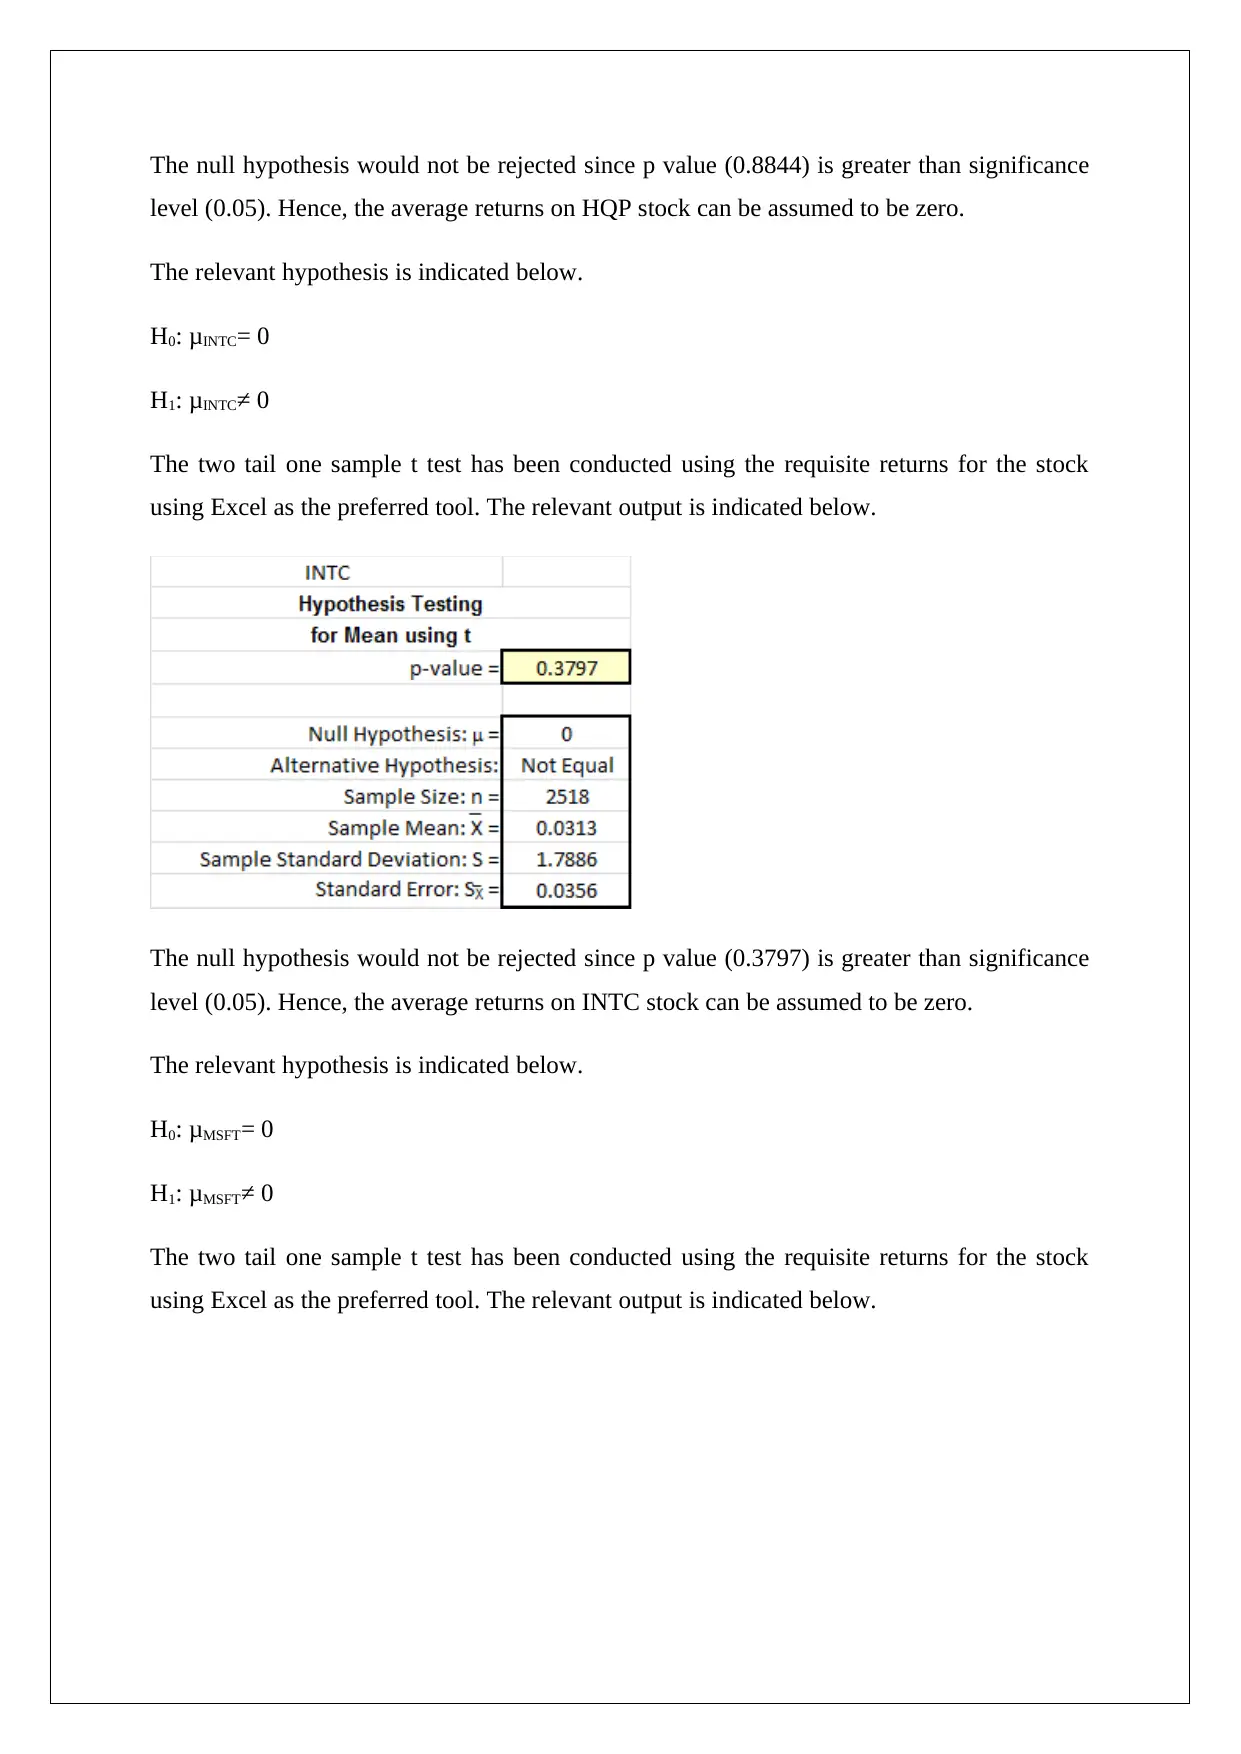
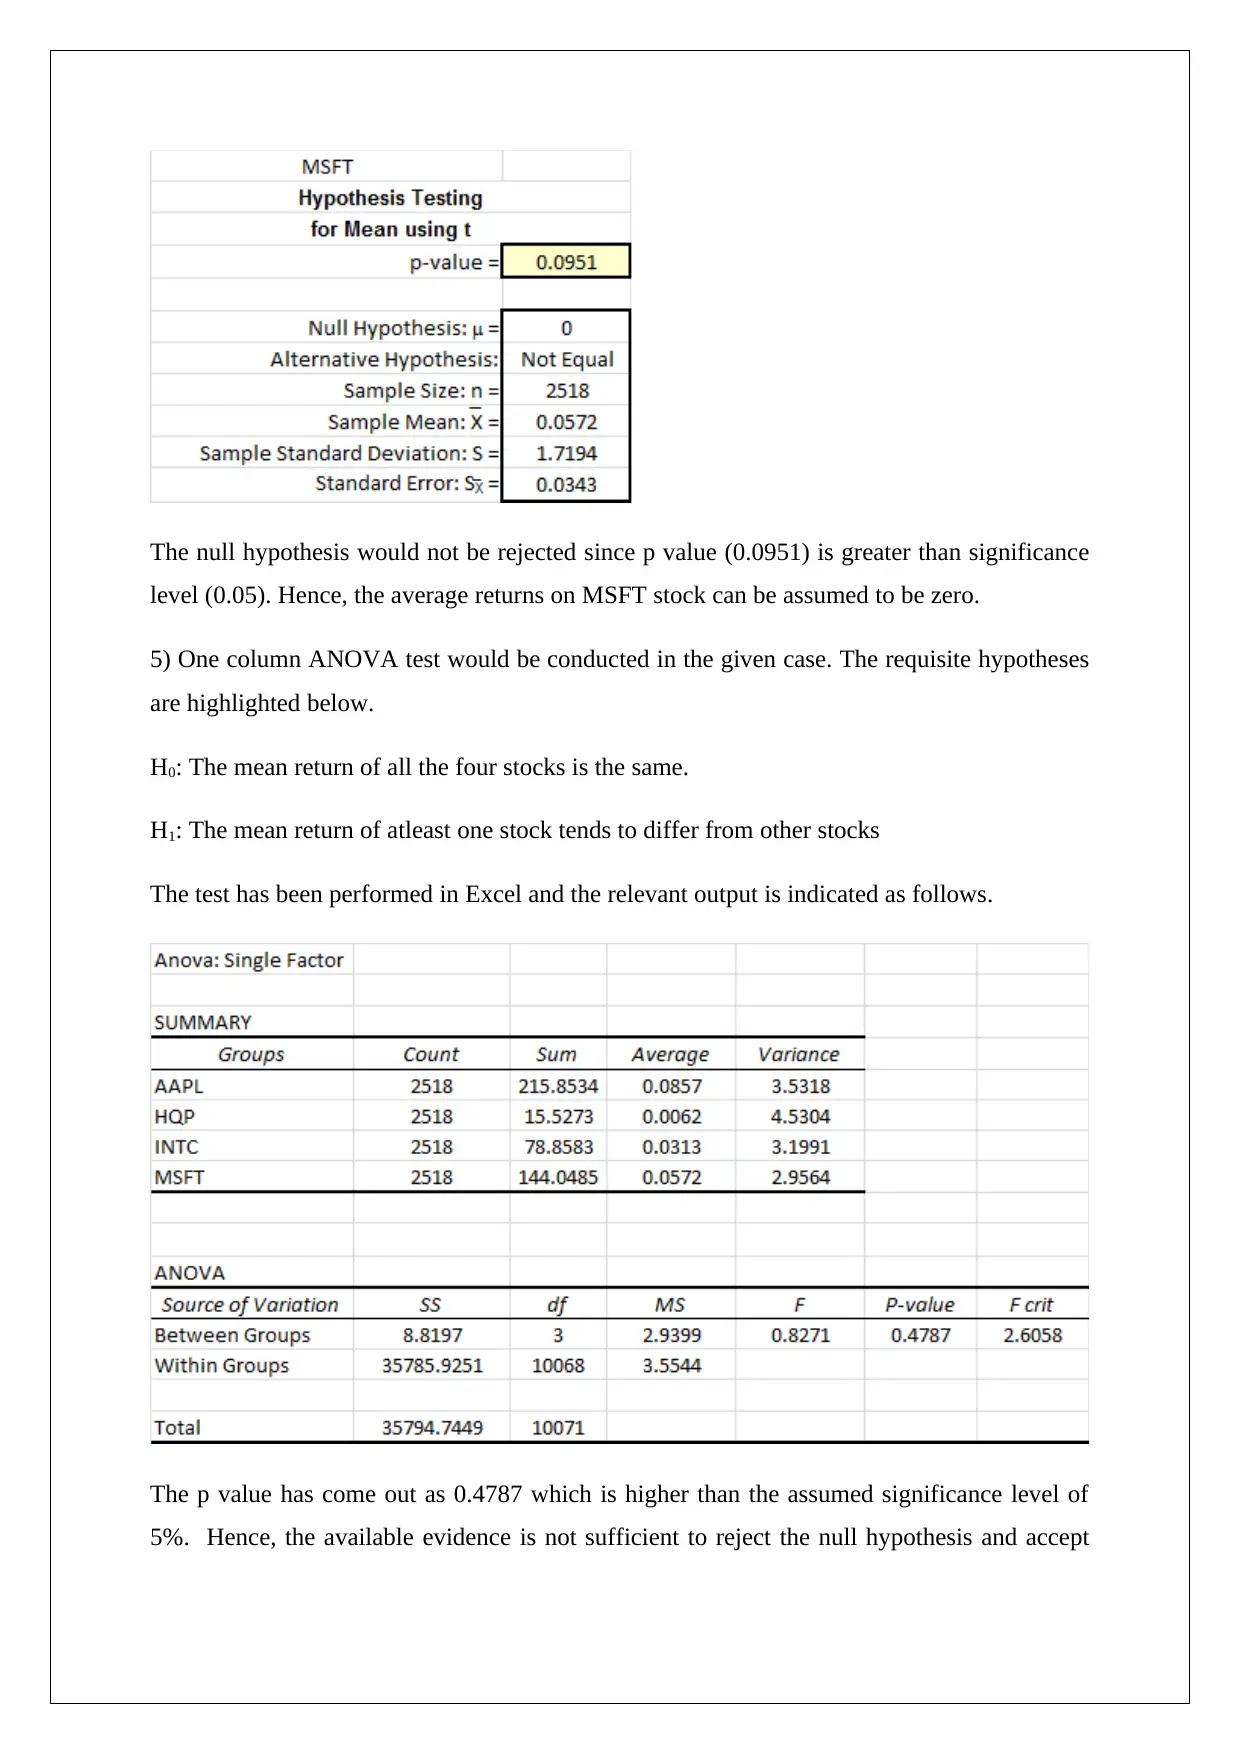
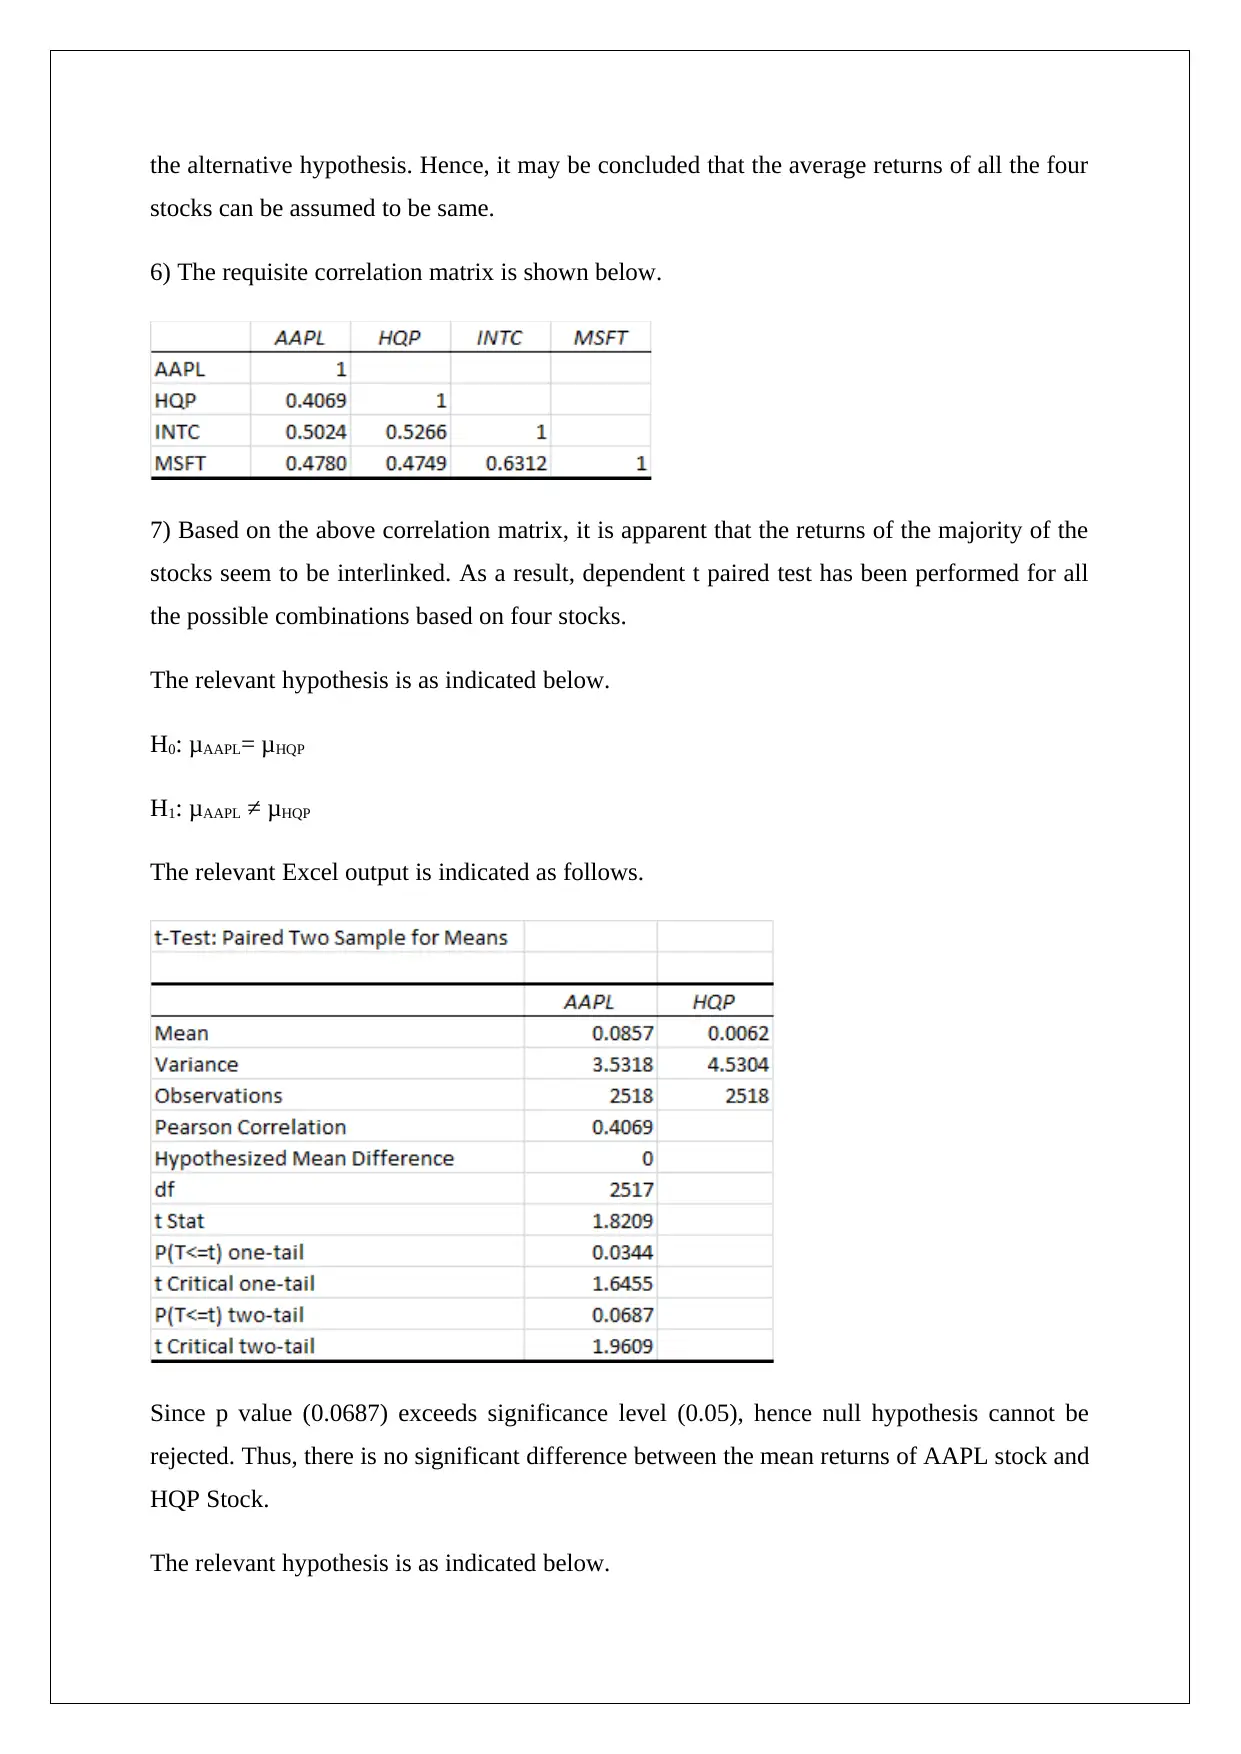
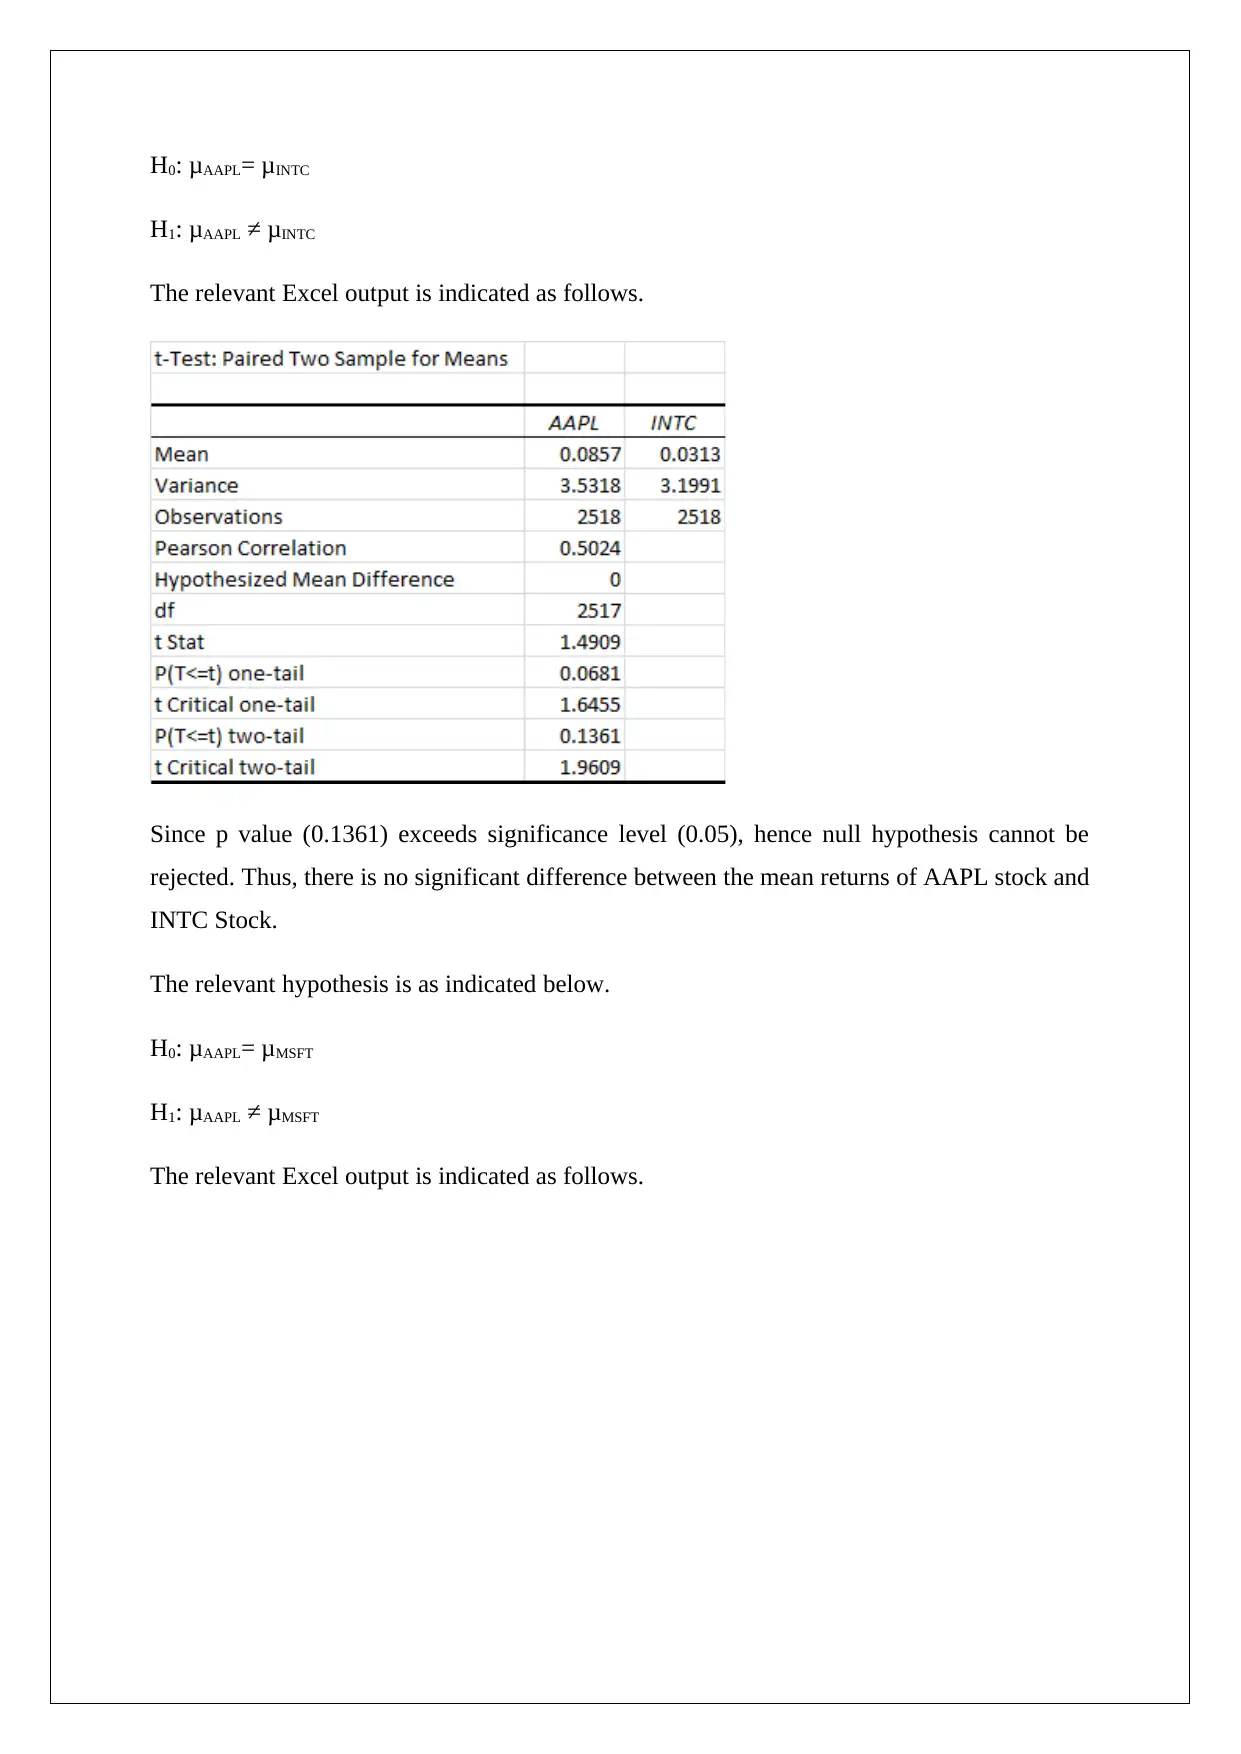
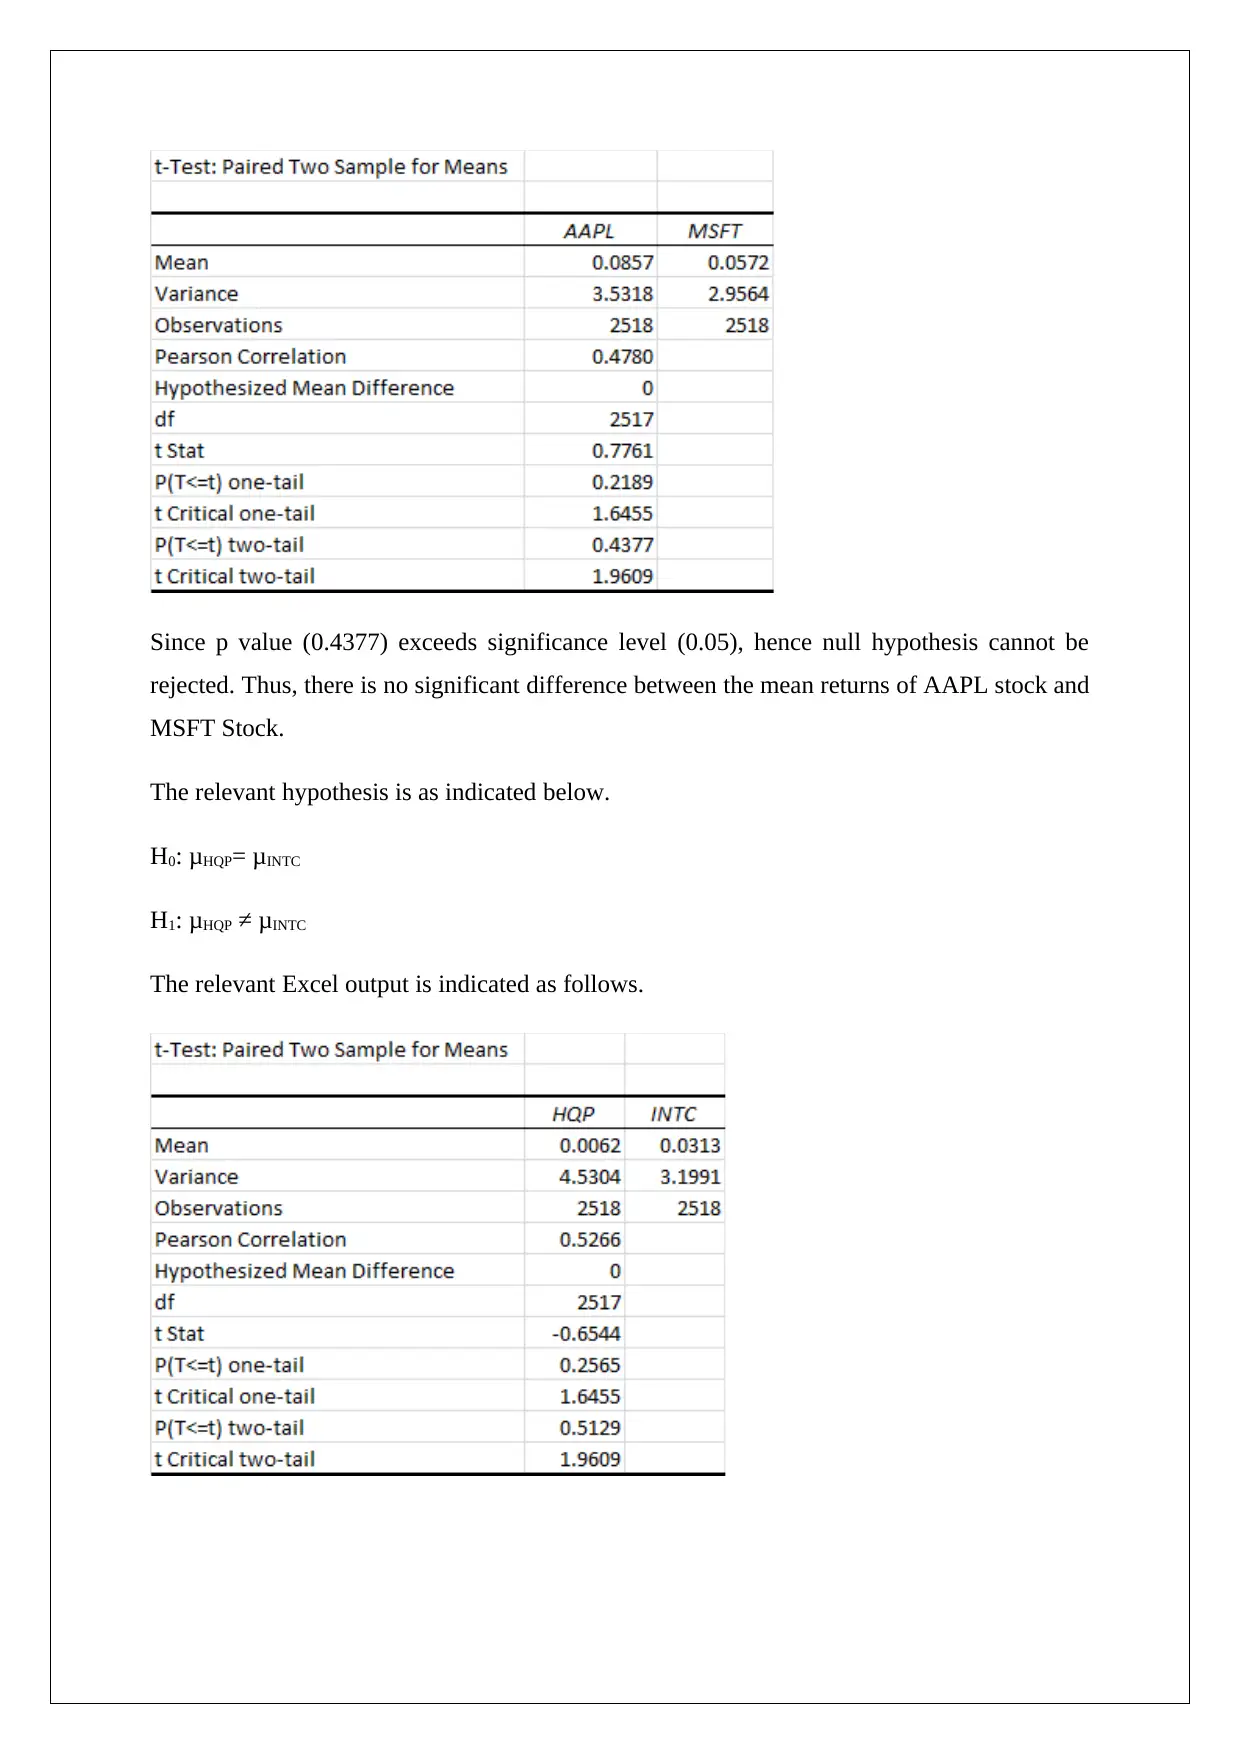
This project analyzes the financial performance of four stocks: Apple (AAPL), Hewlett Packard (HQP), Intel (INTC), and Microsoft (MSFT). The analysis begins with plotting stock prices over time and describing their historical trends, followed by the calculation and plotting of asset returns. Histograms and descriptive statistics, including mean, median, mode, variance, standard deviation, skewness, and kurtosis, are generated for each return series. Hypothesis testing is conducted using one-sample t-tests to determine if average returns differ significantly from zero. Furthermore, a one-column ANOVA test is performed to compare the mean returns of all four stocks. A correlation matrix is presented to assess the relationships between the stocks. Dependent t-paired tests are performed to compare the mean returns of various stock combinations. Finally, the project addresses portfolio optimization by calculating the return per unit risk for each stock and constructing an optimal two-asset portfolio, maximizing returns per unit of risk using the SOLVER tool in Excel. The project concludes with a discussion on the normality of the return distributions.
1 out of 15
Related Documents


Your All-in-One AI-Powered Toolkit for Academic Success.
+13062052269
info@desklib.com
Available 24*7 on WhatsApp / Email
![[object Object]](/_next/static/media/star-bottom.7253800d.svg)
Copyright © 2020–2026 A2Z Services. All Rights Reserved. Developed and managed by ZUCOL.