Ask a question from expert
Quantitative Techniques Assignment
21 Pages2795 Words126 Views
Curtin University
Added on 2020-04-21
Quantitative Techniques Assignment
Curtin University
Added on 2020-04-21
BookmarkShareRelated Documents
Running head: QUANTITATIVE TECHNIQUES FOR BUSINESS PROJECTQuantitative Techniques for Business ProjectName of the Student:Name of the University:Author’s Note:

QUANTITATIVE TECHNIQUES FOR BUSINESS PROJECT1Table of ContentsIntroduction and Background:-..................................................................................................2Answers:-...................................................................................................................................2Answer no.1...........................................................................................................................2Answer.no.2...........................................................................................................................5Answer no.3...........................................................................................................................8Histogram plots:-................................................................................................................8Descriptive Statistics:-.......................................................................................................9Answer no.4.........................................................................................................................11Hypotheses:-.....................................................................................................................12Answer no.5.........................................................................................................................12Answer no.6.........................................................................................................................15Answer no.7.........................................................................................................................15Answer no.8.........................................................................................................................17Answer no.9.........................................................................................................................18References:-..............................................................................................................................20
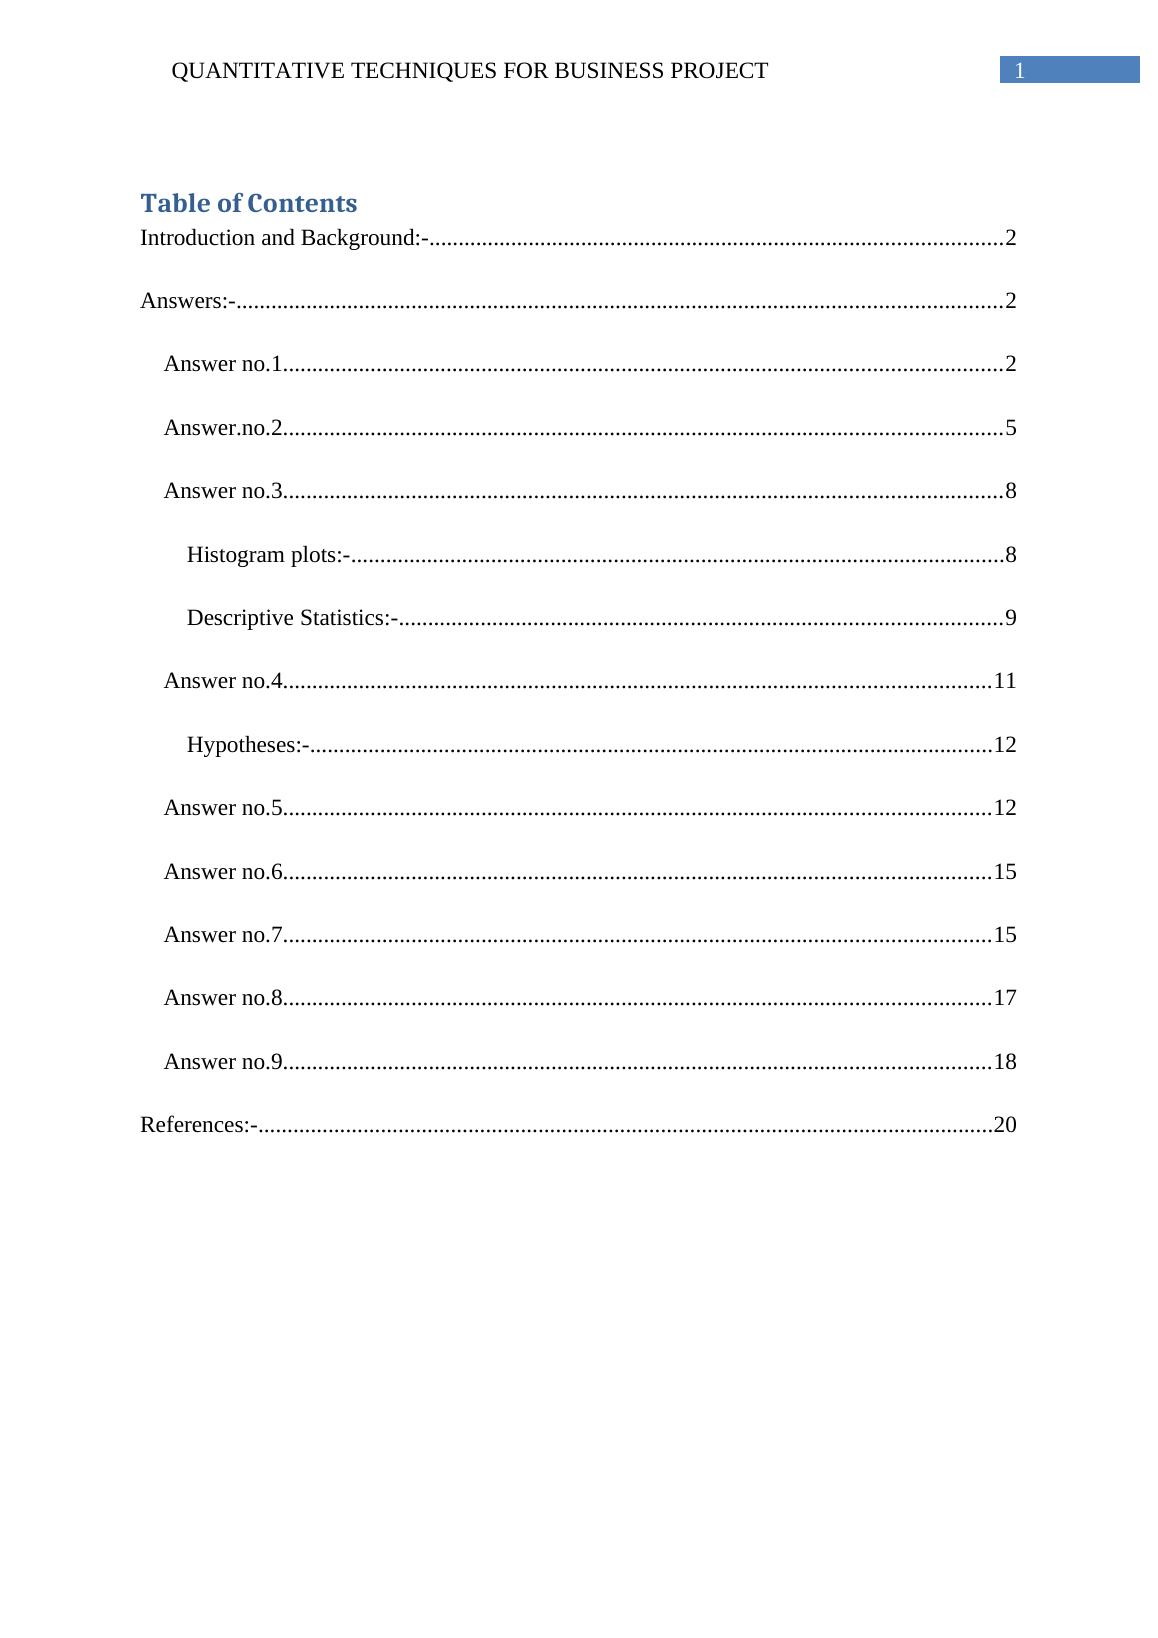
QUANTITATIVE TECHNIQUES FOR BUSINESS PROJECT2Introduction and Background:-The project evaluates different portfolio compositions of financial assets based ontime series data. It requires the collaboration of both the mathematics and statistics. We havedownloaded the data file from internet named as “stock201702-Sem2.csv”. We have used MSExcel and R to evaluate the data analysis and conclusion drawing. The time series data stores four different rates of assets such as AAPL, HPQ, INTCand MSFT for long 15 years day by day. The data is actually a big time series data. Answers:-Answer no.1.8/9/20022/12/20038/15/20032/19/20048/23/20042/24/20058/26/20053/2/20069/1/20063/9/20079/11/20073/14/20089/16/20083/20/20099/22/20093/26/20109/28/20103/31/201110/3/20114/5/201210/8/20124/16/201310/16/20134/22/201410/22/20144/28/201510/28/20155/3/201611/2/2016020406080100120140160AAPLAAPLFigure1: The scatter plot of Stock price of AAPL date wise.
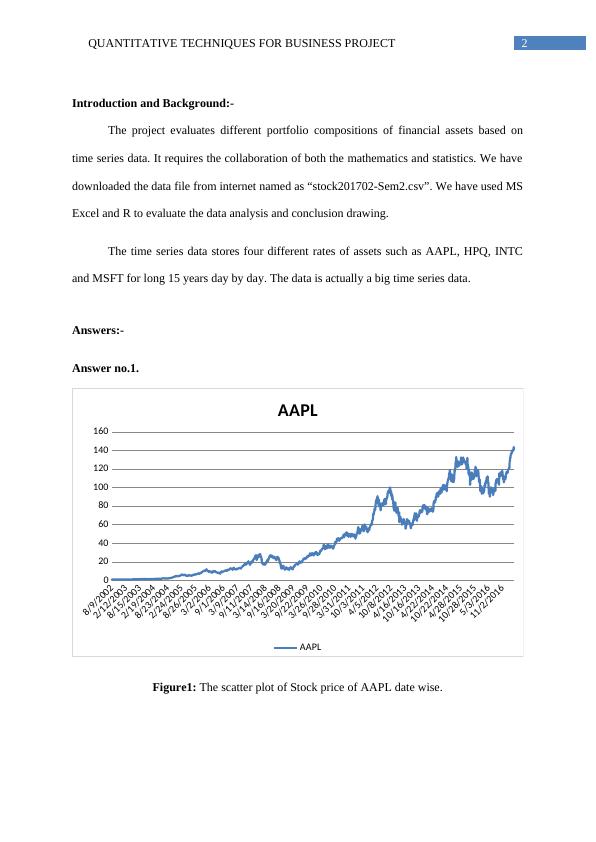
QUANTITATIVE TECHNIQUES FOR BUSINESS PROJECT38/9/20022/12/20038/15/20032/19/20048/23/20042/24/20058/26/20053/2/20069/1/20063/9/20079/11/20073/14/20089/16/20083/20/20099/22/20093/26/20109/28/20103/31/201110/3/20114/5/201210/8/20124/16/201310/16/20134/22/201410/22/20144/28/201510/28/20155/3/201611/2/20160102030405060HPQHPQFigure2: The scatter plot of Stock price of HPQ date wise.8/9/20022/12/20038/15/20032/19/20048/23/20042/24/20058/26/20053/2/20069/1/20063/9/20079/11/20073/14/20089/16/20083/20/20099/22/20093/26/20109/28/20103/31/201110/3/20114/5/201210/8/20124/16/201310/16/20134/22/201410/22/20144/28/201510/28/20155/3/201611/2/2016051015202530354045INTCINTCFigure3: The scatter plot of Stock price of INTC date wise.
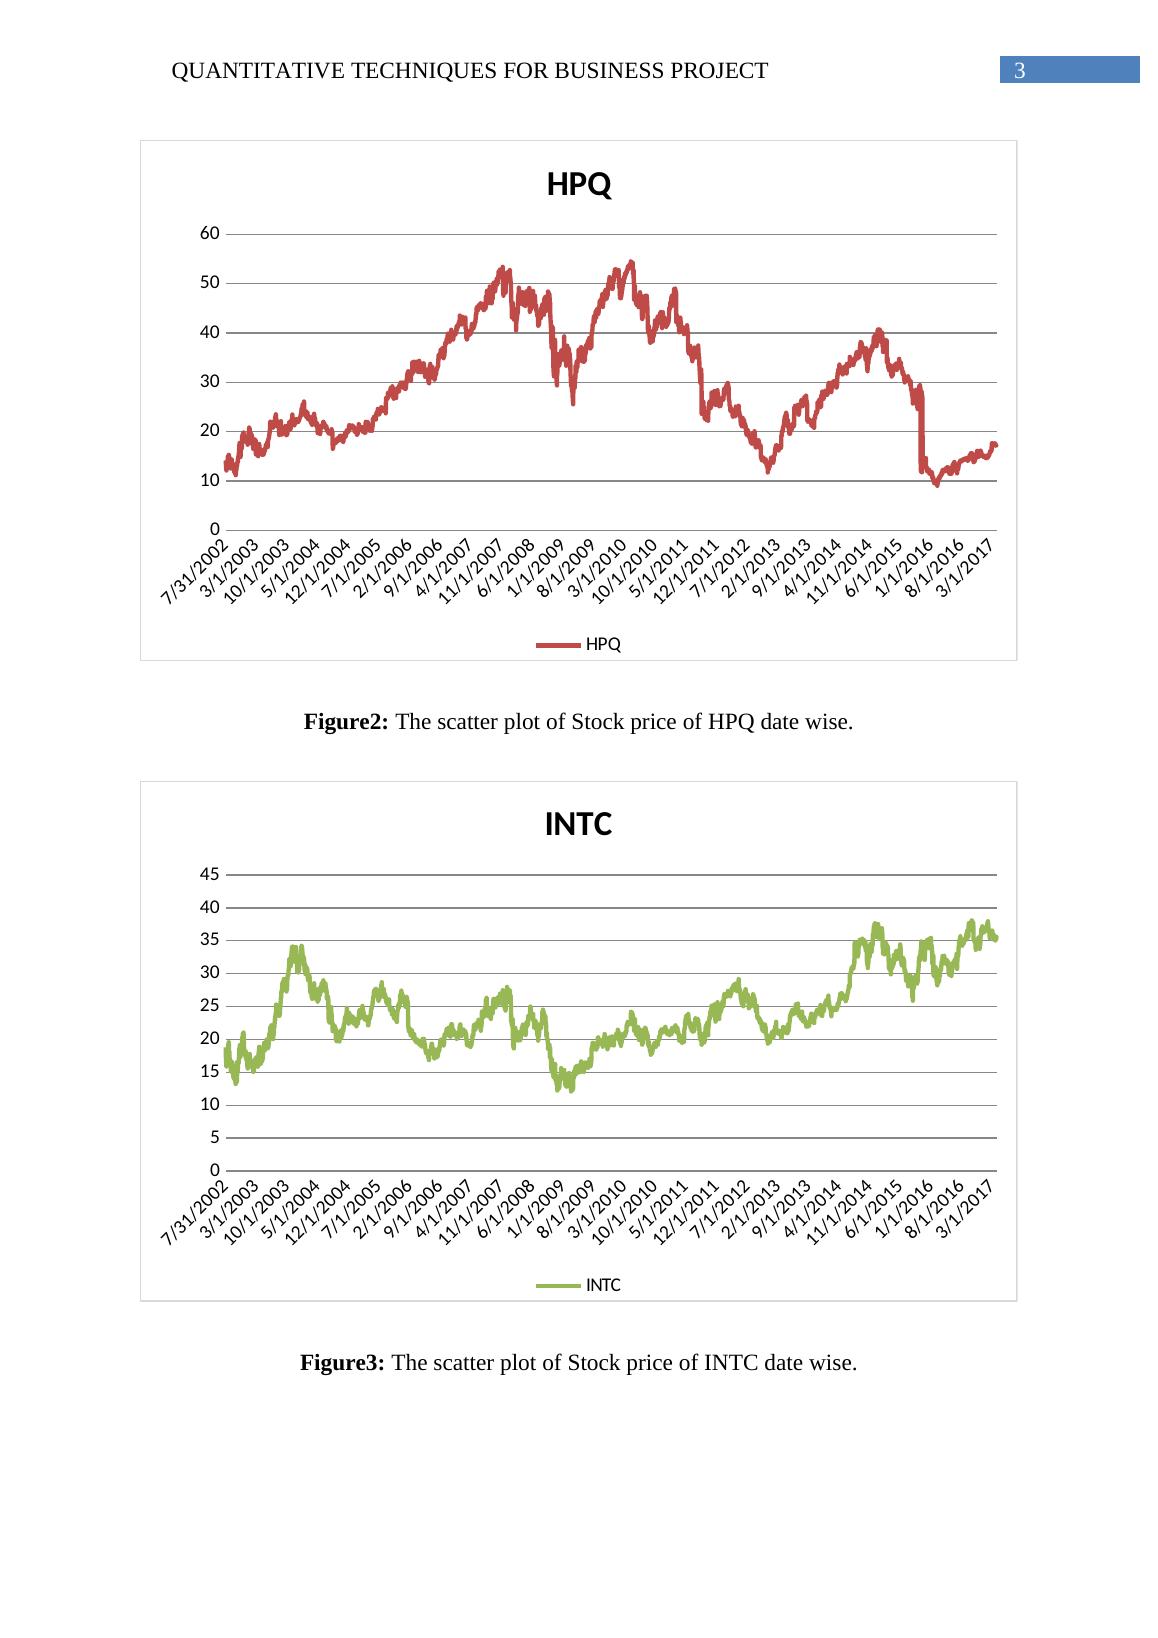
QUANTITATIVE TECHNIQUES FOR BUSINESS PROJECT48/9/20022/12/20038/15/20032/19/20048/23/20042/24/20058/26/20053/2/20069/1/20063/9/20079/11/20073/14/20089/16/20083/20/20099/22/20093/26/20109/28/20103/31/201110/3/20114/5/201210/8/20124/16/201310/16/20134/22/201410/22/20144/28/201510/28/20155/3/201611/2/2016010203040506070MSFTMSFTFigure4: The scatter plot of Stock price of MSFT date wise.The Stock Price movement of four stock rates indicate that-1. AAPL rate has increased from 7/31/2002 to 7/31/2016 exponentially. The rate is very highafter 7/31/2011 to 7/31/2016. We can observe the “trend” and “seasonality” in the graphicalmovement of AAPL.2. HPQ rate has increased very slowly from 7/31/2002 to 7/31/2007. Then we can observesome ups and downs in the data. Finally from 7/31/2011 to 7/31/2016, the rate also decreasedslowly. We also observe seasonality and trend in HPQ rate (Hirsch et al. 1980).3. INTC rate has showed a linear stability and “stationarity” in terms of time series. Itsvariability is too less. The rate is more or less stable from 7/31/2002 to 7/31/2016(Kontostathis 2004).4. MSFT rate is increasing very slowly exponentially. From 7/31/2002 to 7/31/2012, the ratedid not show a hike, but after 7/31/2012 to 7/31/2017 the data increased gradually.
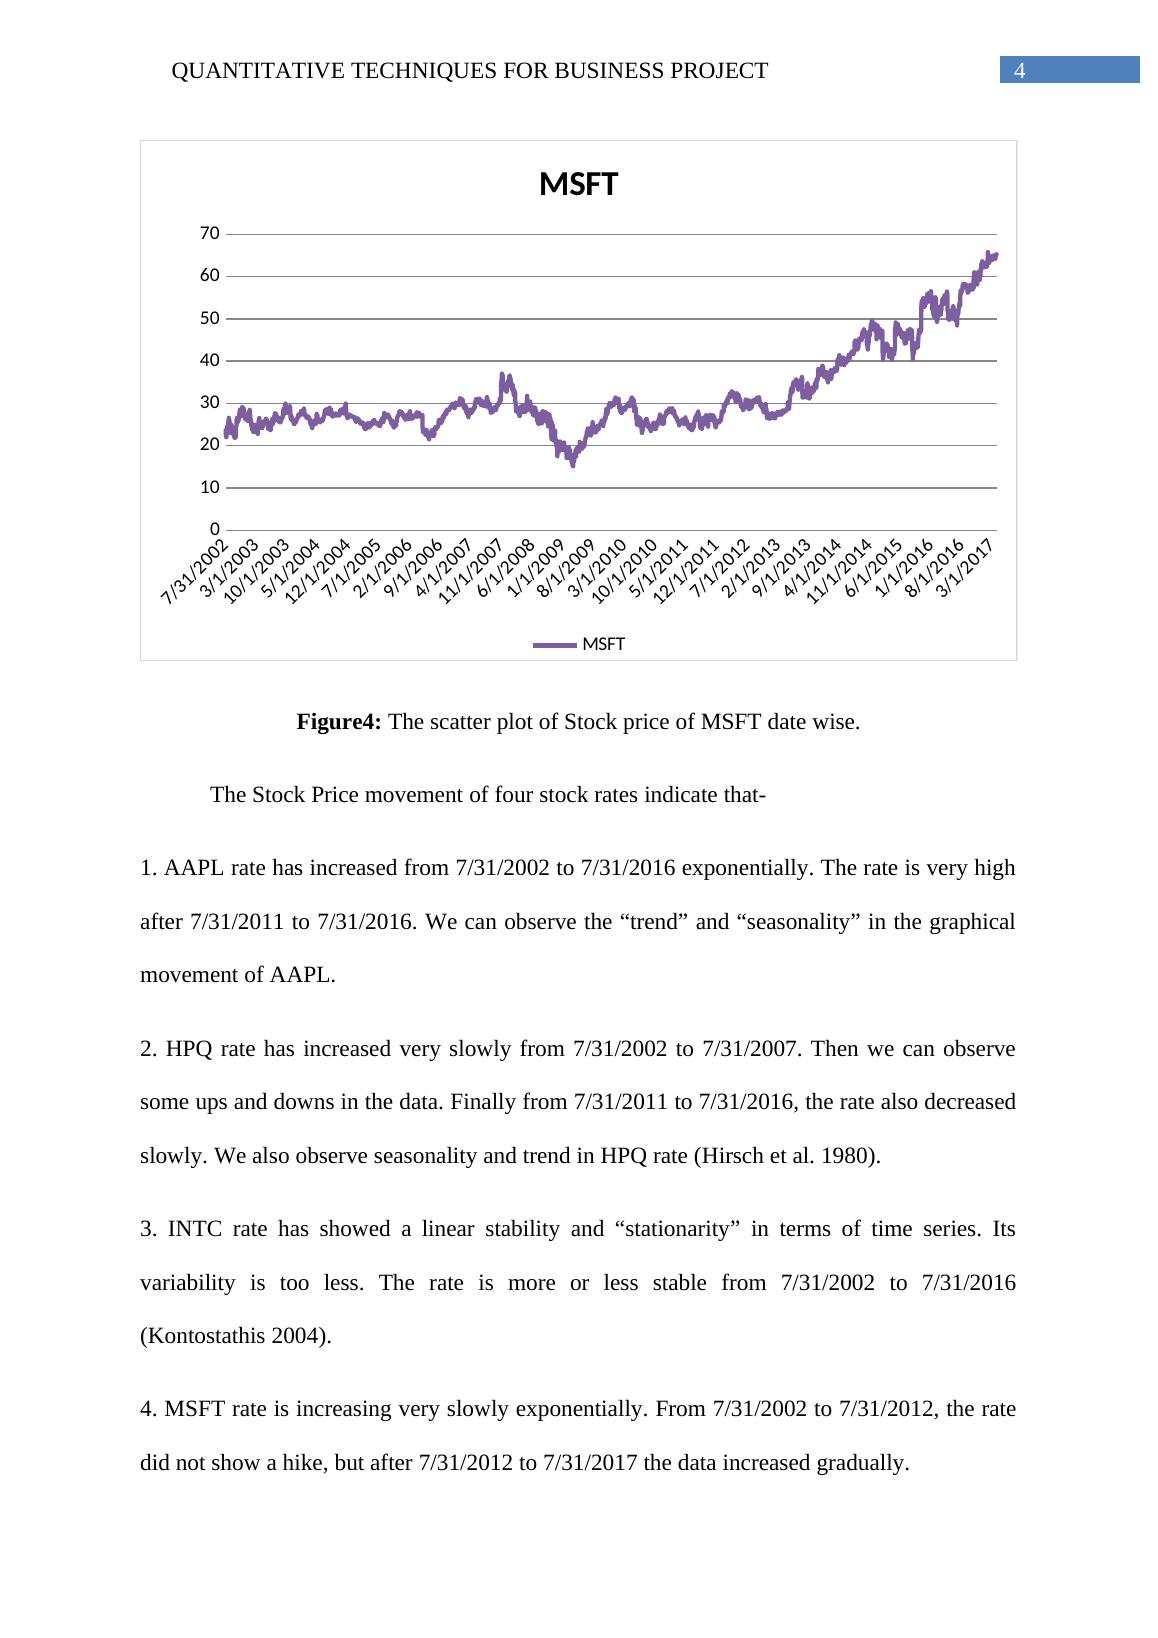
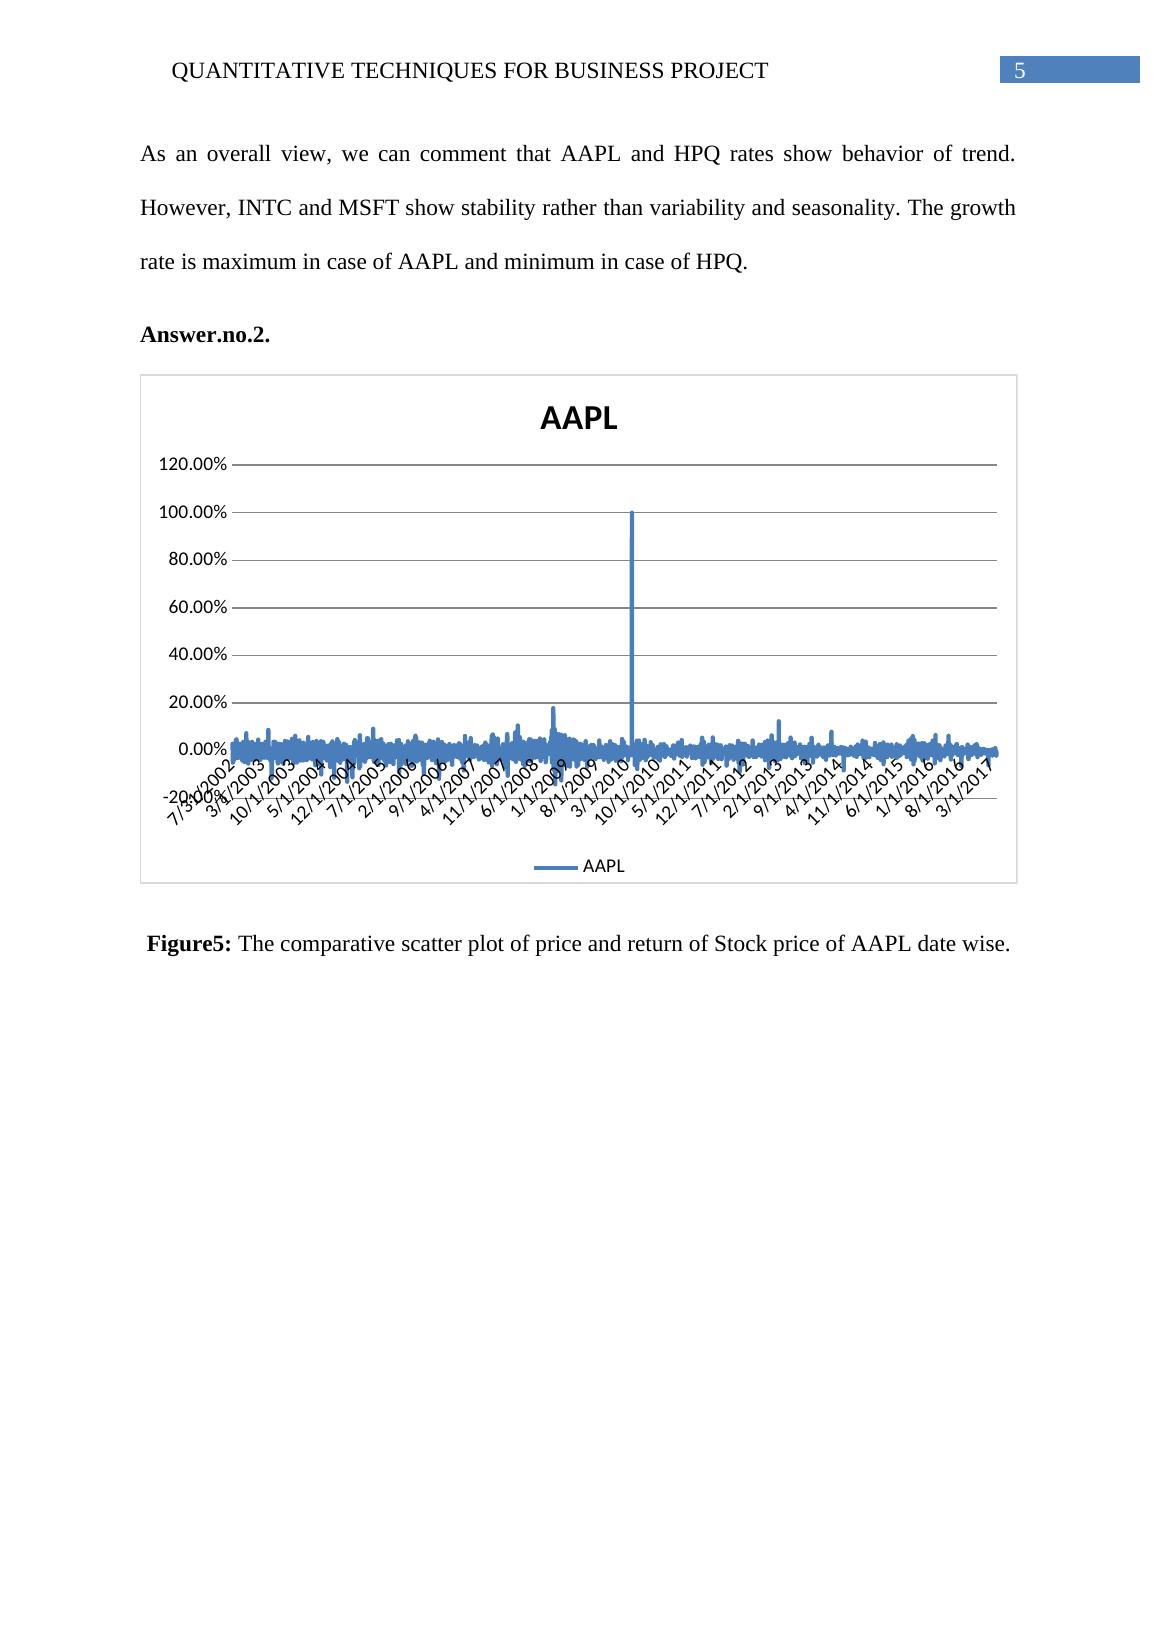
QUANTITATIVE TECHNIQUES FOR BUSINESS PROJECT5As an overall view, we can comment that AAPL and HPQ rates show behavior of trend.However, INTC and MSFT show stability rather than variability and seasonality. The growthrate is maximum in case of AAPL and minimum in case of HPQ.Answer.no.2.8/9/20022/25/20039/9/20033/24/200410/7/20044/22/200511/3/20055/22/200612/4/20066/21/20071/4/20087/21/20082/3/20098/18/20093/4/20109/16/20103/31/201110/13/20114/30/201211/13/20125/31/201312/12/20136/30/20141/13/20157/29/20152/11/20168/25/20163/13/2017-20.00%0.00%20.00%40.00%60.00%80.00%100.00%120.00%AAPLAAPLFigure5: The comparative scatter plot of price and return of Stock price of AAPL date wise.
End of preview
Want to access all the pages? Upload your documents or become a member.
Related Documents
Report On Analysis Of Stockslg...
|13
|1932
|52