Ask a question from expert
Quantitative Techniques in Business Assignment
9 Pages3119 Words242 Views
Added on 2020-04-13
Quantitative Techniques in Business Assignment
Added on 2020-04-13
BookmarkShareRelated Documents
QUANTITATIVETECHNIQUES INBUSINESSSTUDENT ID:[Pick the date]
IntroductionResearch plays a key role in aiding decision making in both business and industry. Forconducting this research, statistical tools are often used so that meaningful conclusions can bederived about the target population and various other relationships. A critical aspect of theseresearches is the underlying sample which is used to derive useful conclusions about thepopulation. As a result, the sample assumes a critical role and so does the various samplingtechniques which are involved to obtain the sample from the population of interest.Additionally, the role of sample size cannot be undermined (Flick, 2015). In the wake of theabove background, the objective of the given report is to introduce the various samplingtechniques with emphasis on broad classification of probability and non-probability samplingtechniques. Further, the report also reflects on the critical evaluation of certain techniquesthat belong to the two broad categories based on which recommendation has been given. Elements of PopulationWith regards to statistical analysis, there are two main elements namely the population andthe sample. A population may be defined as the set which tends to contain all the subjects ofinterest based on the underlying purpose. For instance, for any research on people with IQscore in excess of 150, the population set would include all people who would have an IQscore in excess of 150. The various characteristics of the population are referred to asparameters. For instance, the mean and the standard deviation of the population would bereferred to as parameter (Hair et. al., 2015). On the contrary, the characteristics of the sampleare referred to as statistic. For instance, the mean and standard deviation of the sample wouldbe referred to as statistic. The significance of sample stems from the fact that doing researchusing the population can be cumbersome in terms of the time along with financial andmanpower resources. Thus, it makes sense to rely on selected sample rather than relying onthe population to derive conclusions about the underlying research question (Hillier, 2006).Importance of Sample SizeA crucial element with regards to use of sampling for deriving conclusions and drawinganswers to specified research questions is the sample size which must be chosen. The samplesize refers to the number of elements that must be introduced in the selected sample to drawconclusion about the population. It is noteworthy that a good sample is one which leads touseful and reliable conclusions. In order to measure this, a term known as power of a
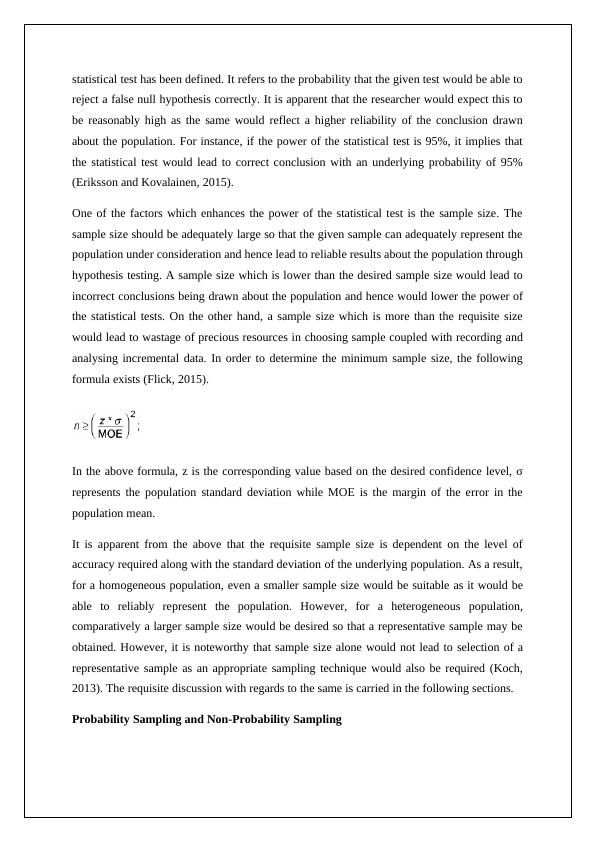
statistical test has been defined. It refers to the probability that the given test would be able toreject a false null hypothesis correctly. It is apparent that the researcher would expect this tobe reasonably high as the same would reflect a higher reliability of the conclusion drawnabout the population. For instance, if the power of the statistical test is 95%, it implies thatthe statistical test would lead to correct conclusion with an underlying probability of 95%(Eriksson and Kovalainen, 2015).One of the factors which enhances the power of the statistical test is the sample size. Thesample size should be adequately large so that the given sample can adequately represent thepopulation under consideration and hence lead to reliable results about the population throughhypothesis testing. A sample size which is lower than the desired sample size would lead toincorrect conclusions being drawn about the population and hence would lower the power ofthe statistical tests. On the other hand, a sample size which is more than the requisite sizewould lead to wastage of precious resources in choosing sample coupled with recording andanalysing incremental data. In order to determine the minimum sample size, the followingformula exists (Flick, 2015).In the above formula, z is the corresponding value based on the desired confidence level, σrepresents the population standard deviation while MOE is the margin of the error in thepopulation mean. It is apparent from the above that the requisite sample size is dependent on the level ofaccuracy required along with the standard deviation of the underlying population. As a result,for a homogeneous population, even a smaller sample size would be suitable as it would beable to reliably represent the population. However, for a heterogeneous population,comparatively a larger sample size would be desired so that a representative sample may beobtained. However, it is noteworthy that sample size alone would not lead to selection of arepresentative sample as an appropriate sampling technique would also be required (Koch,2013). The requisite discussion with regards to the same is carried in the following sections.Probability Sampling and Non-Probability Sampling
End of preview
Want to access all the pages? Upload your documents or become a member.
Related Documents
Statistics - Hypothesis Testing, Percentile, Central Limit Theorem, Correlation Coefficient, Chi Square Testlg...
|13
|1282
|227
Business Data Analysislg...
|7
|677
|229
Statistics | Questions and Answerslg...
|9
|1072
|37
Statistics - Two Sample t-test with Known and Unequal Varianceslg...
|6
|687
|236
Statistical Concepts and Their Real-Life Applicationslg...
|4
|711
|469
Understanding Null Hypothesis, Alternative Hypothesis, Type I and Type II Errors in Statisticslg...
|12
|1692
|79