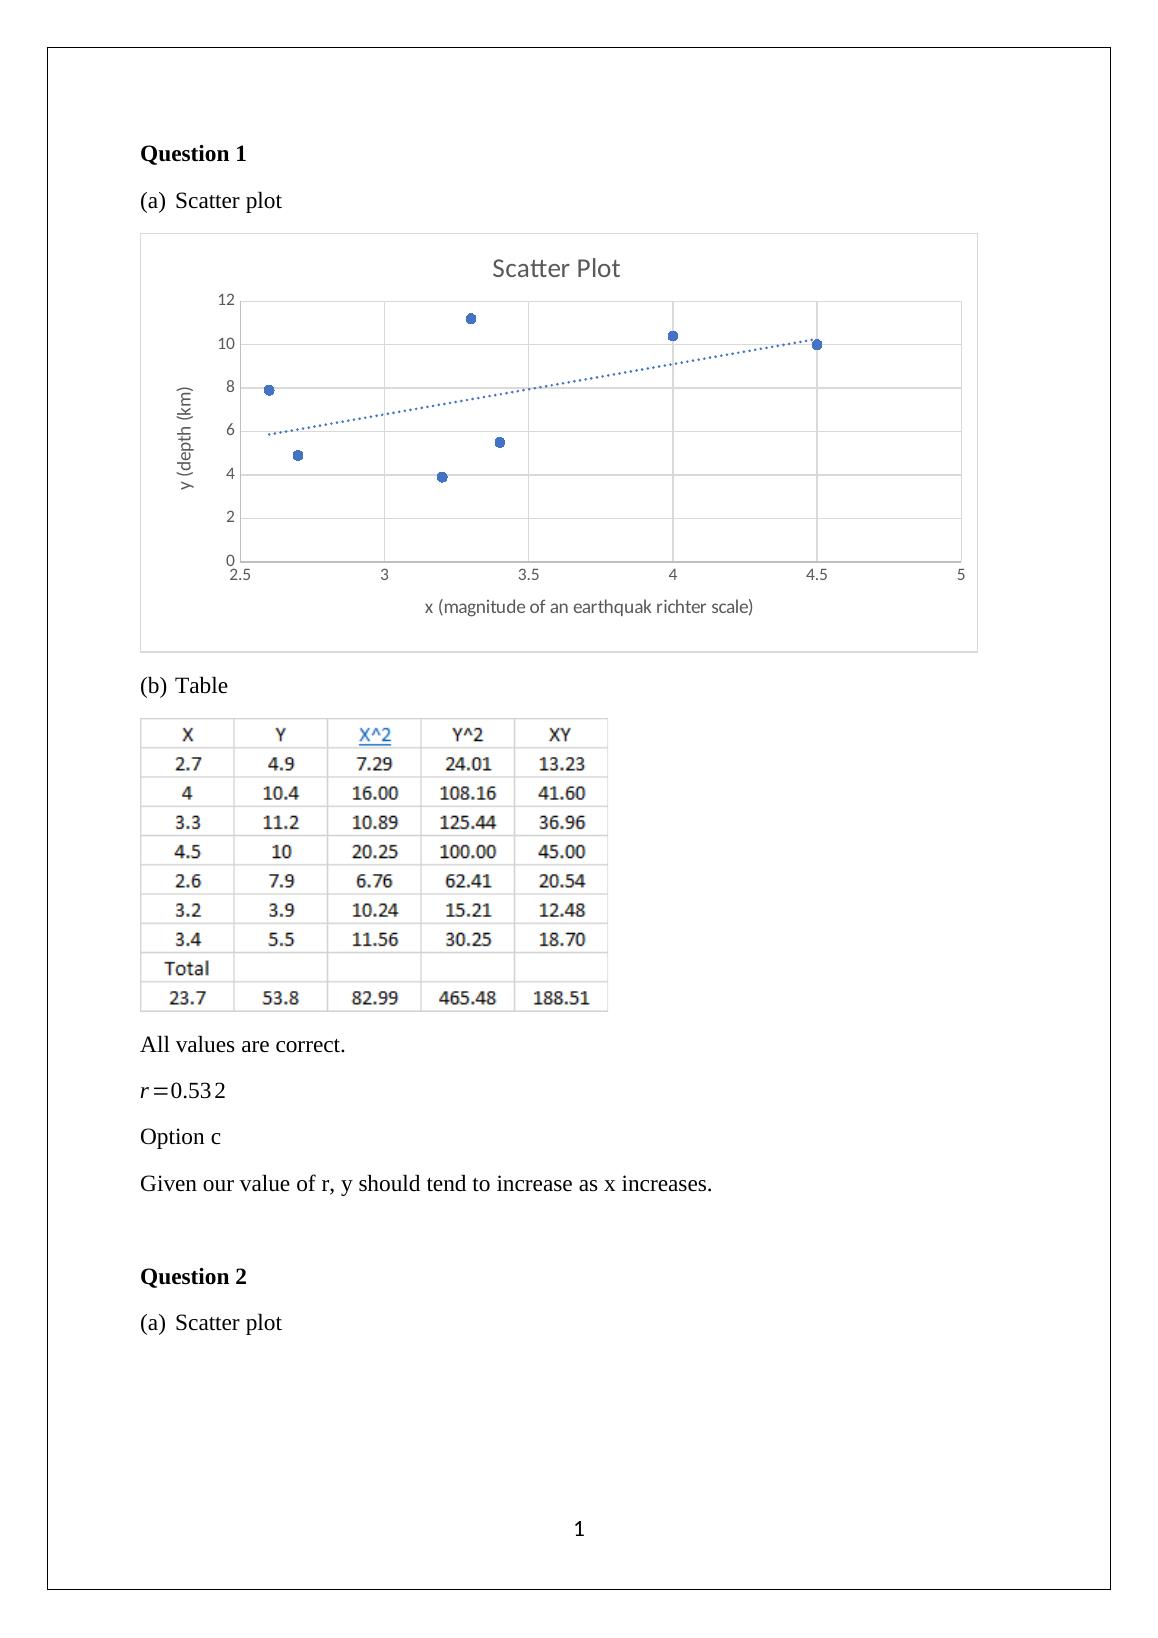
Scatter Plot and Table
Review of WebAssign problems from sections 9.1 - 9.2 and 10.1-10.4, with current score and a question about earthquake magnitude and depth relationship.
11 Pages1149 Words50 Views
Added on 2023-01-11
About This Document
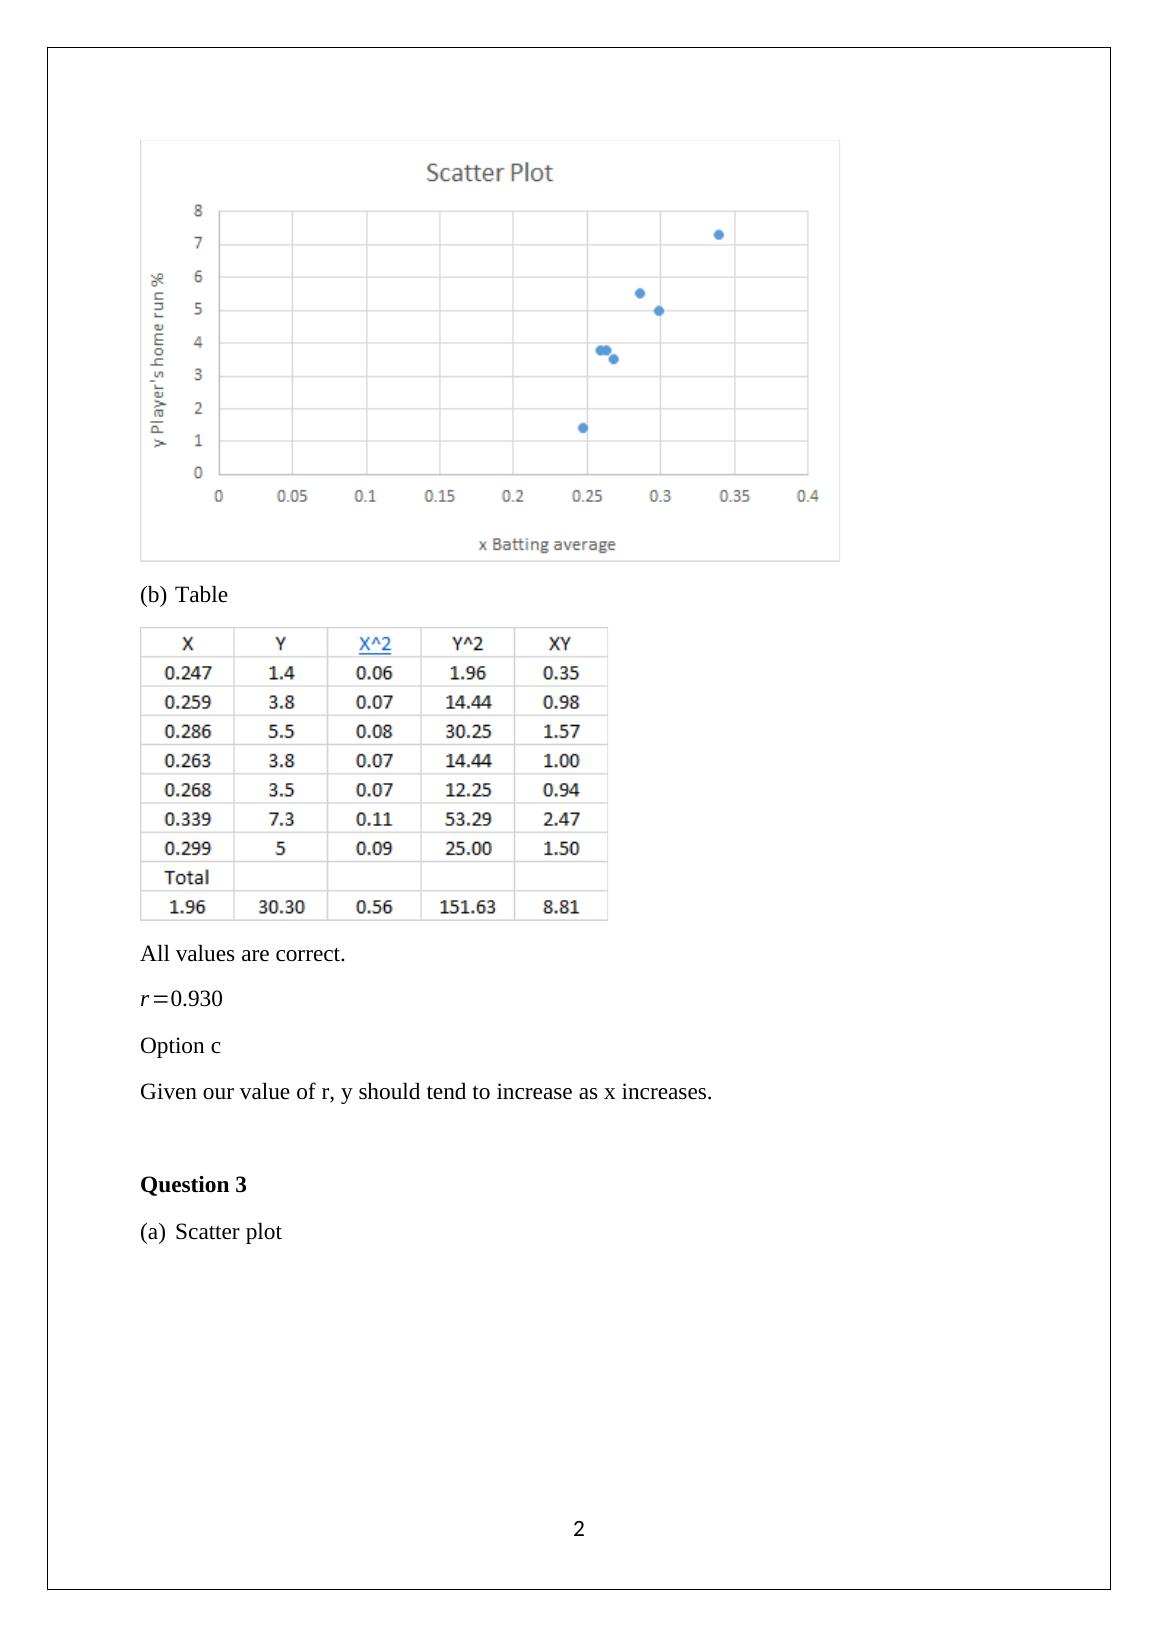
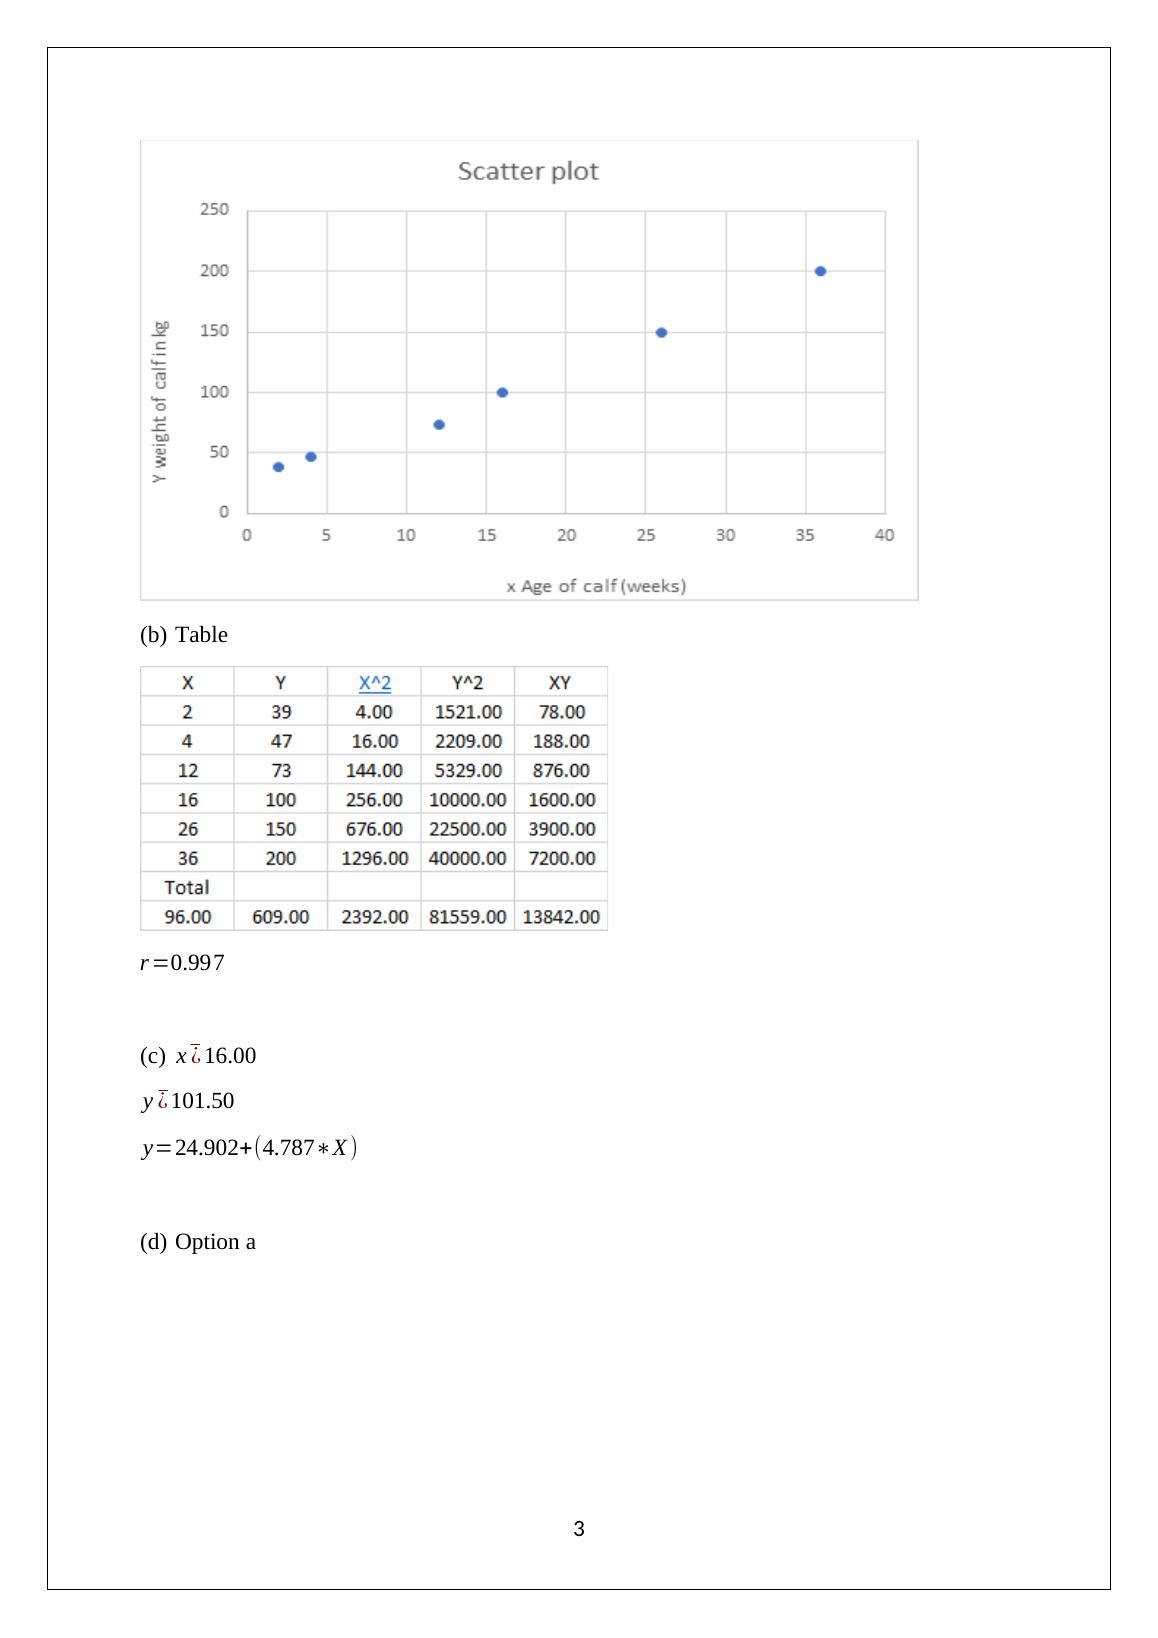
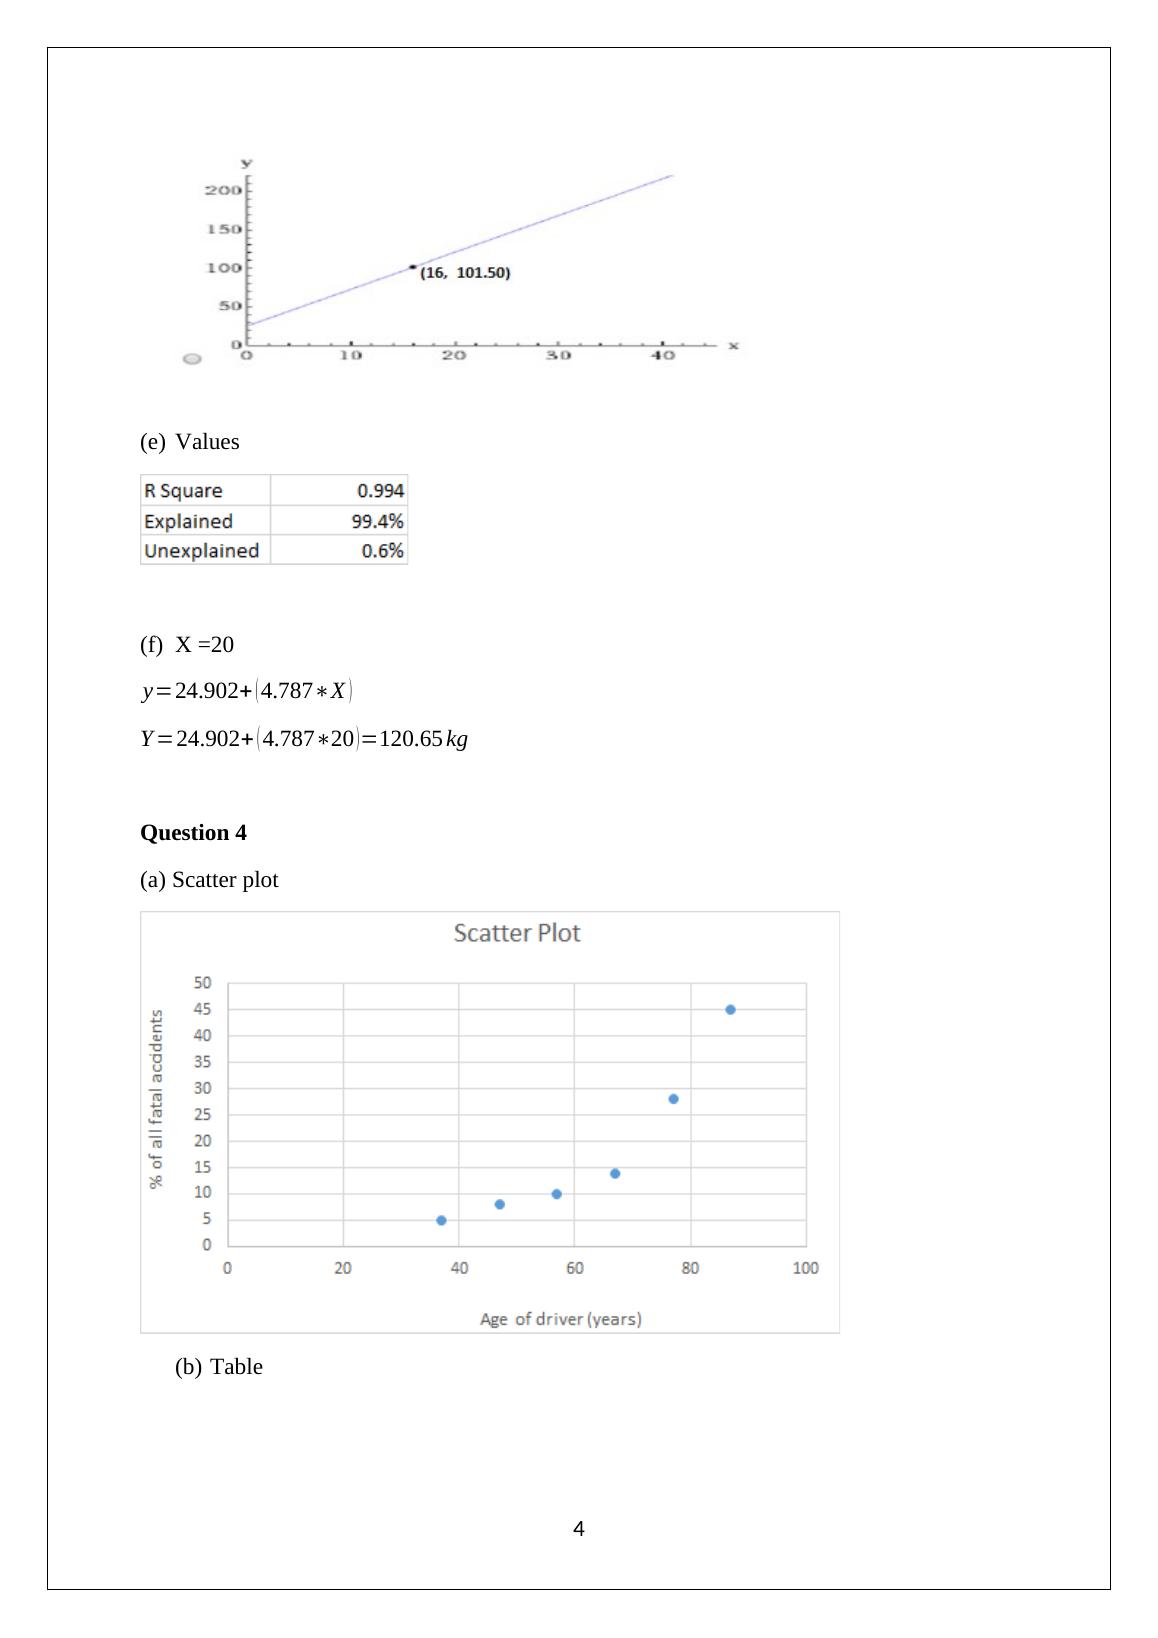
This document provides scatter plots and tables for various questions. It covers topics such as correlation coefficients, significance levels, and statistical analysis. Explore the data and find solutions.
Scatter Plot and Table
Review of WebAssign problems from sections 9.1 - 9.2 and 10.1-10.4, with current score and a question about earthquake magnitude and depth relationship.
Added on 2023-01-11
ShareRelated Documents
End of preview
Want to access all the pages? Upload your documents or become a member.
STATISTICS [Document subtitle].
|3
|428
|52
Linear Regression and Correlation Analysis Assignment
|13
|1372
|109
Question 12 (a) Scatter plot.
|6
|307
|34
Solved Assignments, Essays, Dissertations | Desklib
|13
|1147
|329
Chi-Squared Assignment in Statistical Psychology
|8
|736
|378
Statistics: True/False, Multiple Choice, Fill in the Blanks, Hypothesis Testing, Regression Analysis, Chi-Square Test
|16
|1819
|323