IT Acquisition Management, Charts, and Performance Analysis Report
VerifiedAdded on 2019/10/01
|7
|1171
|148
Homework Assignment
AI Summary
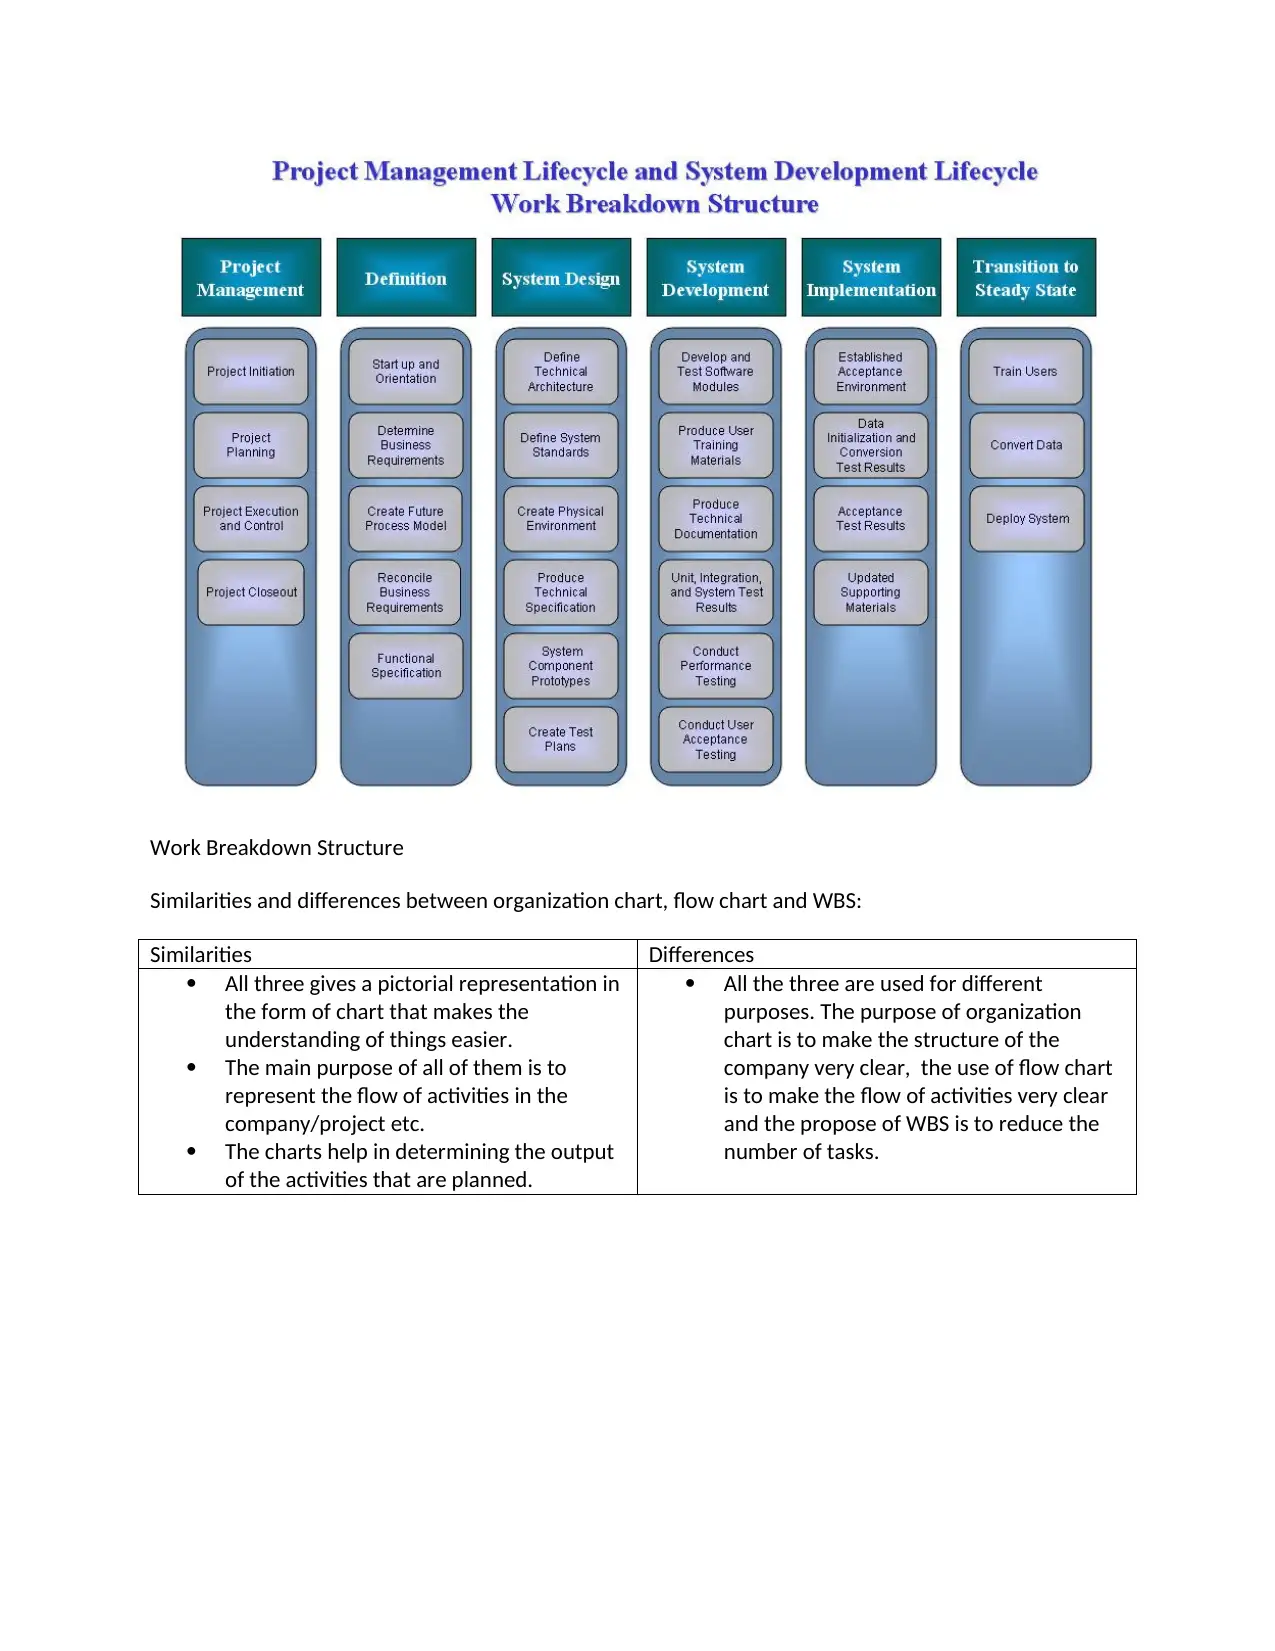
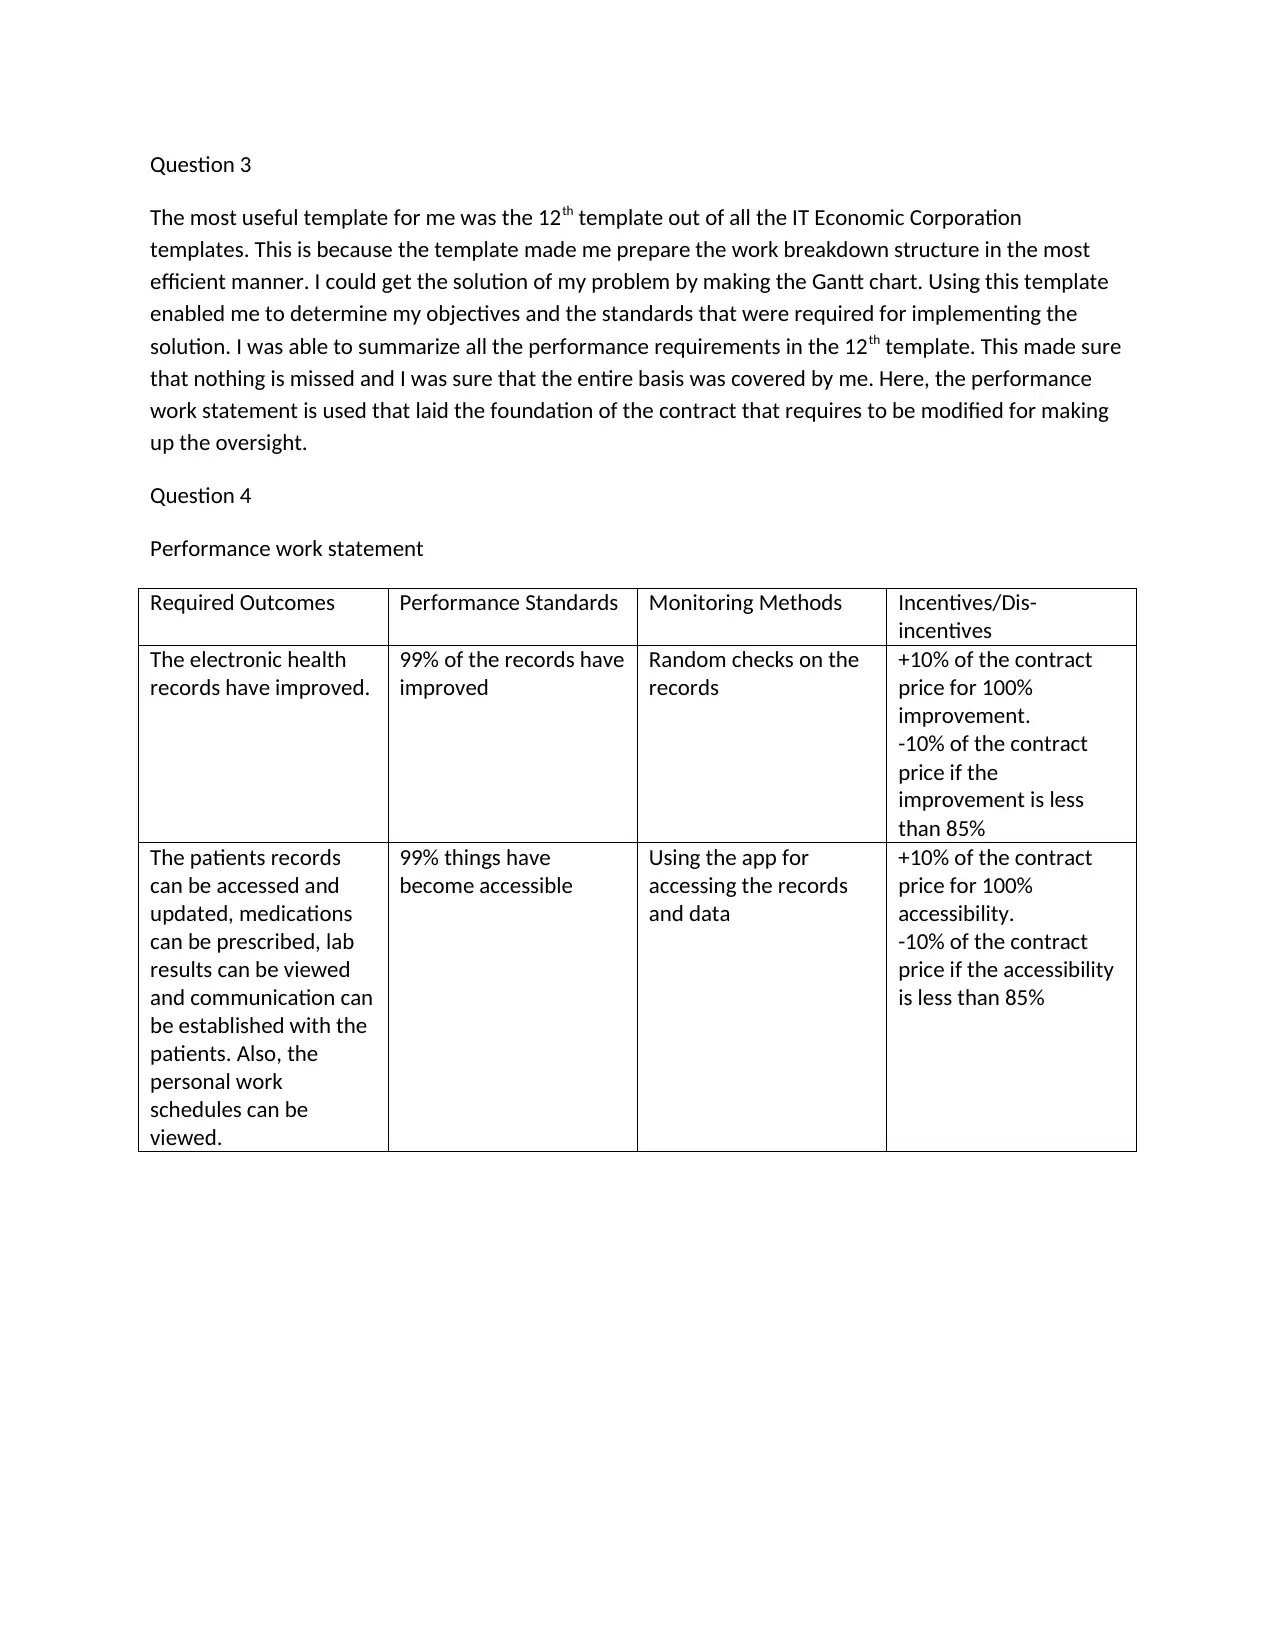
This assignment delves into the core concepts of IT Acquisition Management, exploring its significance in modern business operations, including planning, procurement, accessibility, and security. It differentiates IT acquisition management from commodity purchases, emphasizing its virtual nature. The assignment also examines the purposes and applications of organizational charts, flowcharts, and Work Breakdown Structures (WBS), highlighting their similarities and differences in representing company structures, process flows, and task decomposition. Furthermore, it analyzes the effectiveness of a specific IT Economic Corporation template for creating a Work Breakdown Structure and Gantt chart, emphasizing its role in defining objectives, standards, and performance requirements. The assignment concludes with a performance work statement, outlining required outcomes, performance standards, monitoring methods, and incentives/dis-incentives for electronic health record improvements and patient data accessibility.

Question 1
Meaning of IT Acquisition Management:
IT Acquisition Management is the process by which the companies obtain the IT resources for carrying
out various activities of business like production, management, selling of goods, procuring the raw
material via the online channel etc. (Barton, 2014). The companies are well aware of the criticality of the
IT systems now-a-days and they focus on acquiring it in the right manner. The management of IT
acquisitions involves proper planning, and procurement. In addition to this, the considerations like
accessibility and security is also addressed.
Importance of IT Acquisition Management:
The information systems are the main assets for the companies now. The management is required
because they help the company in the long run by supporting the initiatives of the business. When IT
acquisition happens, the companies become more responsive to the emerging opportunities and thus
they get more clients for their business. Also, the acquisition management helps in identifying the
essential applications and the companies set the priorities for their project.
Difference between IT acquisition management and commodity purchases:
IT acquisition management is more of a virtual process and commodity purchases is more of a physical
process. The commodity purchases happen through the futures contracts on the exchanges that help in
standardizing the quantity and the quality of the commodity that is traded. But, IT acquisition
management helps in facilitating the purchases of the commodities. The purchases of commodities
require physical delivery but the IT acquisition management is mostly done on the systems and
everything is managed in the IT world.
Paraphrase This Document
Need a fresh take? Get an instant paraphrase of this document with our AI Paraphraser

Question 2
The main purpose of organization chart:
The organization chart shows the hierarchical structure and the chain of command that flows in an
organization. It basically helps in making a pictorial representation of the structure of the company and
when an outsider views it, he can easily understand that what goes on in the organization, how the work
is flowing, what is the chain of command, etc. (Isermann, 2012). The company is divided into the various
levels of authority and that gets depicted in the chart. Also, the chart makes it easy for the people to
comprehend the relations between the departments and the people in the company.
The main purpose of flow chart:
When ideas have to be represented in a graphical manner, then flowcharts are used. With the help of
these, the working of complex systems can be shown. The purpose of these is to visualize something
graphically that makes it more effective to understand and implement. It helps in explaining the process
clearly with the help of symbols and texts (Froeling, 2013). Also, they help in giving a gist of the process
flow in just one glance. One common use of flowcharts is that they help in creating the process
documentation
The main purpose of Work Breakdown Structure (WBS):
Work Breakdown Structure enables the project managers to plan their work in an efficient manner. The
main purpose of this is that it helps in reduction of the complicated activities to a collection of few tasks
(Koenigsberger, 2016). This helps the project manager as the tasks can be overseen in an effective
manner than the complex activities. Since these structures are measurable, so the specific costs can be
assigned by the project managers for each of the tasks. Then, it also helps in keeping a track of the
progress of the schedule of the project.

Organizational chart
⊘ This is a preview!⊘
Do you want full access?
Subscribe today to unlock all pages.

Trusted by 1+ million students worldwide

Flow Chart
Paraphrase This Document
Need a fresh take? Get an instant paraphrase of this document with our AI Paraphraser

Work Breakdown Structure
Similarities and differences between organization chart, flow chart and WBS:
Similarities Differences
All three gives a pictorial representation in
the form of chart that makes the
understanding of things easier.
The main purpose of all of them is to
represent the flow of activities in the
company/project etc.
The charts help in determining the output
of the activities that are planned.
All the three are used for different
purposes. The purpose of organization
chart is to make the structure of the
company very clear, the use of flow chart
is to make the flow of activities very clear
and the propose of WBS is to reduce the
number of tasks.

Question 3
The most useful template for me was the 12th template out of all the IT Economic Corporation
templates. This is because the template made me prepare the work breakdown structure in the most
efficient manner. I could get the solution of my problem by making the Gantt chart. Using this template
enabled me to determine my objectives and the standards that were required for implementing the
solution. I was able to summarize all the performance requirements in the 12th template. This made sure
that nothing is missed and I was sure that the entire basis was covered by me. Here, the performance
work statement is used that laid the foundation of the contract that requires to be modified for making
up the oversight.
Question 4
Performance work statement
Required Outcomes Performance Standards Monitoring Methods Incentives/Dis-
incentives
The electronic health
records have improved.
99% of the records have
improved
Random checks on the
records
+10% of the contract
price for 100%
improvement.
-10% of the contract
price if the
improvement is less
than 85%
The patients records
can be accessed and
updated, medications
can be prescribed, lab
results can be viewed
and communication can
be established with the
patients. Also, the
personal work
schedules can be
viewed.
99% things have
become accessible
Using the app for
accessing the records
and data
+10% of the contract
price for 100%
accessibility.
-10% of the contract
price if the accessibility
is less than 85%
⊘ This is a preview!⊘
Do you want full access?
Subscribe today to unlock all pages.

Trusted by 1+ million students worldwide

References:
Barton, B. A., & Costanza, M. E. (2014). Data Acquisition, Management and Tracking.
Froeling, V., Meckelburg, K., Schreiter, N. F., Scheurig-Muenkler, C., Kamp, J., Maurer, M. H., ... &
Kroencke, T. J. (2013). Outcome of uterine artery embolization versus MR-guided high-intensity focused
ultrasound treatment for uterine fibroids: long-term results. European journal of radiology, 82(12), 2265-
2269.
Isermann, R., Mannale, R., & Schmitt, K. (2012). Collision-avoidance systems PRORETA: Situation
analysis and intervention control. Control Engineering Practice, 20(11), 1236-1246.
Koenigsberger, F., & Tlusty, J. (2016). Machine tool structures. Elsevier.
1 out of 7
Related Documents
Your All-in-One AI-Powered Toolkit for Academic Success.
+13062052269
info@desklib.com
Available 24*7 on WhatsApp / Email
Unlock your academic potential
Copyright © 2020–2026 A2Z Services. All Rights Reserved. Developed and managed by ZUCOL.


