Analysis of Facebook's Stock Performance and Capital Structure
VerifiedAdded on 2022/10/16
|7
|1675
|11
Report
AI Summary
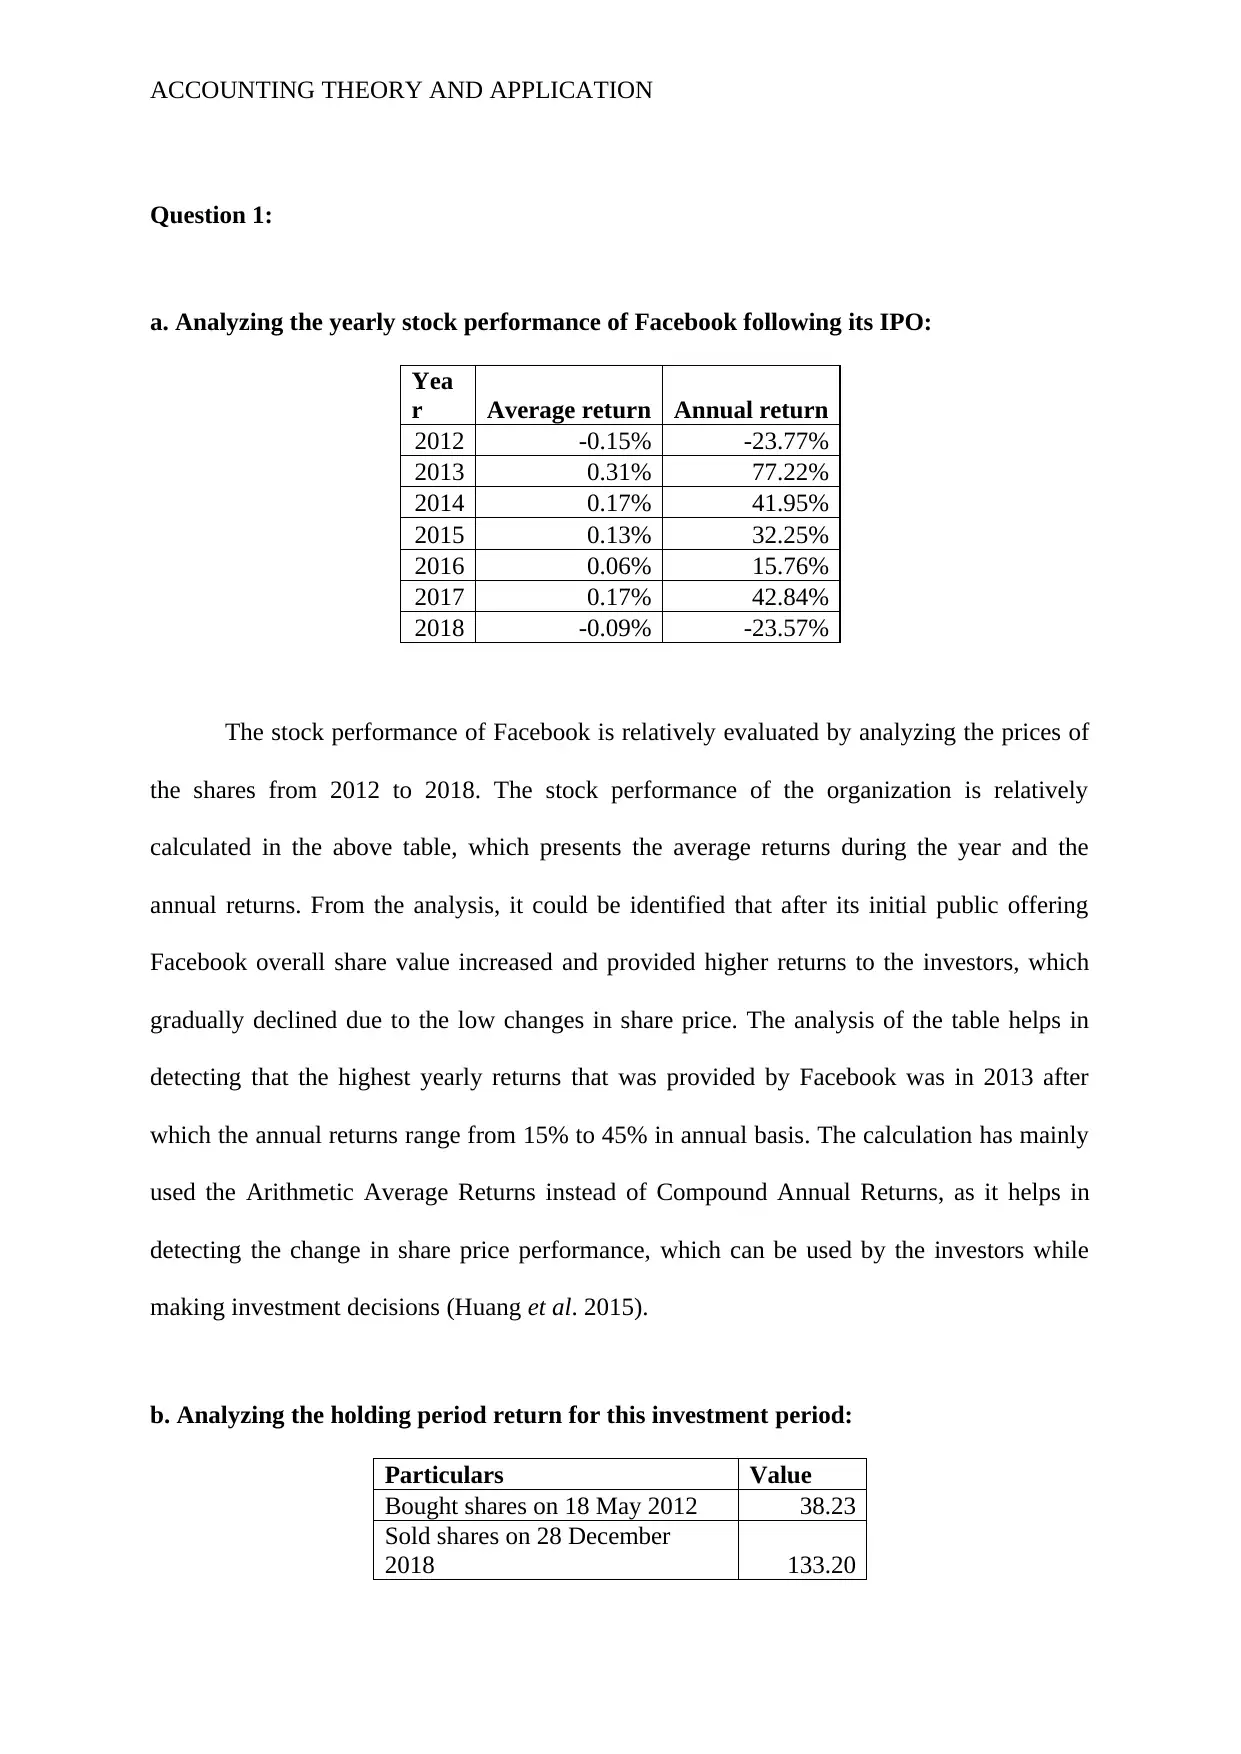
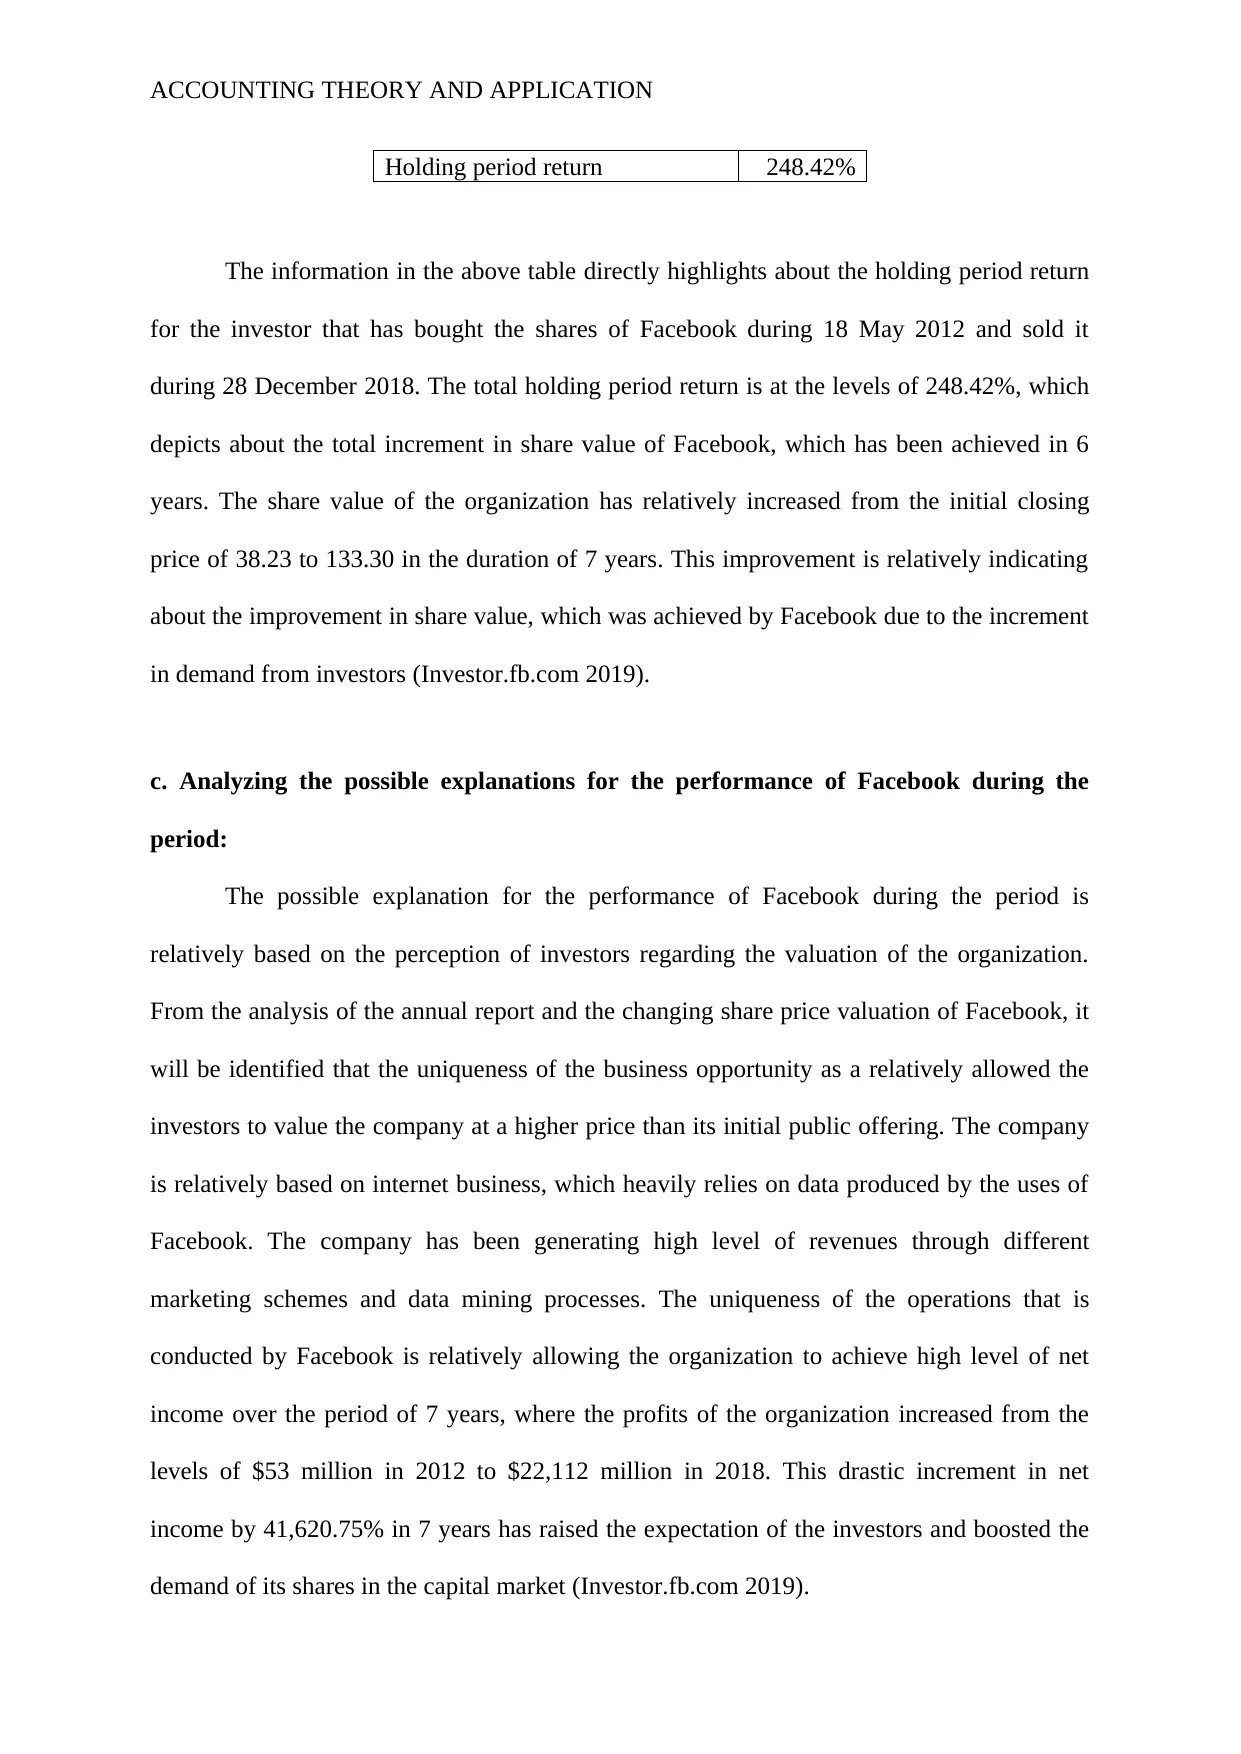
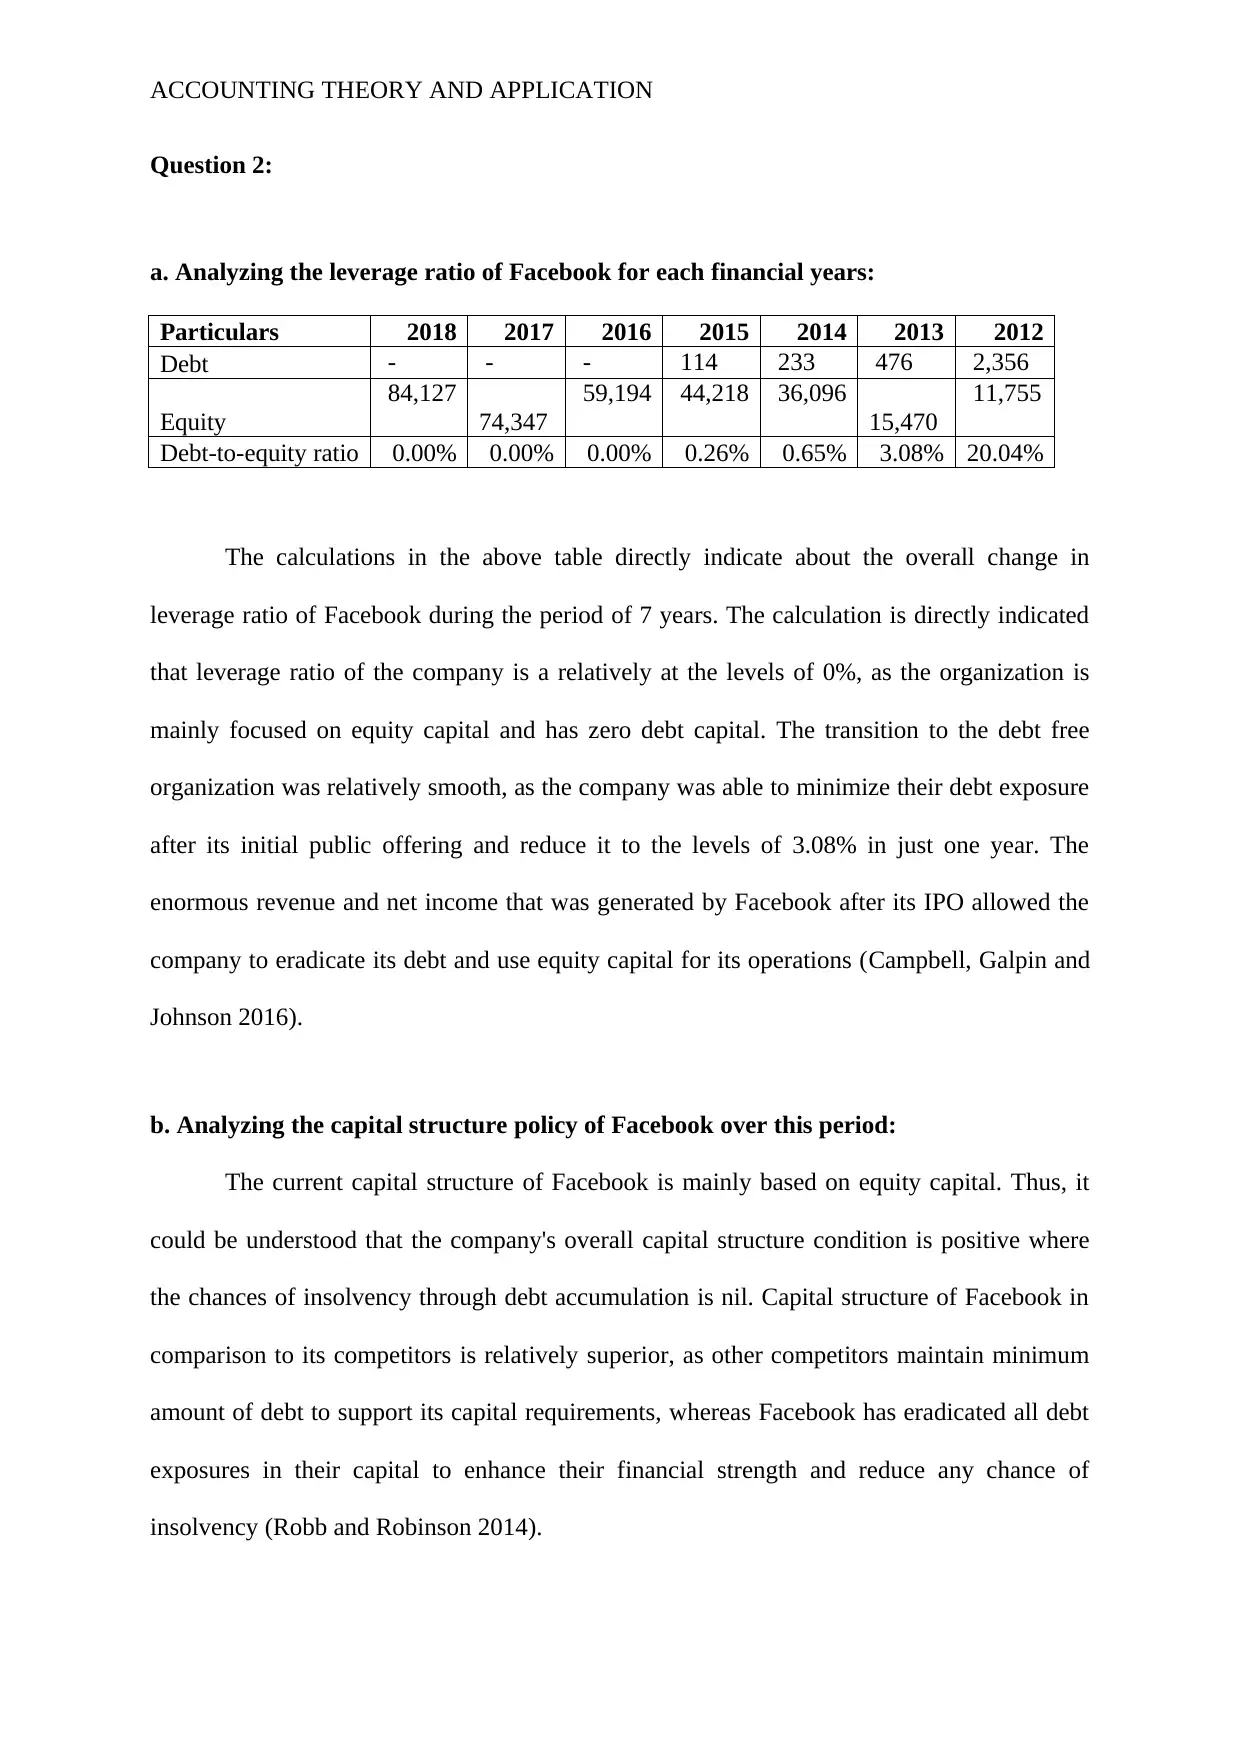
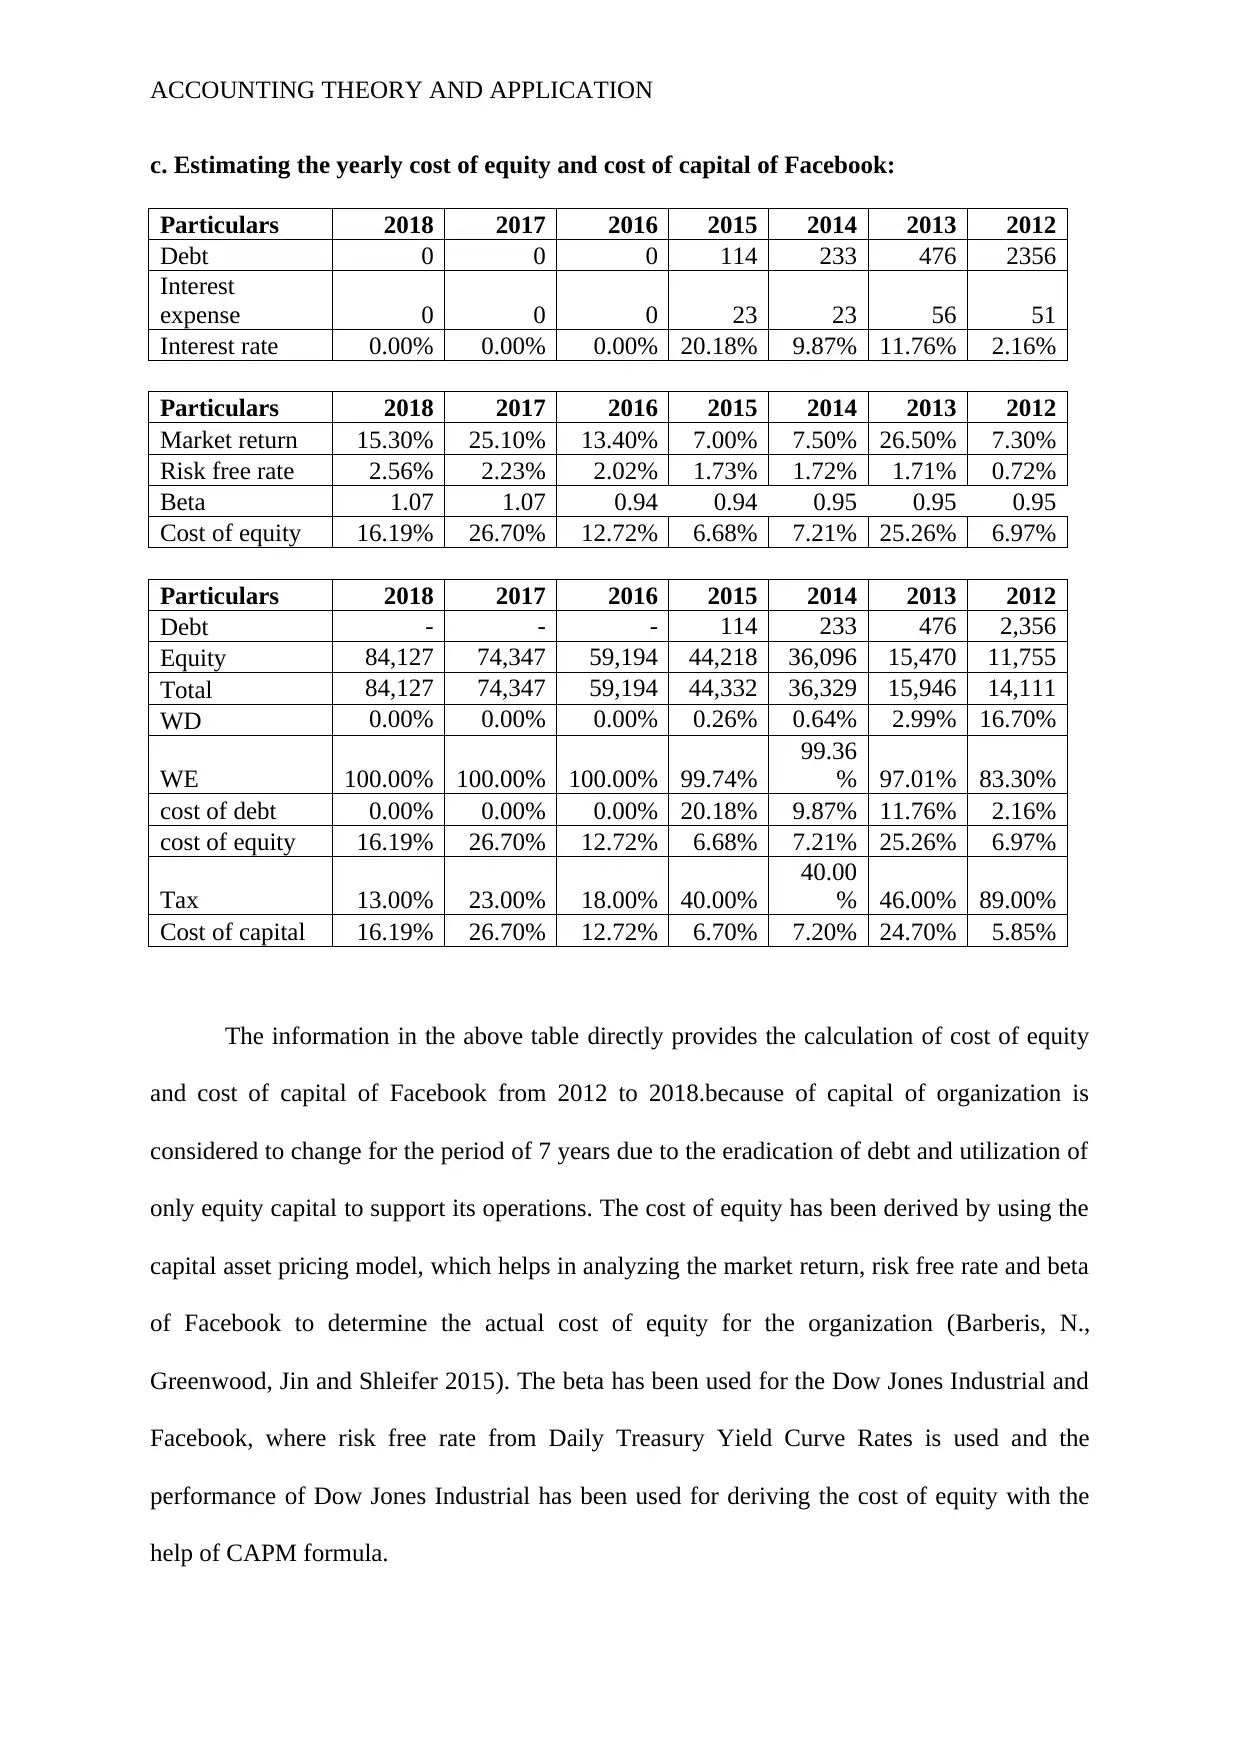
This report provides a comprehensive analysis of Facebook's financial performance from its IPO in May 2012 to December 2018. It begins by calculating and analyzing the yearly stock performance, including average and annual returns, highlighting the impact of the initial public offering and subsequent market fluctuations. The report then calculates the holding period return for an investor who purchased shares at the IPO and sold them at the end of 2018, demonstrating the overall investment gains. Furthermore, the analysis delves into the possible explanations for Facebook's performance, focusing on investor perception, revenue generation through marketing and data mining, and the company's unique position in the internet business sector. The report also examines Facebook's leverage ratio, capital structure policy, and estimates the yearly cost of equity and cost of capital, providing insights into the company's financial stability and investment attractiveness.
1 out of 7
Related Documents


Your All-in-One AI-Powered Toolkit for Academic Success.
+13062052269
info@desklib.com
Available 24*7 on WhatsApp / Email
![[object Object]](/_next/static/media/star-bottom.7253800d.svg)
Copyright © 2020–2026 A2Z Services. All Rights Reserved. Developed and managed by ZUCOL.