Econometric Report: Causality and Forecasting in Sales and Advertising
VerifiedAdded on 2021/06/17
|12
|1519
|39
Report
AI Summary
This report replicates and analyzes the study "The long run, causality, and forecasting in the advertising-sales Relationship" by George P Zanias (1994), which examines the relationship between sales and advertising spending using the Lydia Pinkham data set from 1907 to 1960. The analysis involves co-integration, Granger Causality tests to determine the structural relationship, and Vector Error Correction Models (VECM) for forecasting. The study employs logarithmic values of advertising and sales to analyze growth patterns, finding a bi-directional Granger causality between the two variables, and uses impulse response functions to further analyze the relationship. The report also includes unit root tests to assess data stationarity and critical evaluation of the methodologies used, highlighting the study's contribution to improved forecasting through the use of error correction models, although the model fit is weak due to the omission of other variables. The study does take into account Auto-Correlation or serial co-relation among the variables, which makes the study incomplete.

qwertyuiopasdfghjklzxcvbnmqwertyui
opasdfghjklzxcvbnmqwertyuiopasdfgh
jklzxcvbnmqwertyuiopasdfghjklzxcvb
nmqwertyuiopasdfghjklzxcvbnmqwer
tyuiopasdfghjklzxcvbnmqwertyuiopas
dfghjklzxcvbnmqwertyuiopasdfghjklzx
cvbnmqwertyuiopasdfghjklzxcvbnmq
wertyuiopasdfghjklzxcvbnmqwertyuio
pasdfghjklzxcvbnmqwertyuiopasdfghj
klzxcvbnmqwertyuiopasdfghjklzxcvbn
mqwertyuiopasdfghjklzxcvbnmqwerty
uiopasdfghjklzxcvbnmqwertyuiopasdf
ghjklzxcvbnmqwertyuiopasdfghjklzxc
vbnmqwertyuiopasdfghjklzxcvbnmrty
uiopasdfghjklzxcvbnmqwertyuiopasdf
ghjklzxcvbnmqwertyuiopasdfghjklzxc
[Type the document title]
[Type the document subtitle]
[Pick the date]
Geeta
Paraphrase This Document
Need a fresh take? Get an instant paraphrase of this document with our AI Paraphraser
Contents
Summary.....................................................................................................................................................1
Critical evaluation........................................................................................................................................1
Data and Analysis : Model Replication........................................................................................................2
Unit Root Tests........................................................................................................................................2
Granger Causality Test.............................................................................................................................6
Further Analysis..........................................................................................................................................8
Further Structural Analysis using impulse responses...............................................................................8
Vector Error Correction Model Forecasts................................................................................................9
Bibliography...............................................................................................................................................11
Summary
The paper being replicated is “The long run, causality, and forecasting in the advertising- sales
Relationship” by George P Zanias.(Zanias, 1994) The paper conduct a co-integration analysis of
the Lydia Pinkham Data set. The Co-intergration analysis is used to analyse the long term
relationship between the sales and advertising process. Granger Causality test is used to test this
relationship and model the data, using an error corrected model.
The paper takes the logarithmic values of the advertising and sales spending (in US Dollars) .
Logarithmic values often depict the growth of a variable, implying that spending in advertising
grew, given an increase in sales and vice versa.
The study utilized data from 1907 to 1960 i.e 53 years. The study models data in both the long
run and short run. The author finds that there is a bi-directional Granger causality between the
two variables viz: sales and advertising, in the long run. In simple words, the study concludes
that the greater increases in sales revenue are caused by advertising, the greater is the likelihood
of an increase in spending in advertising. The study also, compared the results with previous
studies using the same data sets and concluded that the forecasts are better of error correction
systems are employed and data is modeled in error corrected models i.e. residuals in an equation
should not be neglected.
Critical evaluation
Granger Causality test is usually, conducted to establish if there is a structural relationship
between two variables. The test is well designed since it utilizes the Granger Causality Test with
the log of variables. Taking the log of variable helps establish the structural relationship even
further since the causality between the logs of variables will help understand how the growth in
one variable affects the growth in another variable and it helps understand “elasticity” between
two variables.(Wooldridge, 2015)
The paper goes into details about the augmentation of the Dickey Fuller (Augmented Dickey
Fuller) test to highlight the importance of lags in the causality. (Sjo, 2008) However, the use of
Dickey Fuller Test and Augmented Dickey Fuller Test seem to be redundant. Co-integration is
further established using the Co-integration Durbin Watson (CRDW) Statistic.
The logarithmic values of both the series seem to be non-stationary and had to be differentiated.
However, the tests conducted in this report provide results to the contrary and establish that the
logarithmic values of both the variables are stationary. The reasons for the differing results
cannot be , understood. However, the author does, further use the Error Corrected Model for
modeling which seems appropriate.(Wooldridge, 2015)
The study does take into account Auto-Correlation or serial co-relation among the variables,
which makes the study incomplete. It is possible that the growth is a result of serial co-relation
and not exclusively caused by a change in the other variable.(Wooldridge, 2015)
Overall, the study has been well designed and implemented with all the appropriate tests being
conducted. The study also, highlights the importance of logarithmic values compared to
arithmetic values. The primary achievement of the study, however, lies in the fact that it has
contributed to literature by improving the quality of forecasts as compared to previous studies by
including a vector-error corrected model.
Data and Analysis : Model Replication
The data taken is sales and advertising data for the period of 1907 to 1960. In this data, the data
taken is for both
Unit Root Tests
The paper first evaluates the stationarity of the data. The stationarity of the data is evaluated
using the Advanced Dickey Fuller Test (separately for both variables). The Null Hypothesis
⊘ This is a preview!⊘
Do you want full access?
Subscribe today to unlock all pages.
Trusted by 1+ million students worldwide
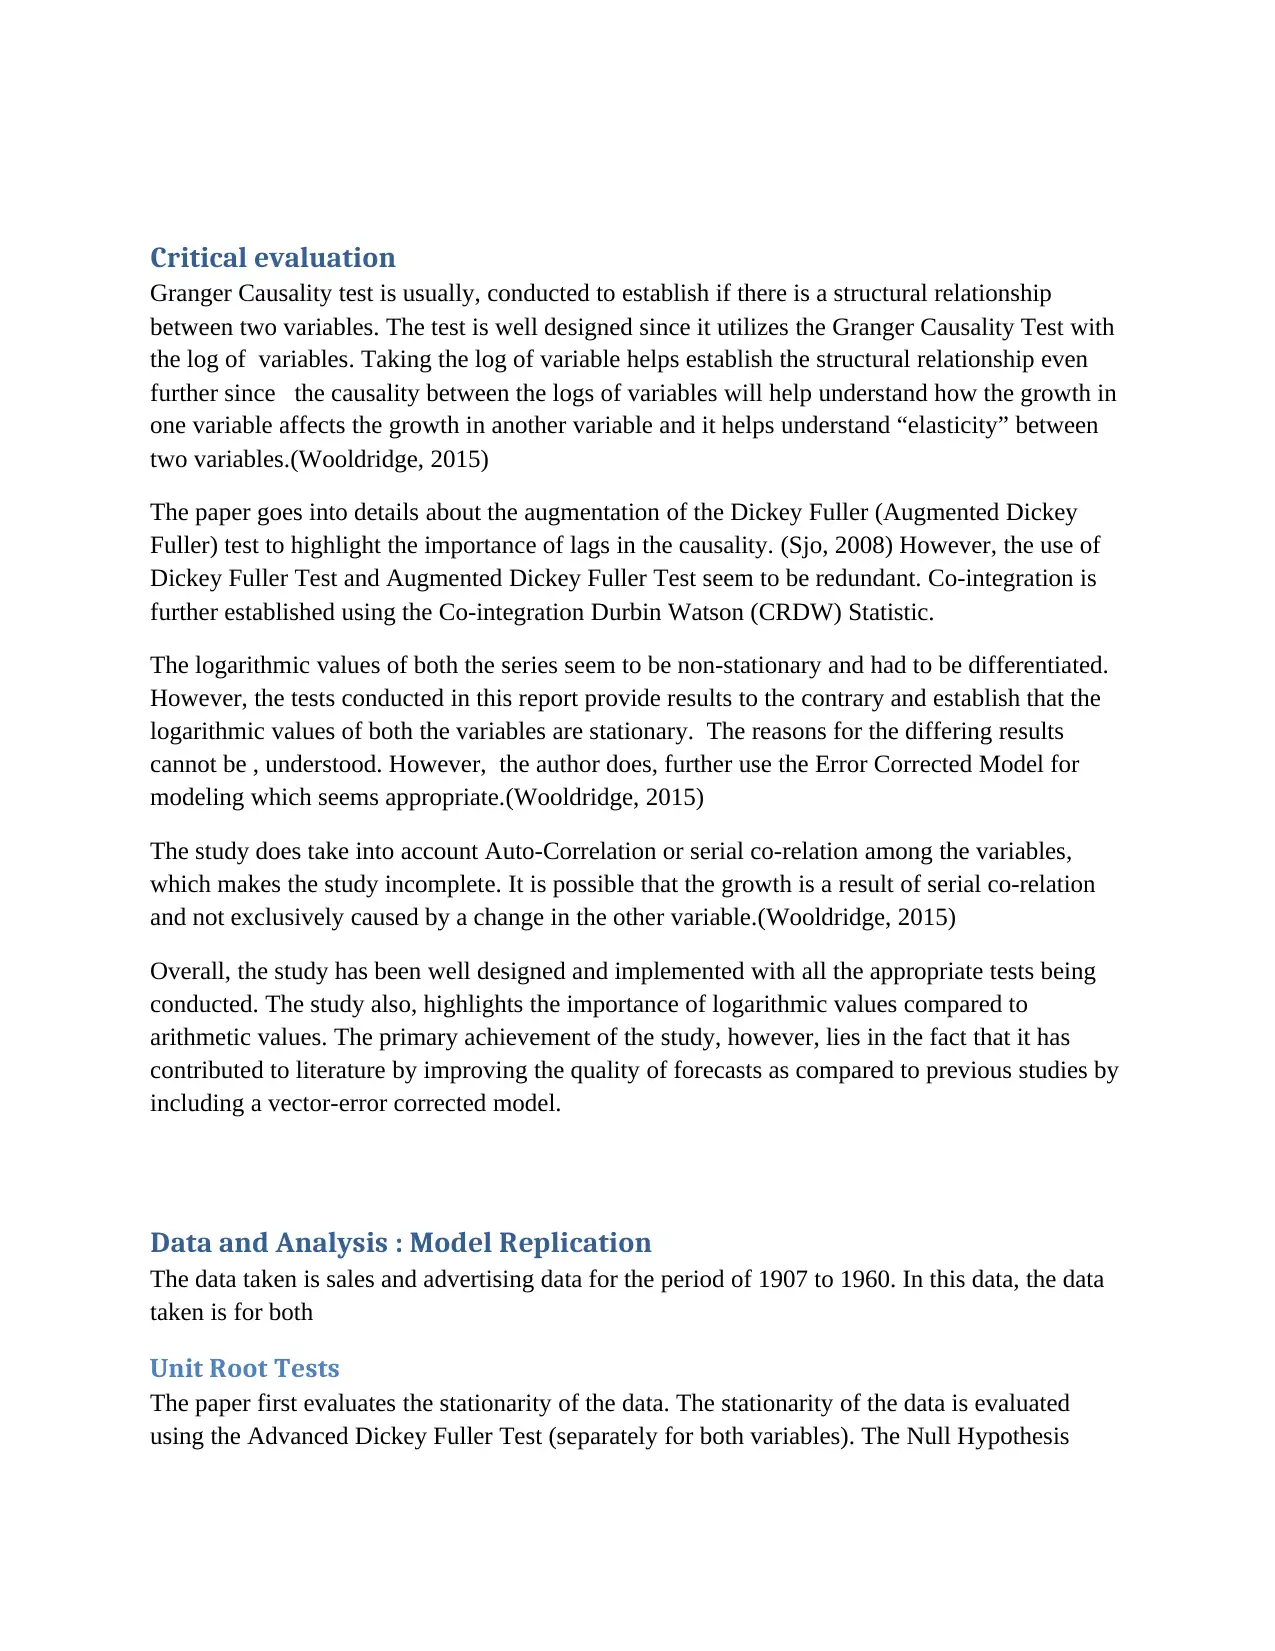
being that there is a presence of unit roots, the ADF test rejects the null hypothesis for both the
variables i.e. sales and advertising. (Nielsen, 2005)
Table 1 ADF Test for natural log of advertising represented by “la” (Durbin Watson
Statistic is highlighted)
variables i.e. sales and advertising. (Nielsen, 2005)
Table 1 ADF Test for natural log of advertising represented by “la” (Durbin Watson
Statistic is highlighted)
Paraphrase This Document
Need a fresh take? Get an instant paraphrase of this document with our AI Paraphraser
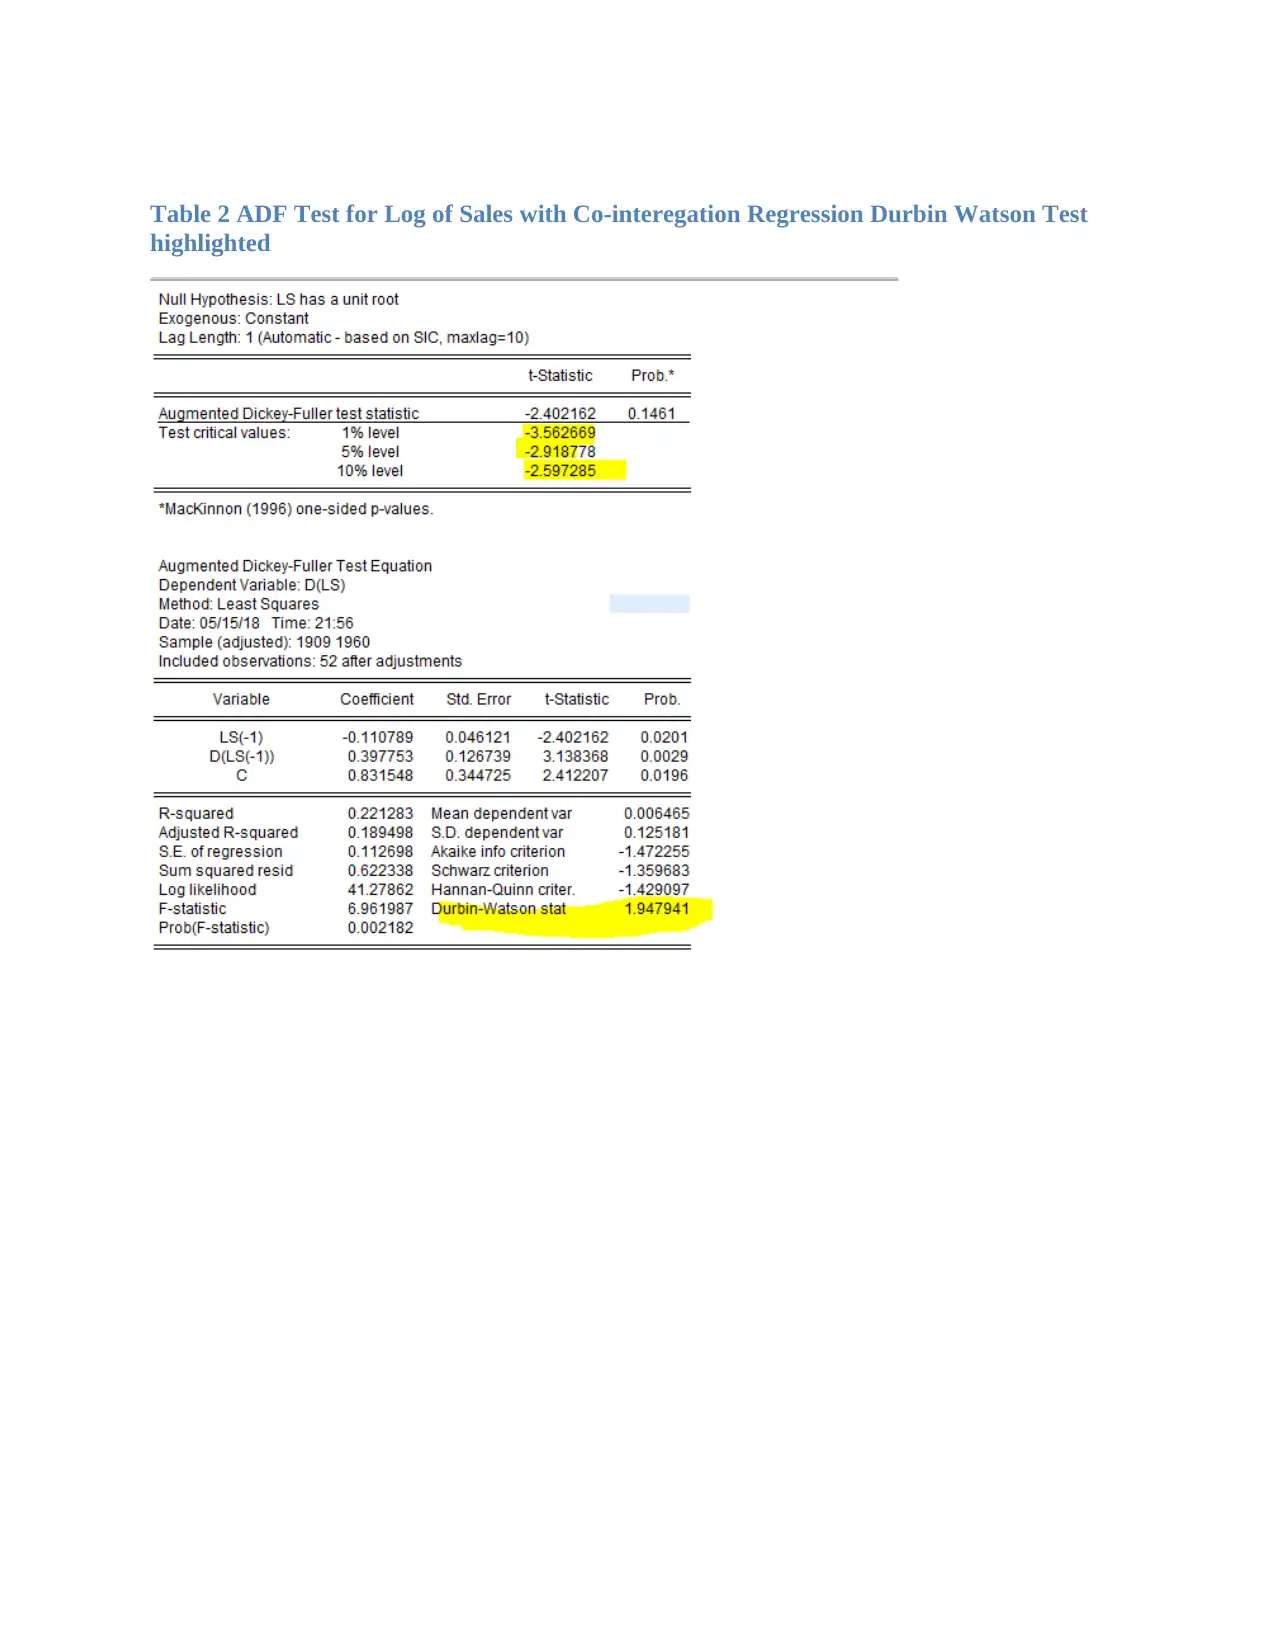
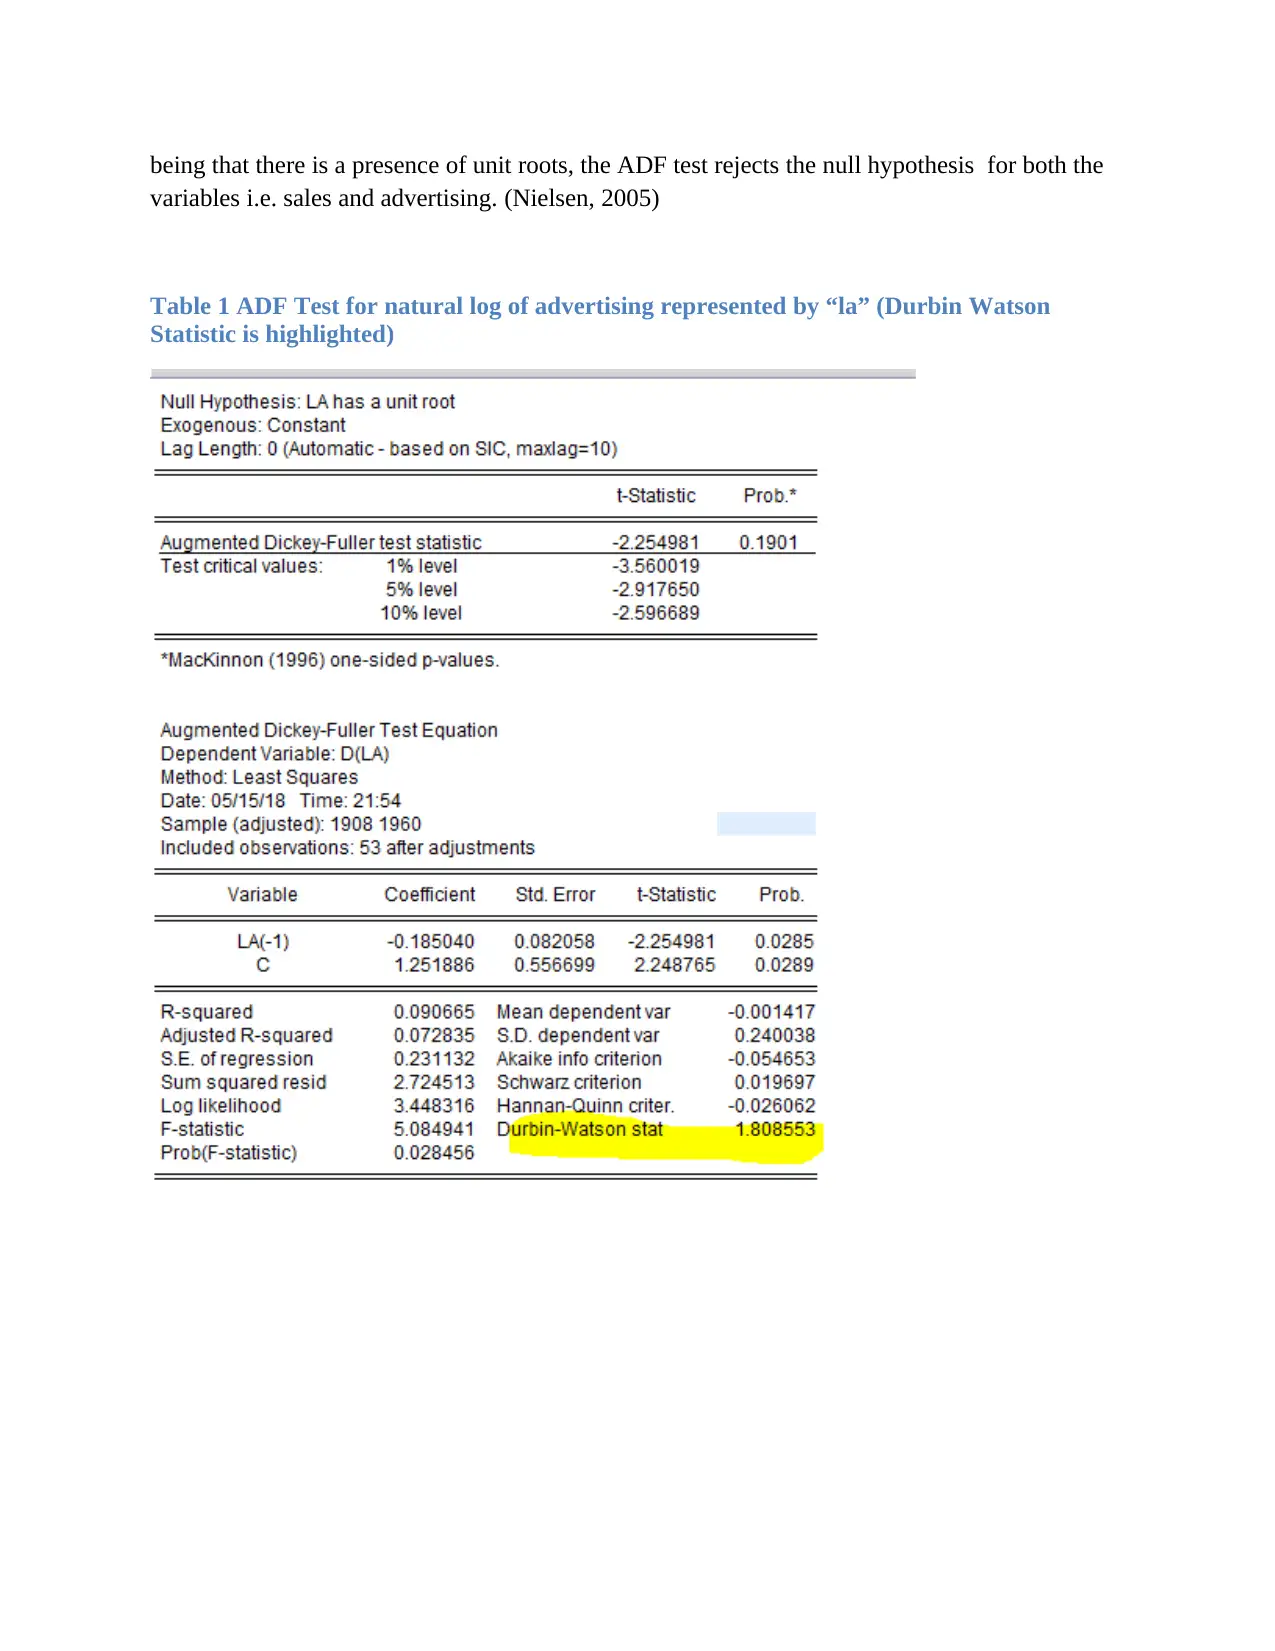
Table 2 ADF Test for Log of Sales with Co-interegation Regression Durbin Watson Test
highlighted
highlighted
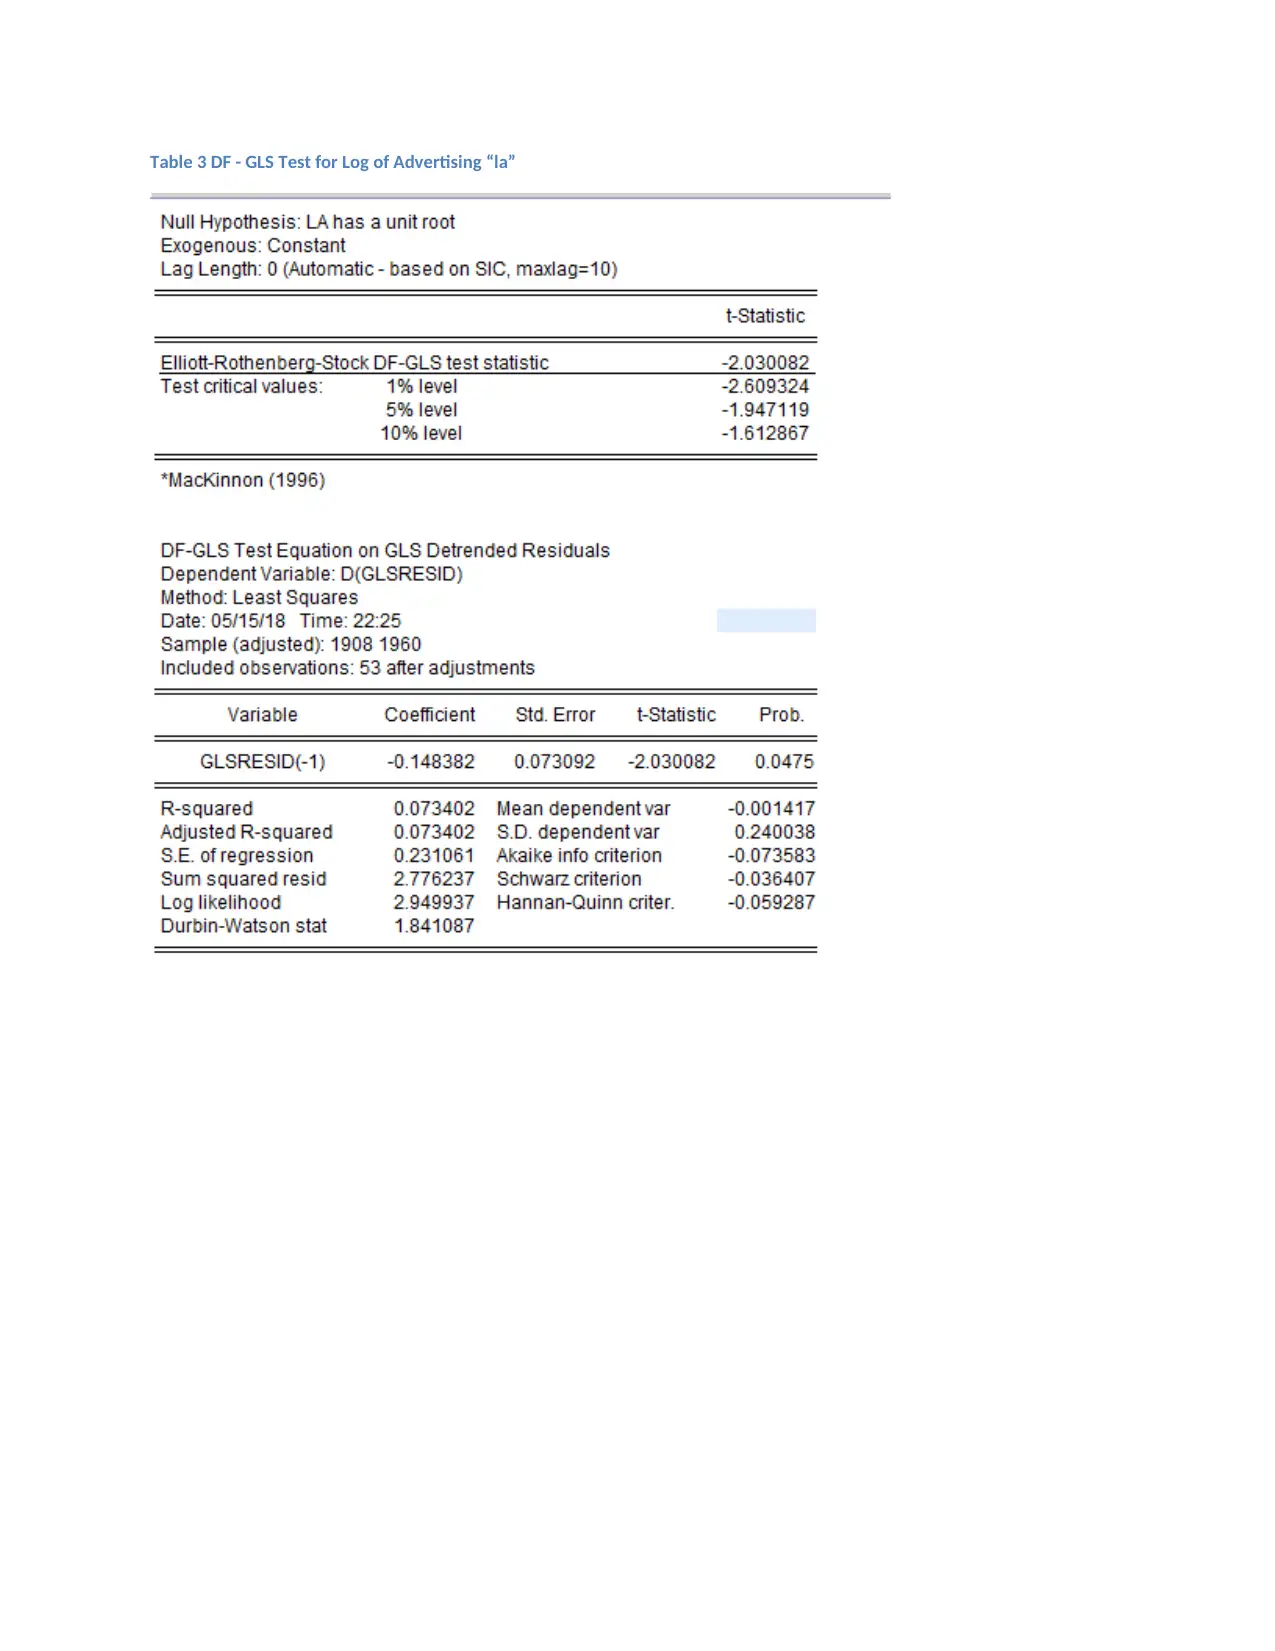
Table 3 DF - GLS Test for Log of Advertising “la”
⊘ This is a preview!⊘
Do you want full access?
Subscribe today to unlock all pages.
Trusted by 1+ million students worldwide
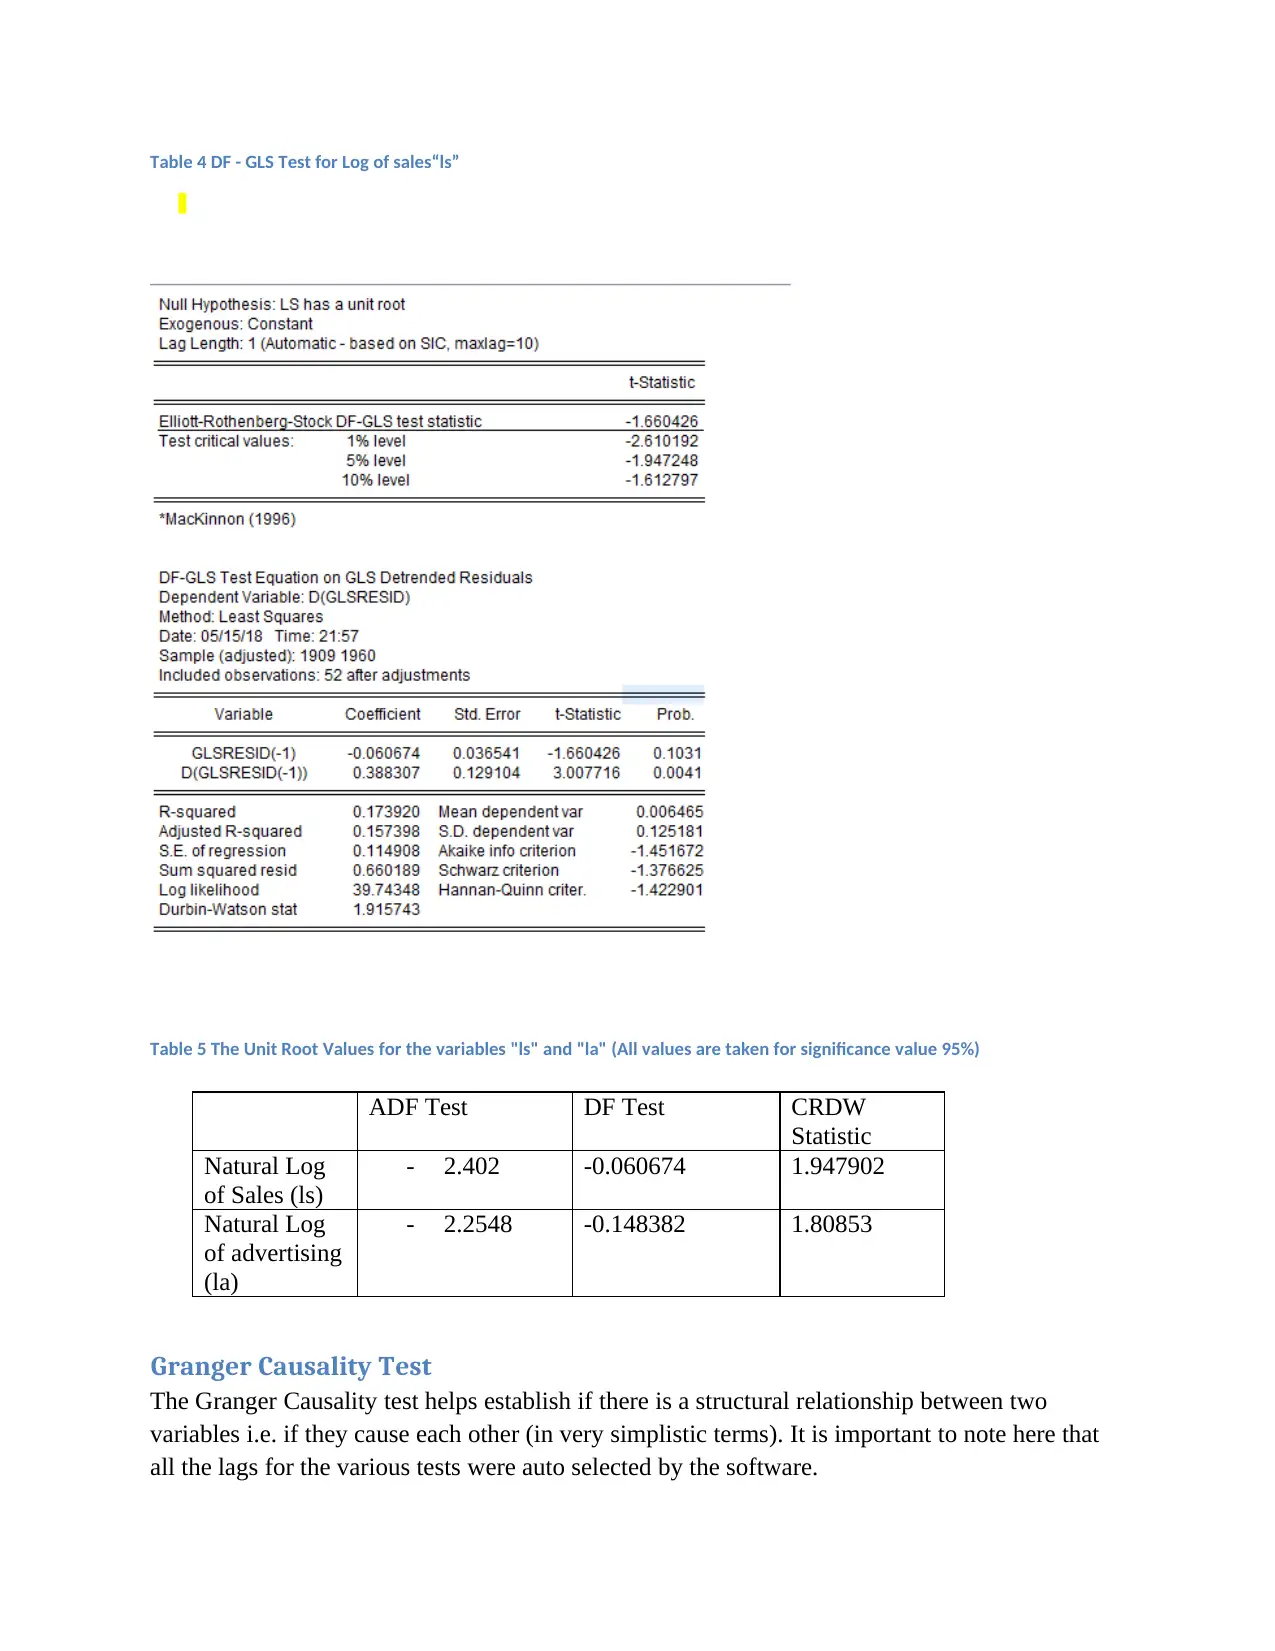
Table 4 DF - GLS Test for Log of sales“ls”
Table 5 The Unit Root Values for the variables "ls" and "la" (All values are taken for significance value 95%)
Granger Causality Test
The Granger Causality test helps establish if there is a structural relationship between two
variables i.e. if they cause each other (in very simplistic terms). It is important to note here that
all the lags for the various tests were auto selected by the software.
ADF Test DF Test CRDW
Statistic
Natural Log
of Sales (ls)
- 2.402 -0.060674 1.947902
Natural Log
of advertising
(la)
- 2.2548 -0.148382 1.80853
Paraphrase This Document
Need a fresh take? Get an instant paraphrase of this document with our AI Paraphraser
The equation for the Granger Causality is:
Lst = α + ∑ β (lst-1) + Residuals --- >
Lsa= α + ∑ β (lat-1) + Residuals --->
If the test is significant , then the null hypothesis that there is no Granger Causality from one
variable to another is not rejected.
The output is as follows:
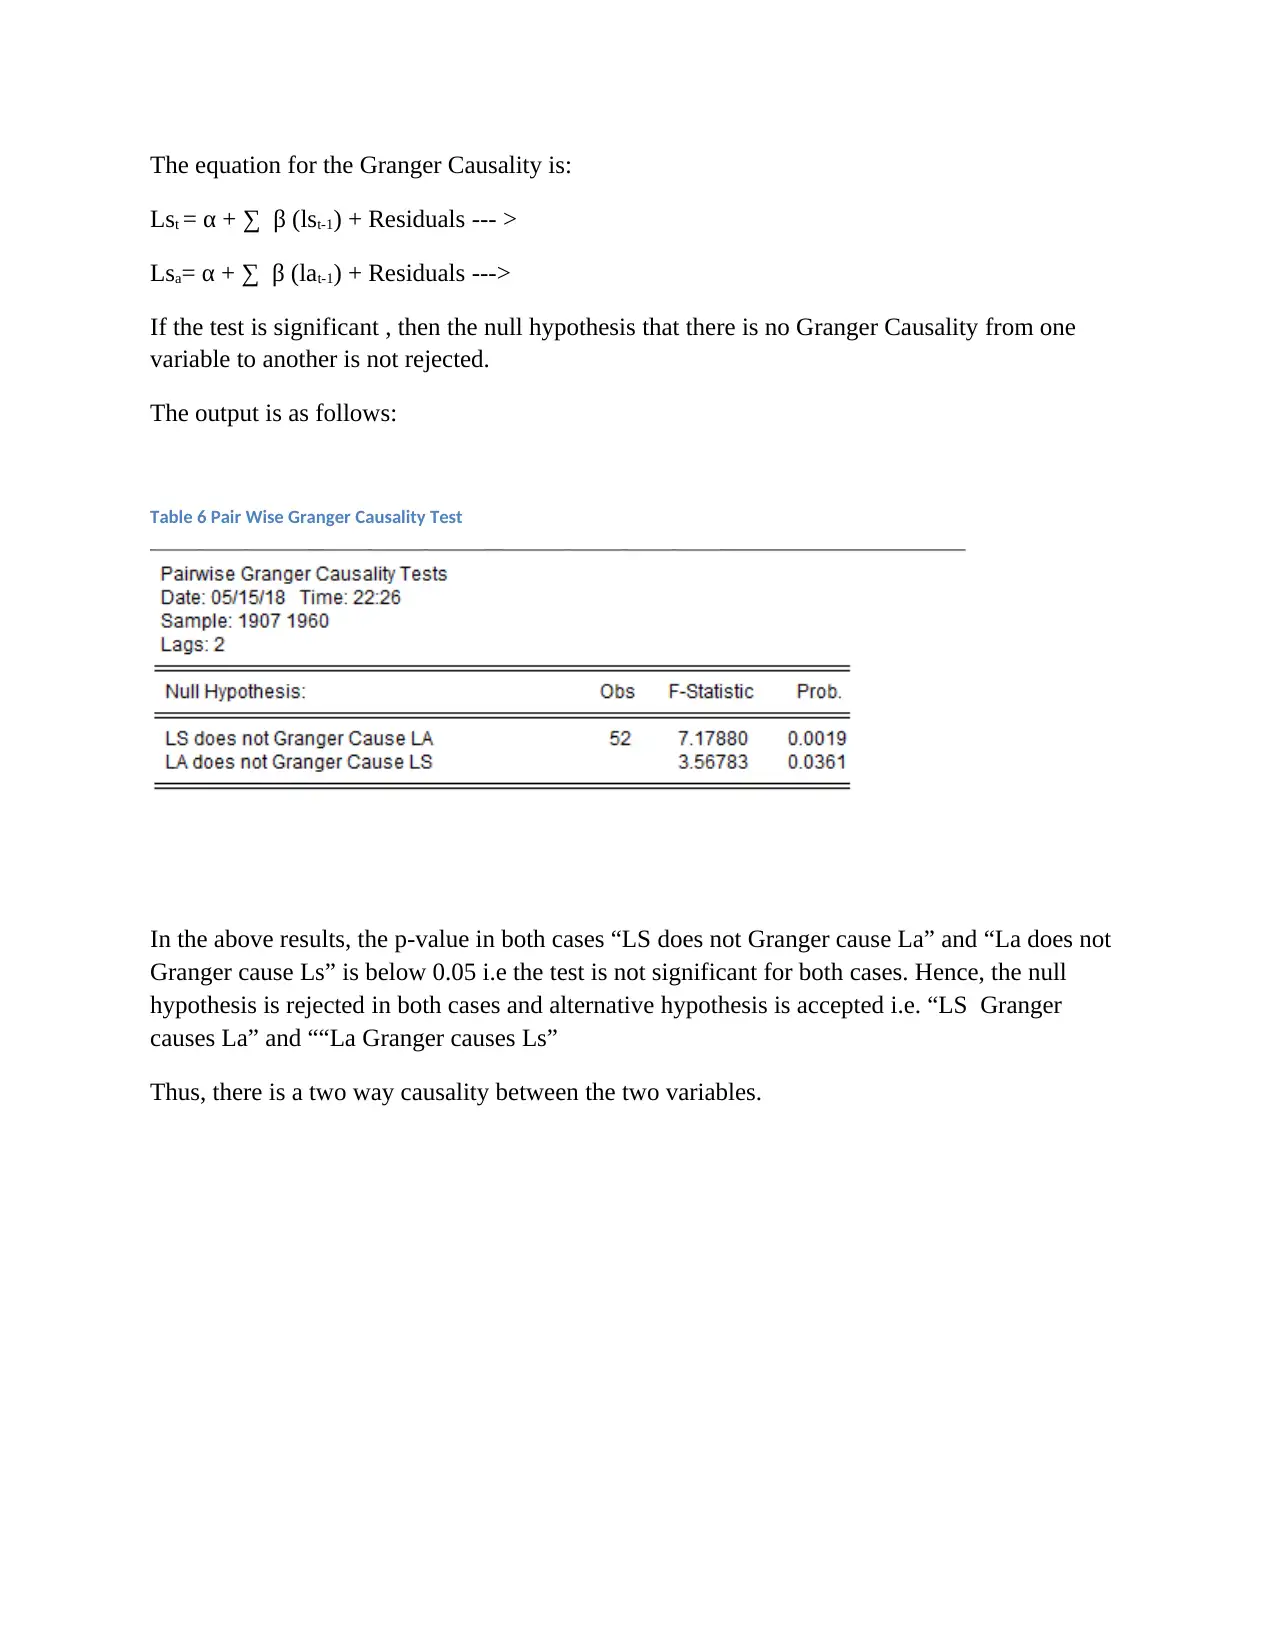
Table 6 Pair Wise Granger Causality Test
In the above results, the p-value in both cases “LS does not Granger cause La” and “La does not
Granger cause Ls” is below 0.05 i.e the test is not significant for both cases. Hence, the null
hypothesis is rejected in both cases and alternative hypothesis is accepted i.e. “LS Granger
causes La” and ““La Granger causes Ls”
Thus, there is a two way causality between the two variables.
Lst = α + ∑ β (lst-1) + Residuals --- >
Lsa= α + ∑ β (lat-1) + Residuals --->
If the test is significant , then the null hypothesis that there is no Granger Causality from one
variable to another is not rejected.
The output is as follows:
Table 6 Pair Wise Granger Causality Test
In the above results, the p-value in both cases “LS does not Granger cause La” and “La does not
Granger cause Ls” is below 0.05 i.e the test is not significant for both cases. Hence, the null
hypothesis is rejected in both cases and alternative hypothesis is accepted i.e. “LS Granger
causes La” and ““La Granger causes Ls”
Thus, there is a two way causality between the two variables.
Further Analysis
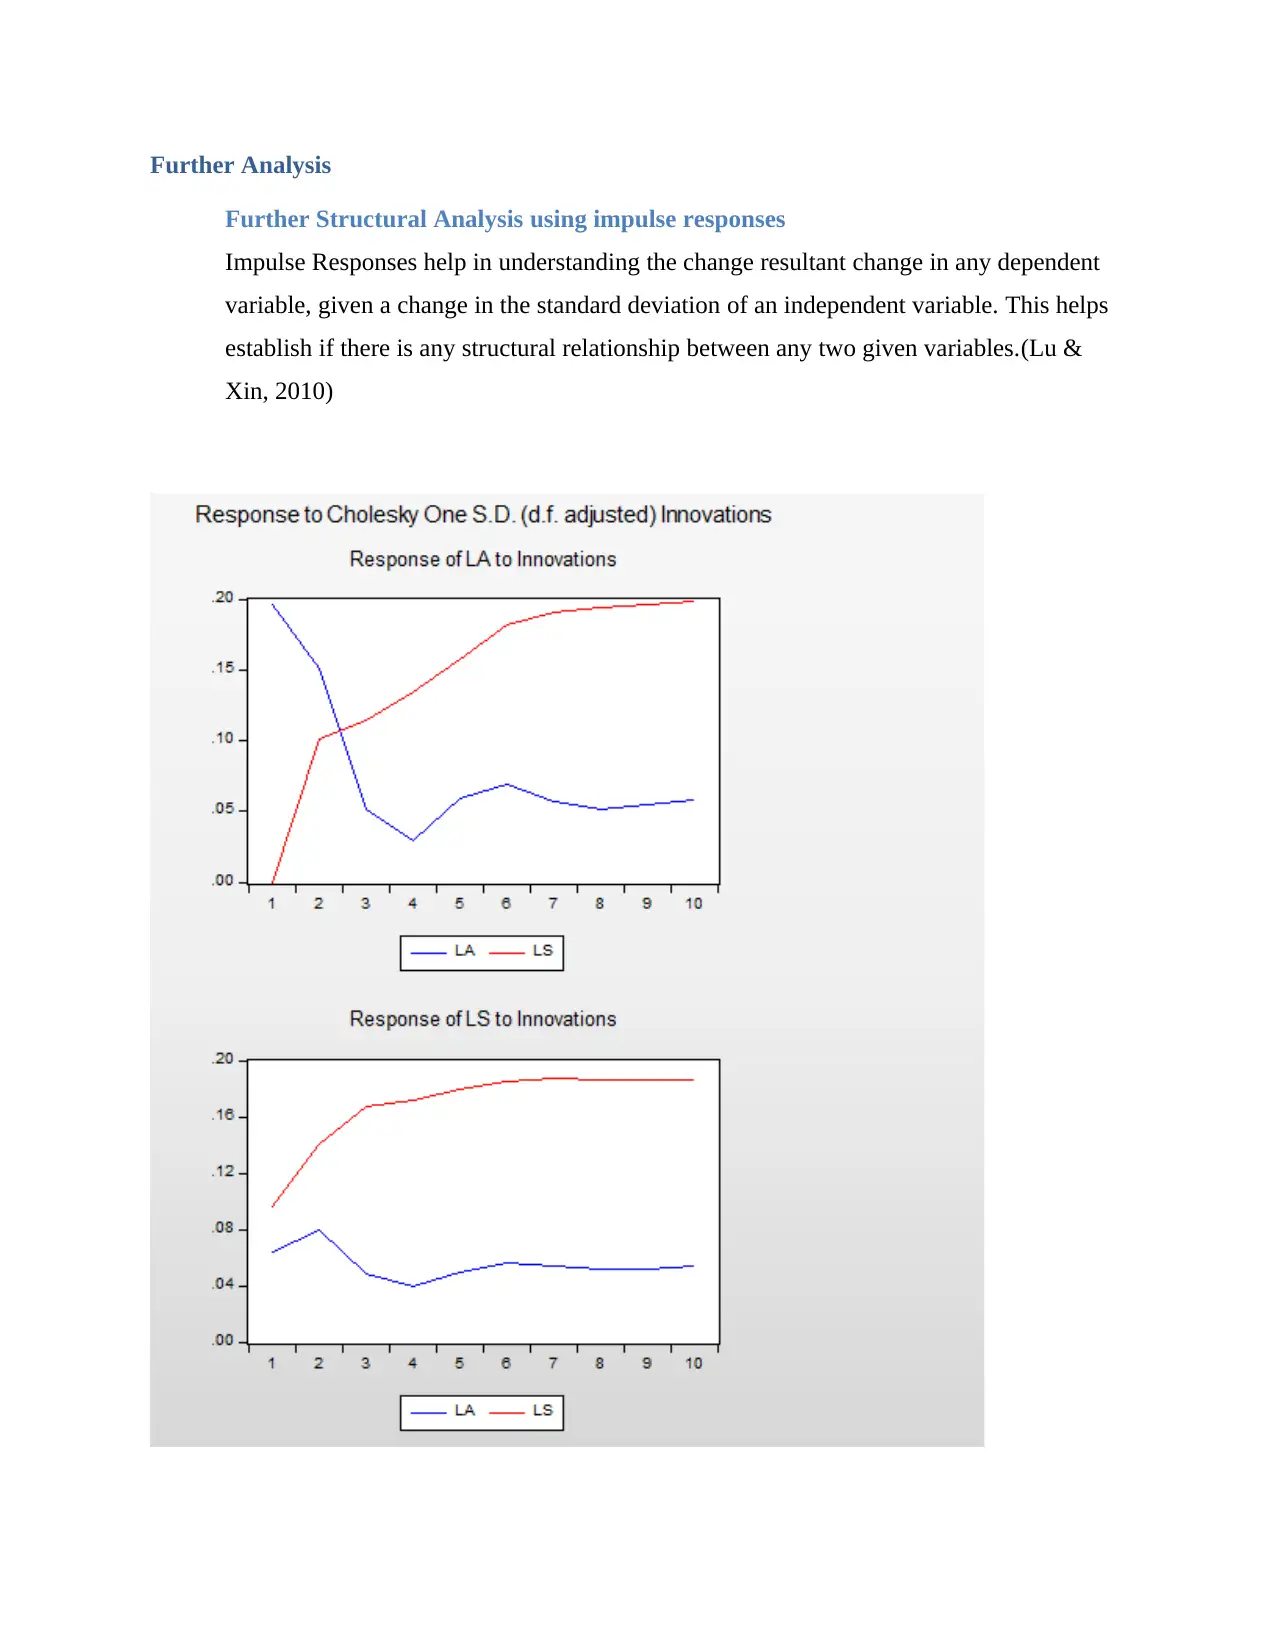
Further Structural Analysis using impulse responses
Impulse Responses help in understanding the change resultant change in any dependent
variable, given a change in the standard deviation of an independent variable. This helps
establish if there is any structural relationship between any two given variables.(Lu &
Xin, 2010)
⊘ This is a preview!⊘
Do you want full access?
Subscribe today to unlock all pages.
Trusted by 1+ million students worldwide
The plotted impulse response graph shows that for every standard deviation change in the
Logarithmic values of sales moves away further . Similarly, for every change in the standard
deviation in the logarithmic values of sales, the logarithmic values move away further. This
implies that there is a structural relationship that works both ways.
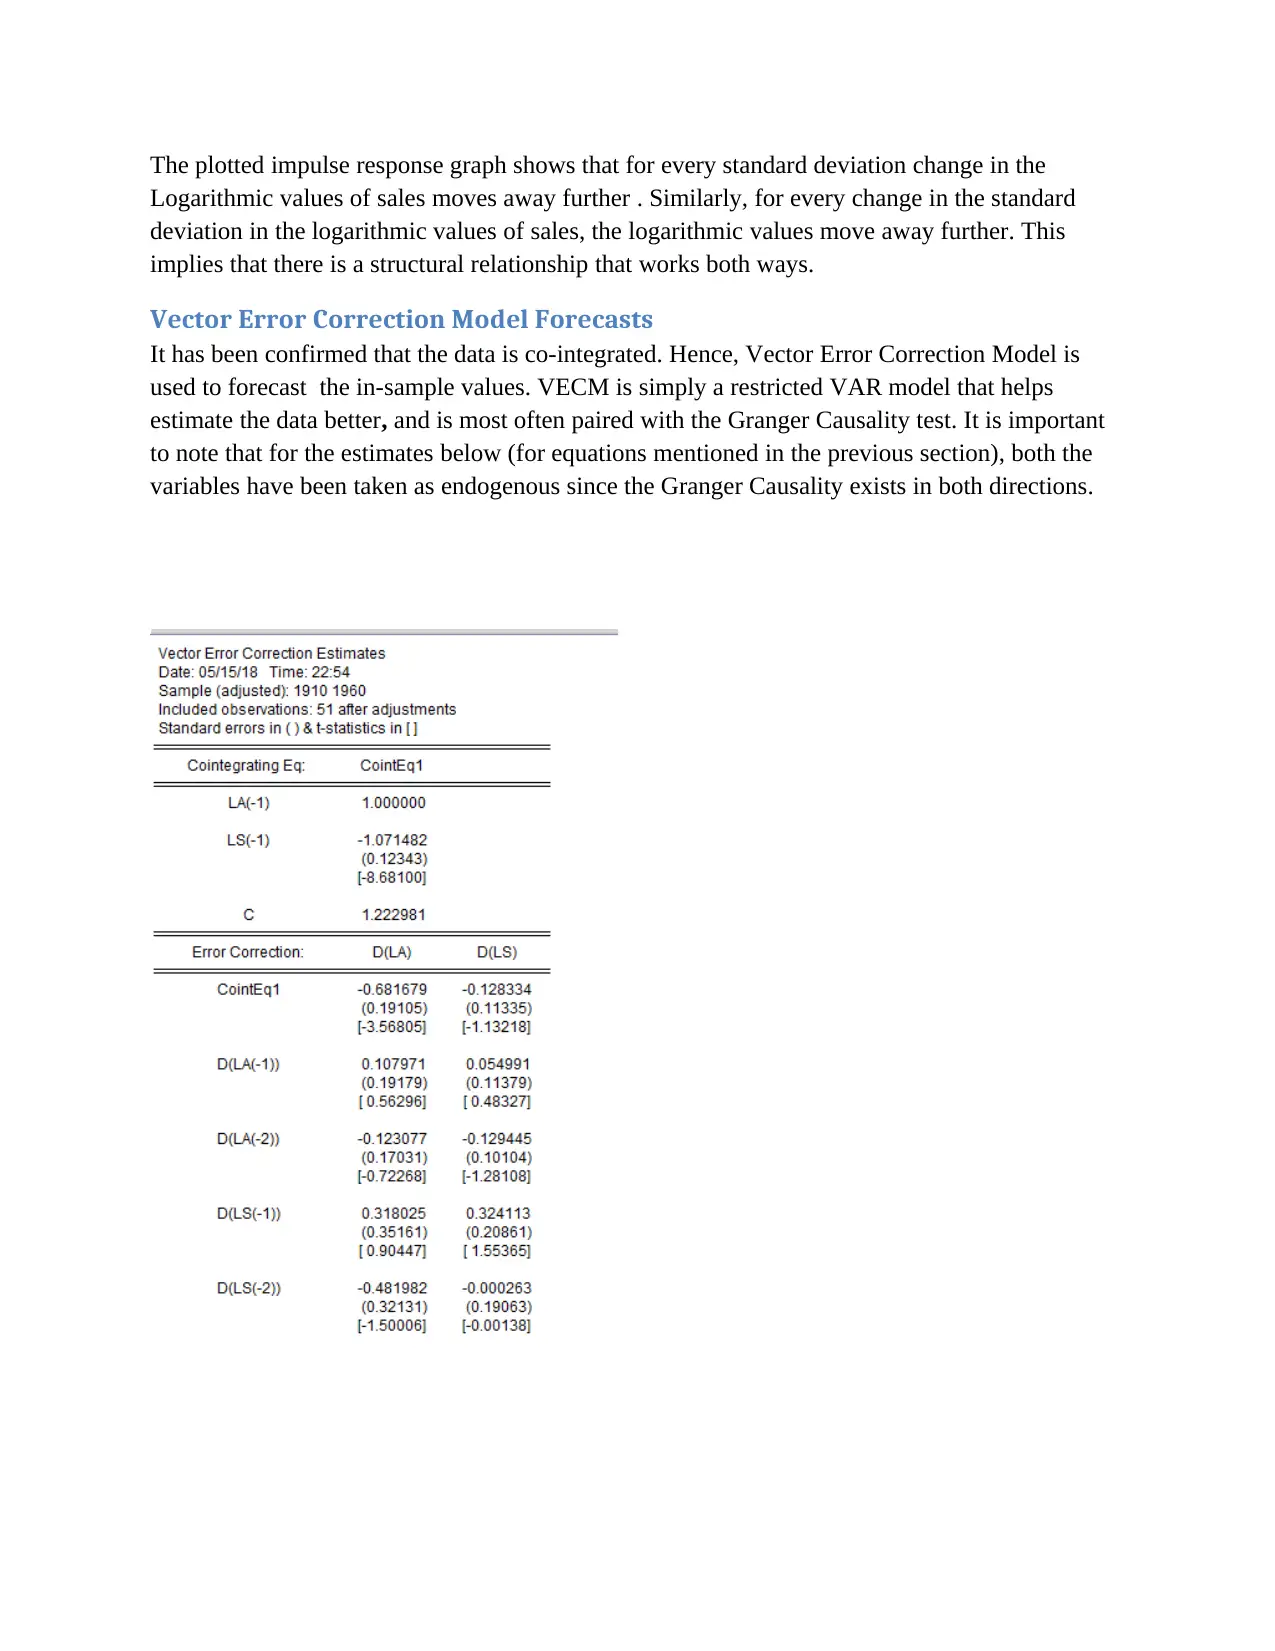
Vector Error Correction Model Forecasts
It has been confirmed that the data is co-integrated. Hence, Vector Error Correction Model is
used to forecast the in-sample values. VECM is simply a restricted VAR model that helps
estimate the data better, and is most often paired with the Granger Causality test. It is important
to note that for the estimates below (for equations mentioned in the previous section), both the
variables have been taken as endogenous since the Granger Causality exists in both directions.
Logarithmic values of sales moves away further . Similarly, for every change in the standard
deviation in the logarithmic values of sales, the logarithmic values move away further. This
implies that there is a structural relationship that works both ways.
Vector Error Correction Model Forecasts
It has been confirmed that the data is co-integrated. Hence, Vector Error Correction Model is
used to forecast the in-sample values. VECM is simply a restricted VAR model that helps
estimate the data better, and is most often paired with the Granger Causality test. It is important
to note that for the estimates below (for equations mentioned in the previous section), both the
variables have been taken as endogenous since the Granger Causality exists in both directions.
Paraphrase This Document
Need a fresh take? Get an instant paraphrase of this document with our AI Paraphraser
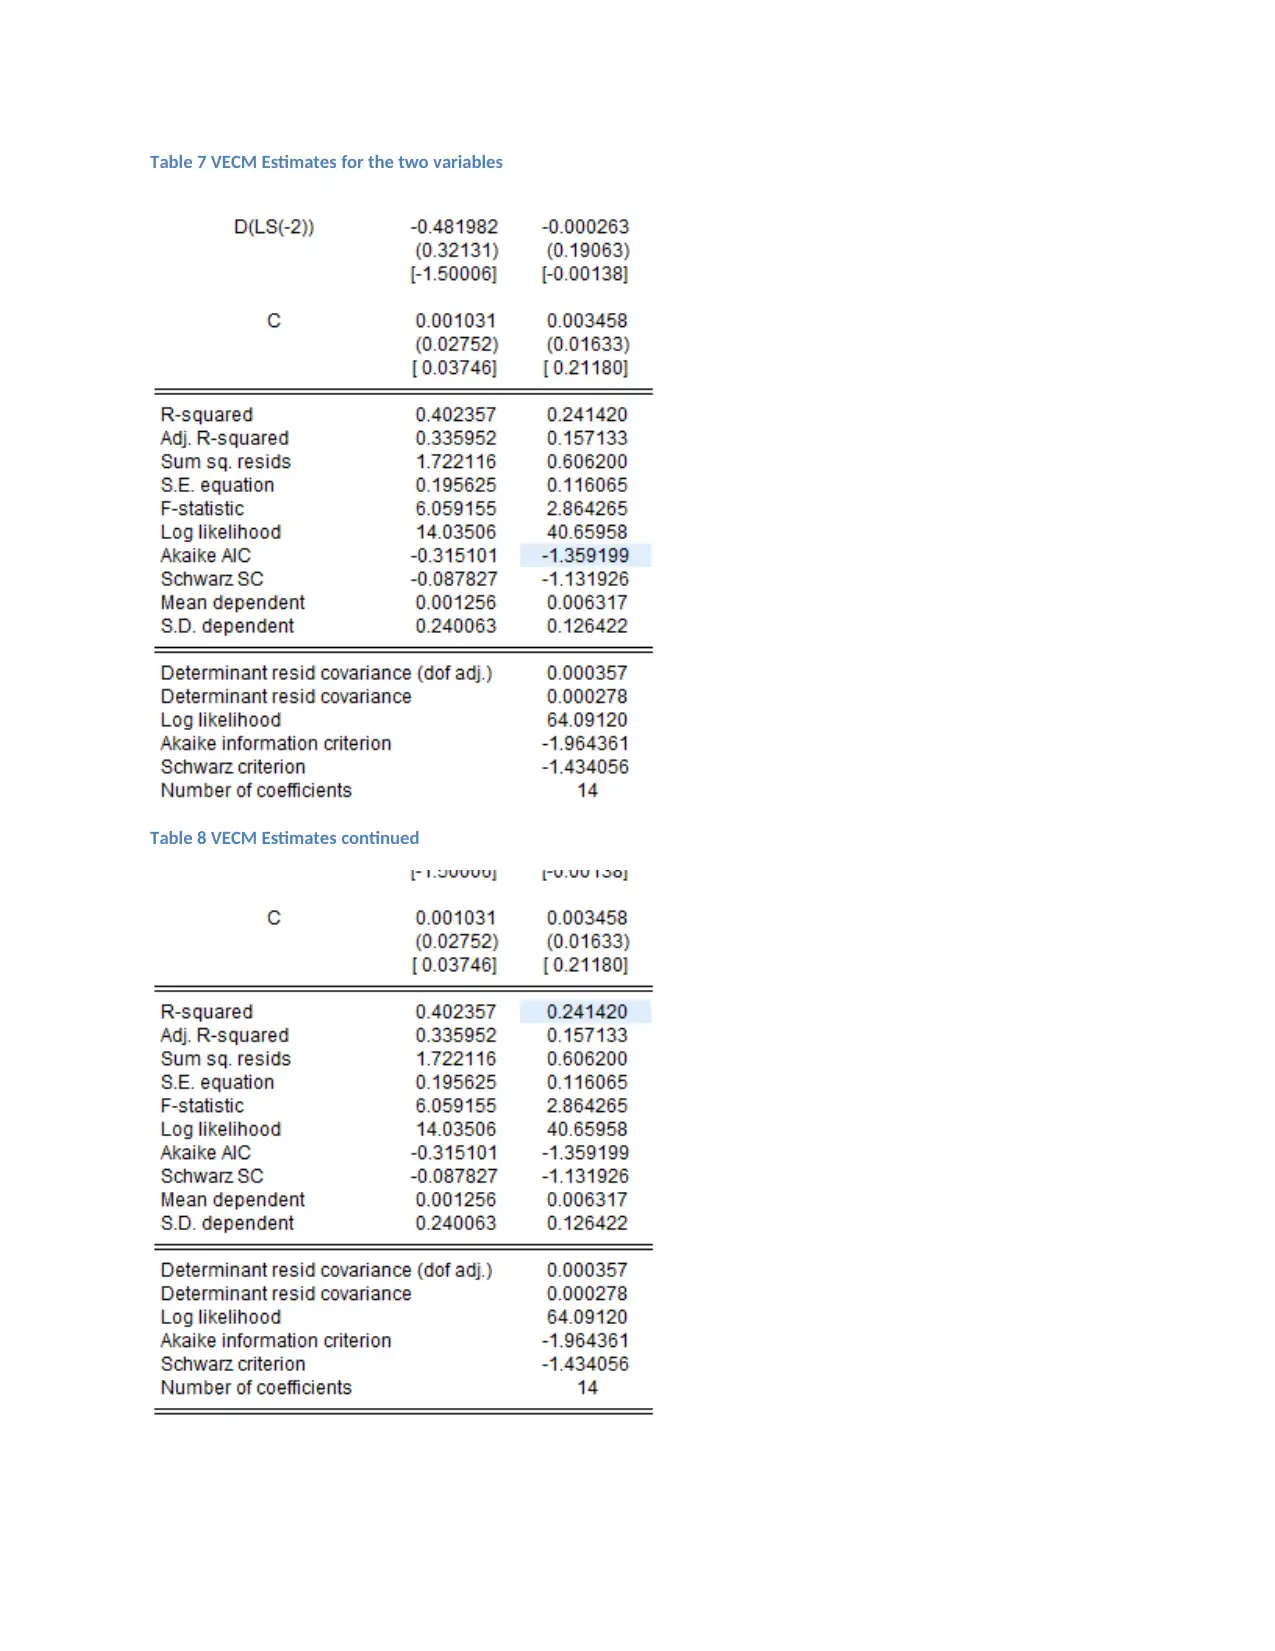
Table 7 VECM Estimates for the two variables
Table 8 VECM Estimates continued
Table 8 VECM Estimates continued

As seen above, the model is not a good fit since the R-Square is less than 0.5 I,e the model is a
weak fit. In order to improve the model , more variables must be accounted for i.e there are other
variables that cause a change in spending in advertising and sales.
Bibliography
Lu, C., & Xin, Z. (2010). Impulse-Response function Analysis: An application to macroeconomy data of
China. Hoskolan Dalarna, Sweden: School of Economics and Social Sciences, Hoskolan Dalarna.
Nielsen, H. B. (2005). Non-Stationary Time Series and Unit Root Tests. Retrieved March 29, 2018, from
http://www.econ.ku.dk/metrics/econometrics2_05_ii/slides/08_unitroottests_2pp.pdf
Sjo, B. (2008, August). Testing for Unit Roots and Cointegration -Guide. Retrieved from Research Gate:
https://www.researchgate.net/publication/265151092_Testing_for_Unit_Roots_and_Cointegra
tion_-Guide
Wooldridge, J. M. (2015). Introductory Econometrics: A Modern Approach : Sixth Edition (pg 75). online:
Cengage Learning.
Zanias, G. P. (1994). The long run, causality, and forecasting in the advertising-sales relationship. Journal
of Forecasting , 13 (7), 601 -610.
⊘ This is a preview!⊘
Do you want full access?
Subscribe today to unlock all pages.
Trusted by 1+ million students worldwide
1 out of 12
Your All-in-One AI-Powered Toolkit for Academic Success.
+13062052269
info@desklib.com
Available 24*7 on WhatsApp / Email
![[object Object]](/_next/static/media/star-bottom.7253800d.svg)
Unlock your academic potential
Copyright © 2020–2026 A2Z Services. All Rights Reserved. Developed and managed by ZUCOL.