Radiation Physics: Percentage Depth Dose Curves and Photon Relative Dose Profiles
VerifiedAdded on 2022/10/03
|14
|1547
|361
AI Summary
This document discusses the measurement of photon PDD for different conditions, electron beam PDD, and photon relative dose profiles. It also explains the effect of beam quality, energy, and field size on the depth of dose maximum, surface dose, and practical range.
Contribute Materials
Your contribution can guide someone’s learning journey. Share your
documents today.
Running head: RADIATION PHYSICS
RADIATION PHYSICS
Name of Student
Institution Affiliation
RADIATION PHYSICS
Name of Student
Institution Affiliation
Secure Best Marks with AI Grader
Need help grading? Try our AI Grader for instant feedback on your assignments.
RADIATION PHYSICS 2
Part 1: Percentage depth dose curves:
Part a: Measure a photon PDD under the following conditions:
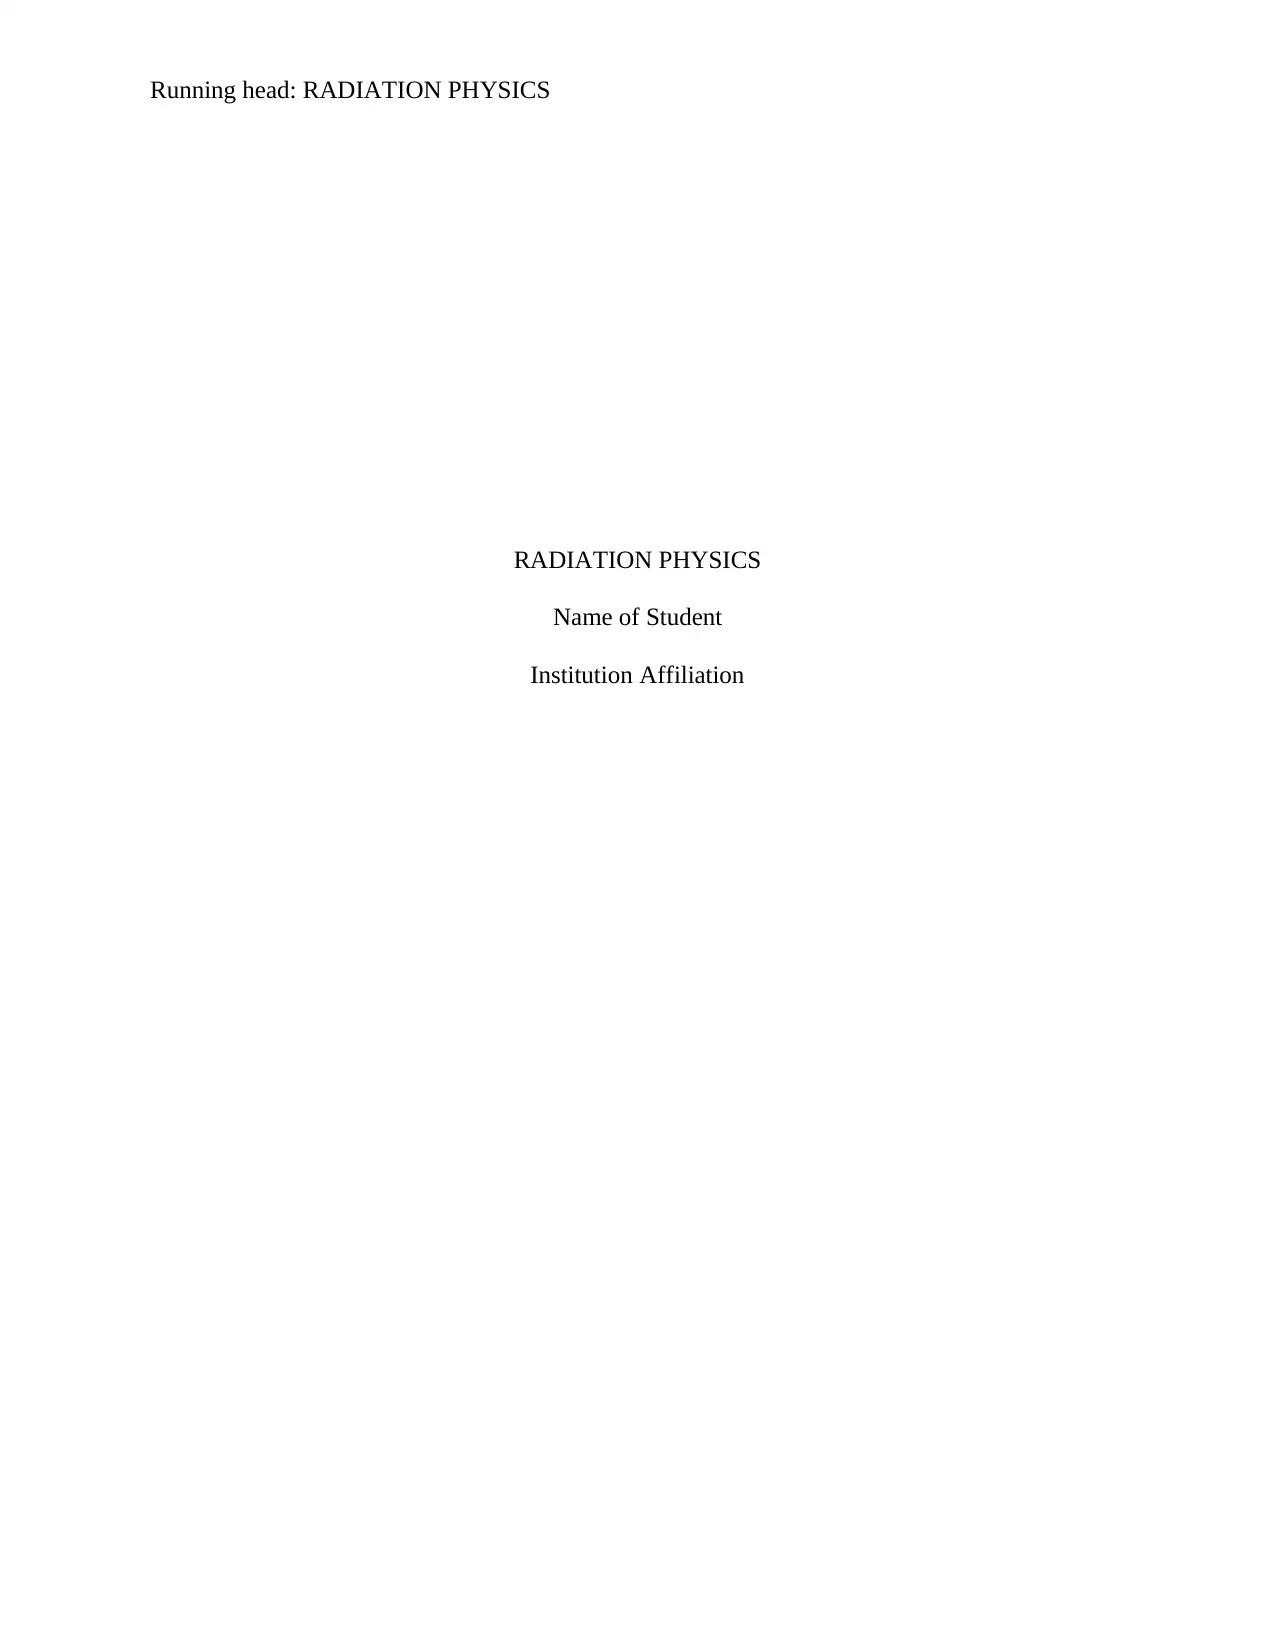
Graph of - 6 MV, SSD = 100cm, Field size = 10x10cm
Part 1: Percentage depth dose curves:
Part a: Measure a photon PDD under the following conditions:
Graph of - 6 MV, SSD = 100cm, Field size = 10x10cm
RADIATION PHYSICS 3
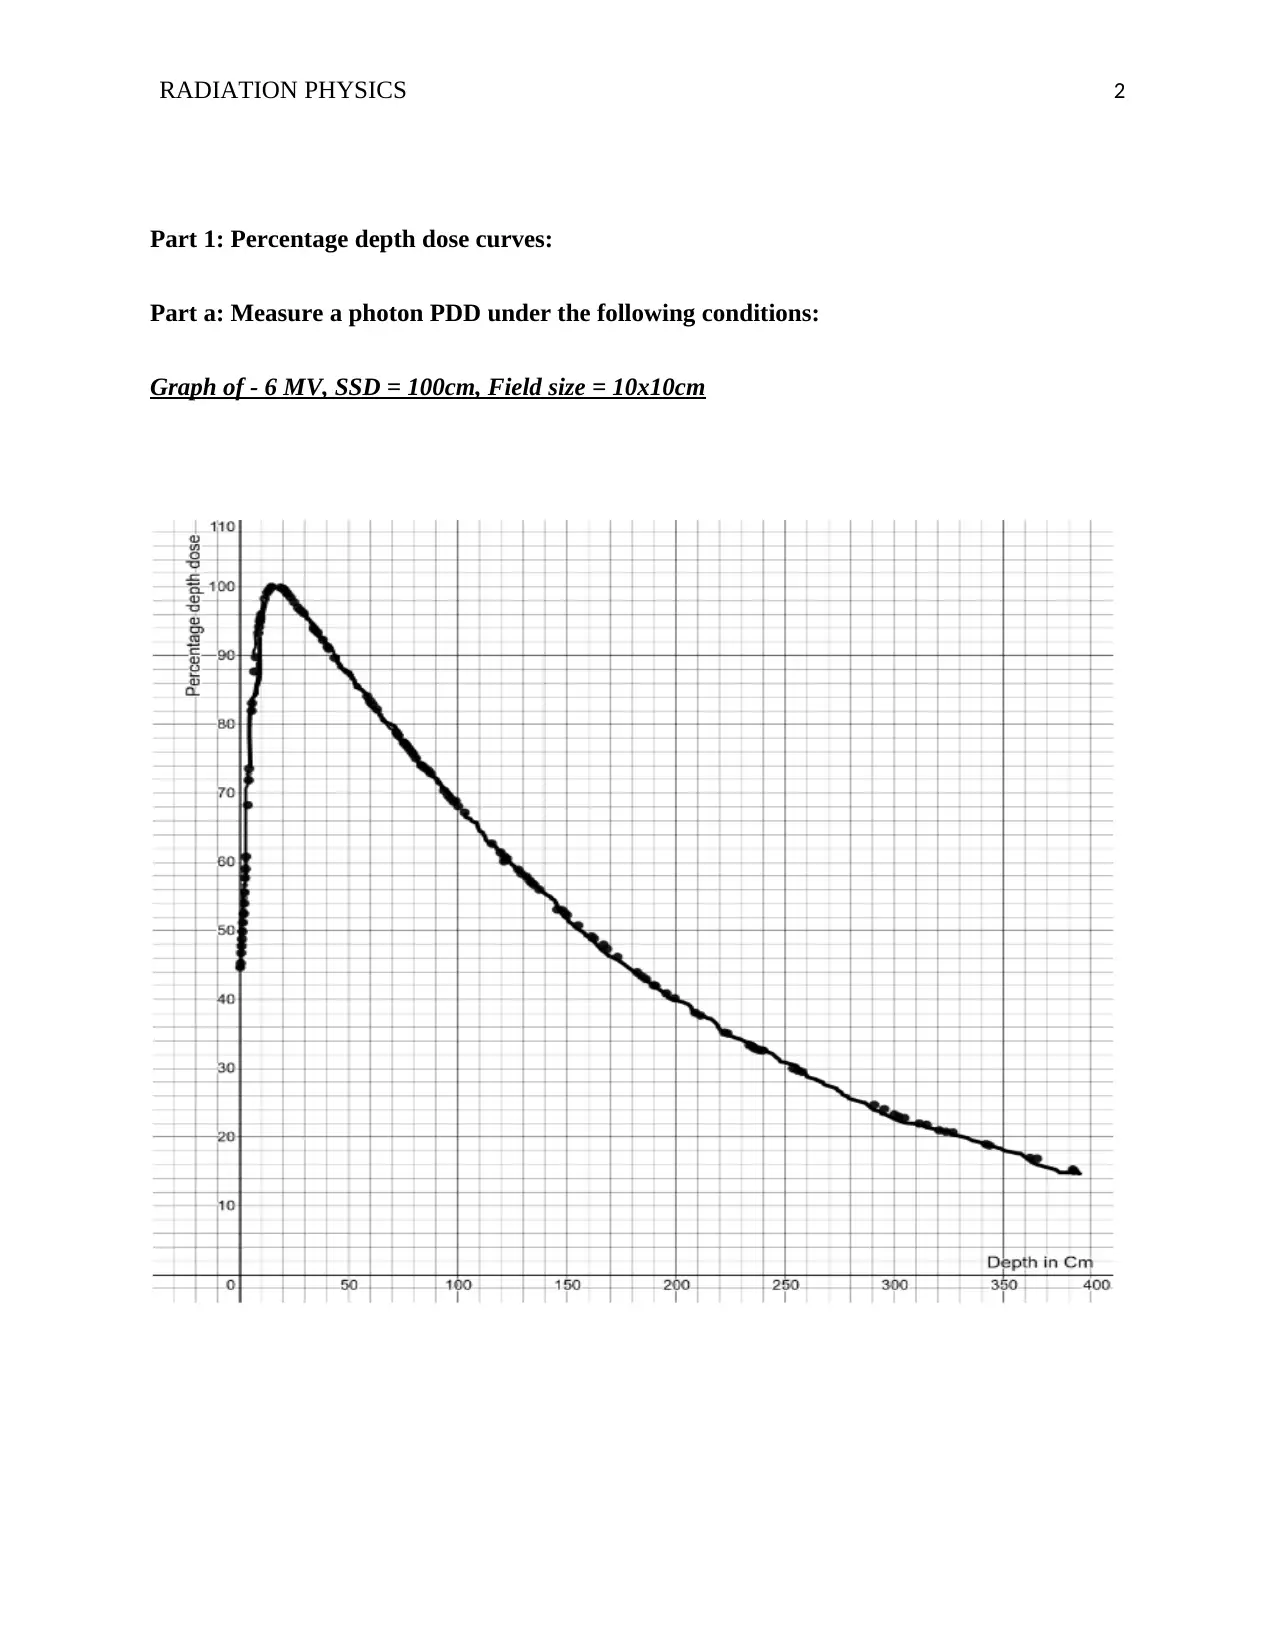
Graph of -10 MV, SSD = 100cm, Field size = 10 x 10
Graph of -10 MV, SSD = 100cm, Field size = 10 x 10
RADIATION PHYSICS 4
The above graphs plotted have a very small build-up region showing that for both 6Mv and 10
Mv. Their build-up is faster, it takes both to reach the maximum dose from the skin to the depth
at the maximum (D max). But from the two graphs above 10 MV had a depth max as compared
to the 6 MV as it can be seen from the graphs that 6MV had a bigger depth max as compared to
10MV which had approximately 310 as compared to the 6MV which had about 400 cm (Poppe,
2017). The surface dose for the 6MV graph is bigger as it moves from 100 (top) to around 14
percentage depth dose. But for the 10 MV the surface dose moves from 100 (top) to 23
percentage depth dose (Fletcher, 2018). The curves of both graphs increase to a maximum and
then die exponentially to a given value of the field size depending on the Megavoltage supplied
(Andrews, 2017)).
Beam quality is the overall energy and its power of penetration. The shorter the
wavelength/energy the high quality of the beam (Clarkson, 2011)
For 6MV
It is 385
For 10MV
It is 310
It hence shows that 10MV had a better beam quality than 6MV and this is due to the difference
in the supplied voltage.
b) Measure a photon PDD for a small and large field;
Graph of - 10 MV, SSD = 100cm, Field size = 4x4cm
Secure Best Marks with AI Grader
Need help grading? Try our AI Grader for instant feedback on your assignments.
RADIATION PHYSICS 5
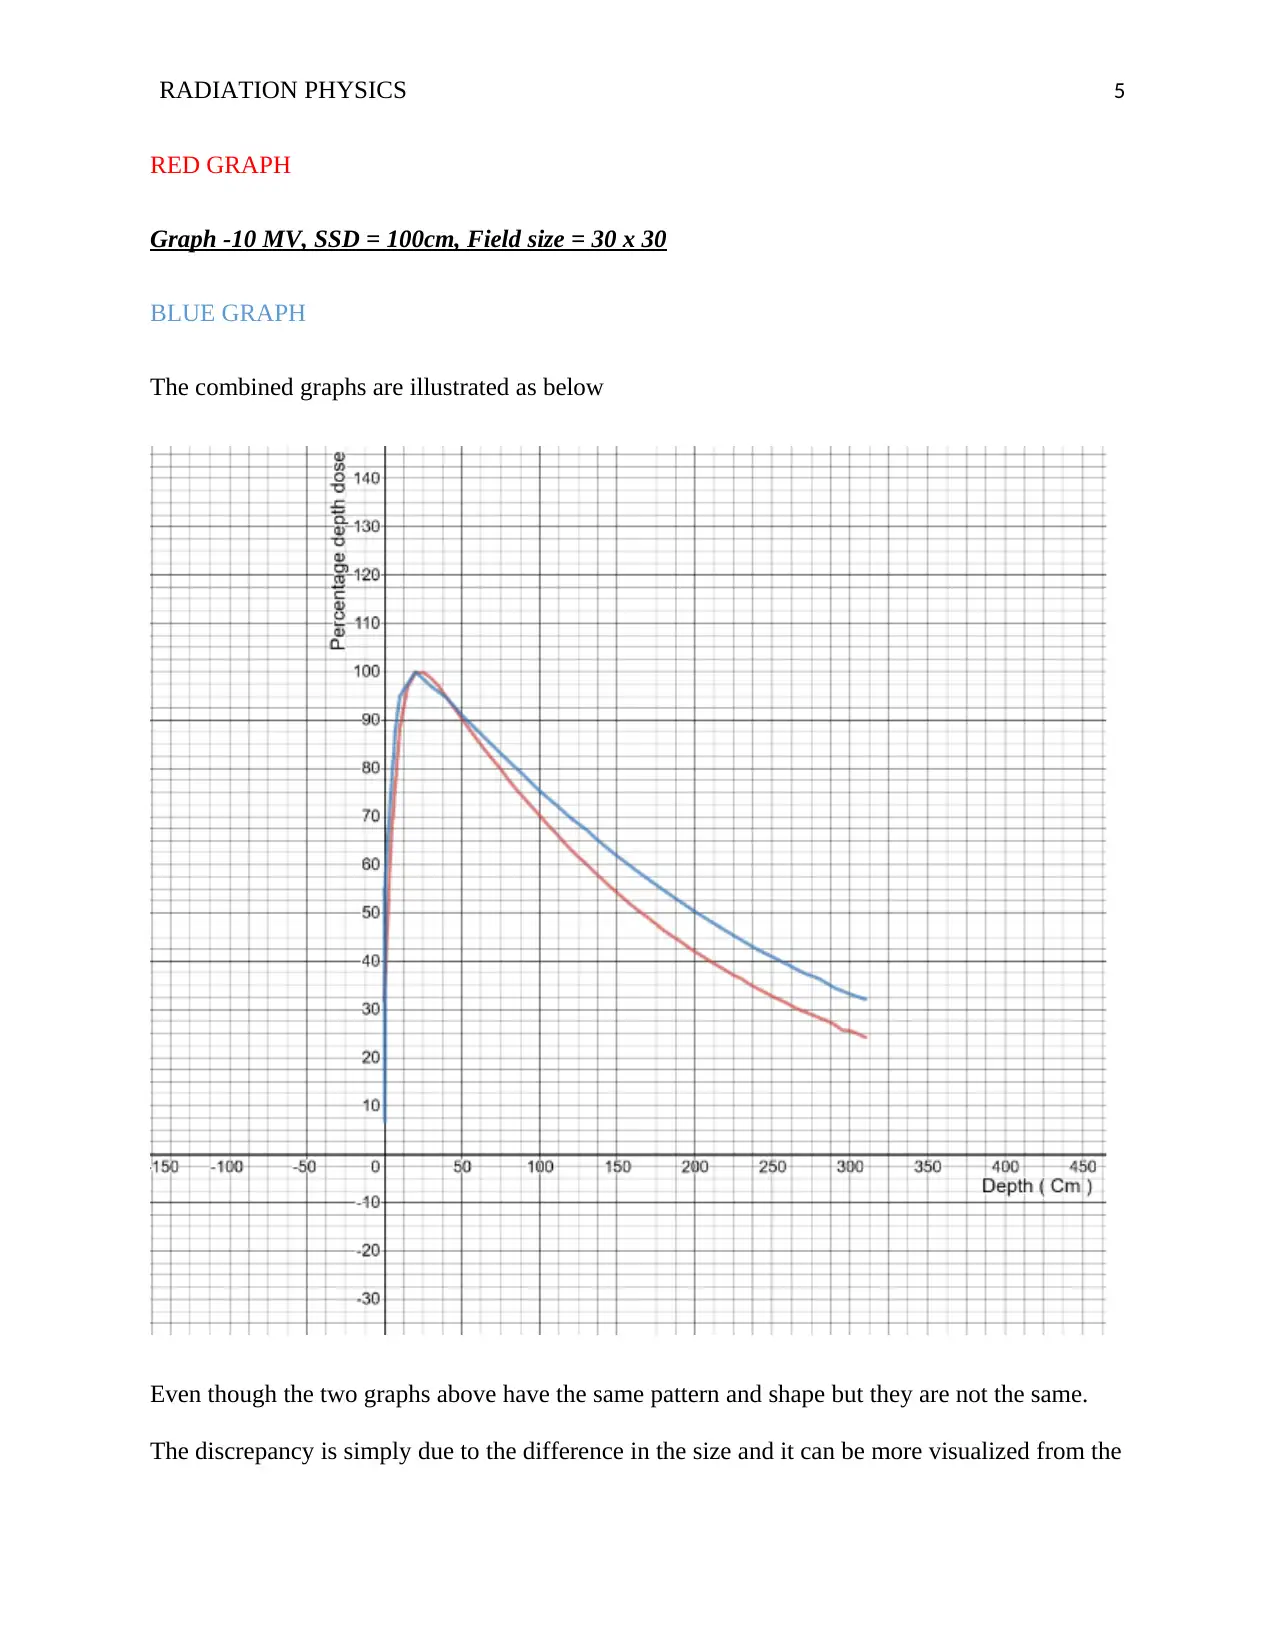
RED GRAPH
Graph -10 MV, SSD = 100cm, Field size = 30 x 30
BLUE GRAPH
The combined graphs are illustrated as below
Even though the two graphs above have the same pattern and shape but they are not the same.
The discrepancy is simply due to the difference in the size and it can be more visualized from the
RADIATION PHYSICS 6
graph where the red graph has a smaller field size as compared to the blue graph (McNally,
2019). The same is evident in the values of the field sizes given where the red had 4x4cm while
the blue has 30x30cm.
c) Measure electron beam PDD’s for the following:
Graph of - 6 MeV, 10 x 10 Applicator, 100cm SSD
RED GRAPH
Graph of - 12 MeV, 10 x 10 Applicator, 100cm SSD
BLACK GRAPH
Graph of - 18 MeV, 10 x 10 Applicator, 100cm SSD
GREEN GRAPH
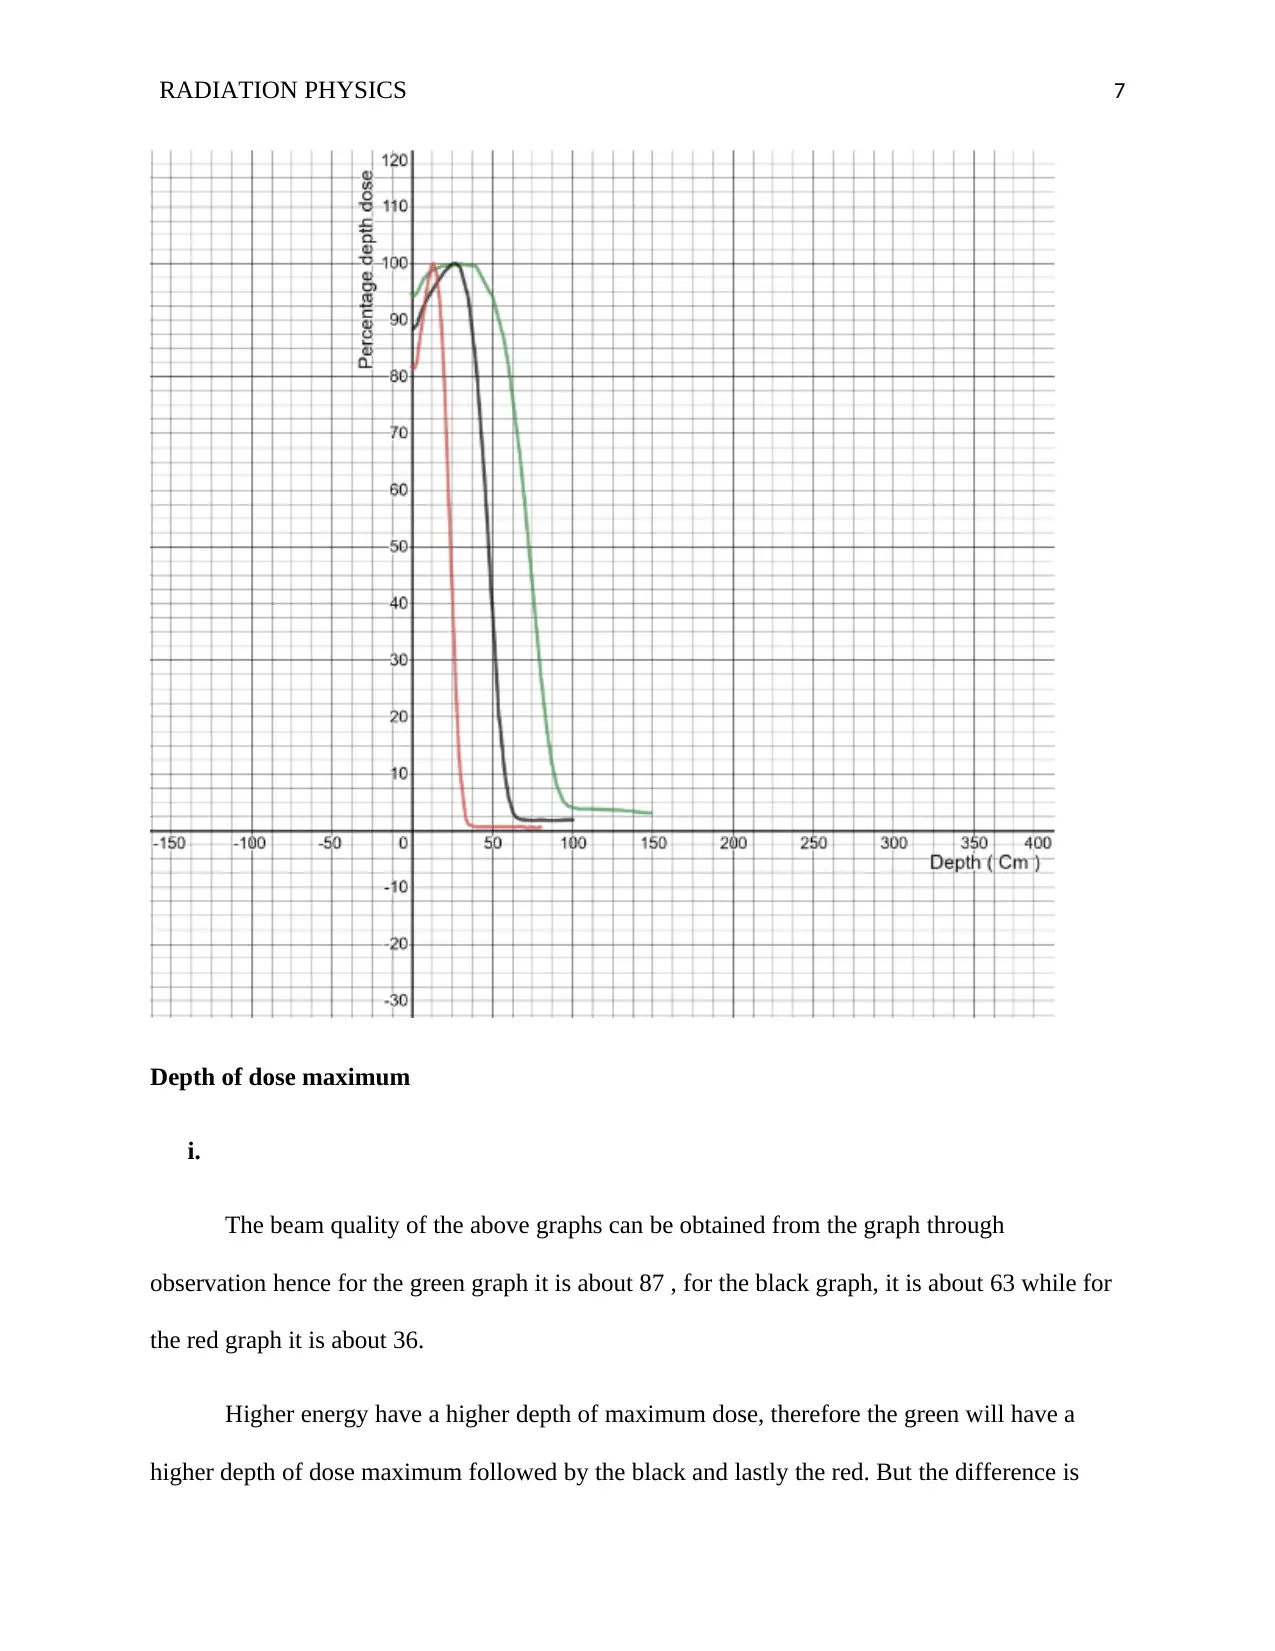
The combine graphs are illustrated as in the diagram below;
graph where the red graph has a smaller field size as compared to the blue graph (McNally,
2019). The same is evident in the values of the field sizes given where the red had 4x4cm while
the blue has 30x30cm.
c) Measure electron beam PDD’s for the following:
Graph of - 6 MeV, 10 x 10 Applicator, 100cm SSD
RED GRAPH
Graph of - 12 MeV, 10 x 10 Applicator, 100cm SSD
BLACK GRAPH
Graph of - 18 MeV, 10 x 10 Applicator, 100cm SSD
GREEN GRAPH
The combine graphs are illustrated as in the diagram below;
RADIATION PHYSICS 7
Depth of dose maximum
i.
The beam quality of the above graphs can be obtained from the graph through
observation hence for the green graph it is about 87 , for the black graph, it is about 63 while for
the red graph it is about 36.
Higher energy have a higher depth of maximum dose, therefore the green will have a
higher depth of dose maximum followed by the black and lastly the red. But the difference is
Paraphrase This Document
Need a fresh take? Get an instant paraphrase of this document with our AI Paraphraser
RADIATION PHYSICS 8
slight from the sight (Lax, 2013). The transferred energy from photons is directly ionizing the
electrons, hence the maximum surface reduces the depth because of a decreased in the energy of
photons. And this will make the production of electrons to reduce with depth (McIntyre, 2018).
Surface dose
The surface dose for the graph given above also depends on the energy, the more energy
the higher the surface dose. Therefore green which has more energy has the biggest surface dose
followed by the black and then red.
The practical range
The practical range also is affected by the energy supplied to the beams. Therefore from
the data given and also can be confirmed from the graph that the practical range is higher in blue
graph followed by the black range and least in the red graph due to their difference in the energy
supplied to each and other factors were held constant (Snyder,2015).
ii.
The graph with relatively higher energy has a bigger depth, bigger surface area, bigger
practical range and bigger depth of dose maximum as in the graph above. This is because when
there is a lot of energy supplied to a beam there will be relatively a lot of electrons that will be
pushed by the supplied energy and make a deeper penetration into the skin. And from the graph
when the penetration depth is higher surface dose will also be higher as well as the practical
range (Rogers, 2016). The depth of dose maximum will be higher when the supplied energy is
higher.
iii.
RADIATION PHYSICS 9
Beam quality is the overall energy and its power of penetration. The shorter the
wavelength/energy the high the quality of the beam.
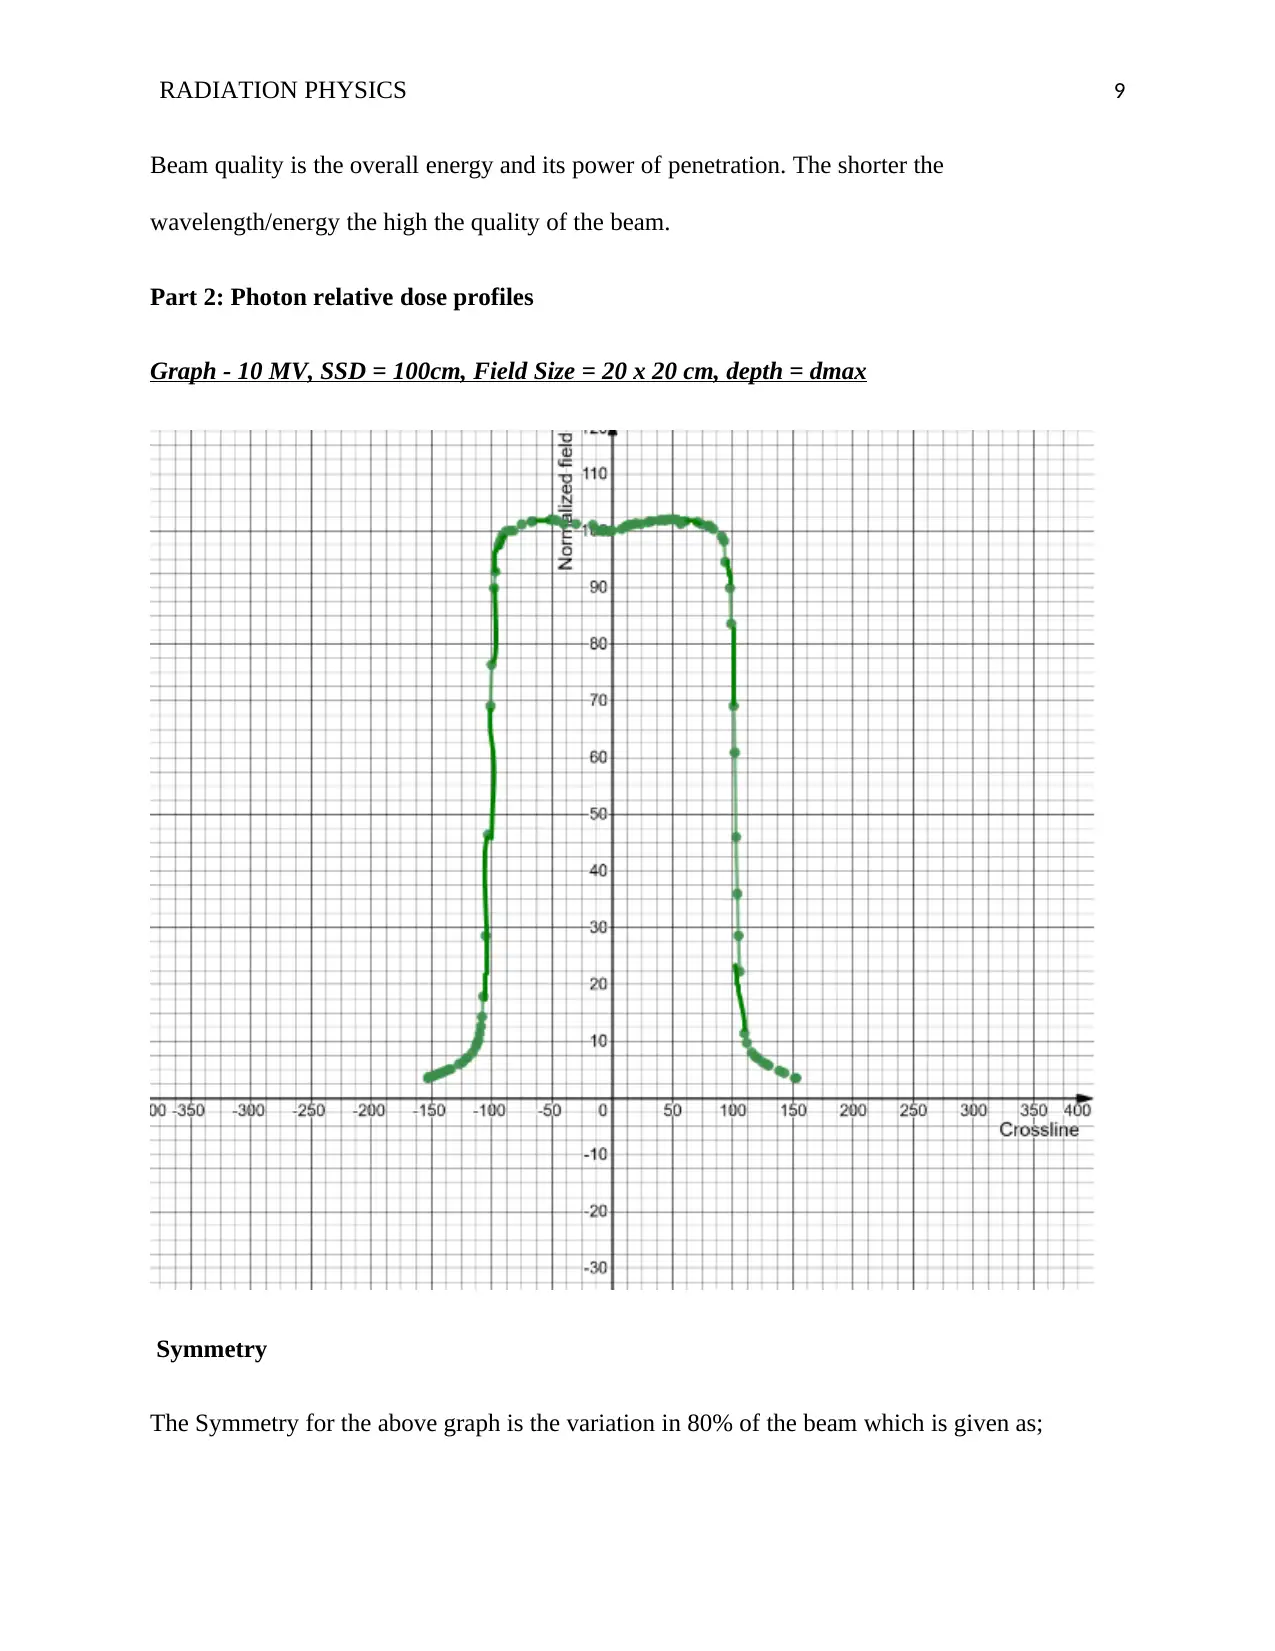
Part 2: Photon relative dose profiles
Graph - 10 MV, SSD = 100cm, Field Size = 20 x 20 cm, depth = dmax
Symmetry
The Symmetry for the above graph is the variation in 80% of the beam which is given as;
Beam quality is the overall energy and its power of penetration. The shorter the
wavelength/energy the high the quality of the beam.
Part 2: Photon relative dose profiles
Graph - 10 MV, SSD = 100cm, Field Size = 20 x 20 cm, depth = dmax
Symmetry
The Symmetry for the above graph is the variation in 80% of the beam which is given as;
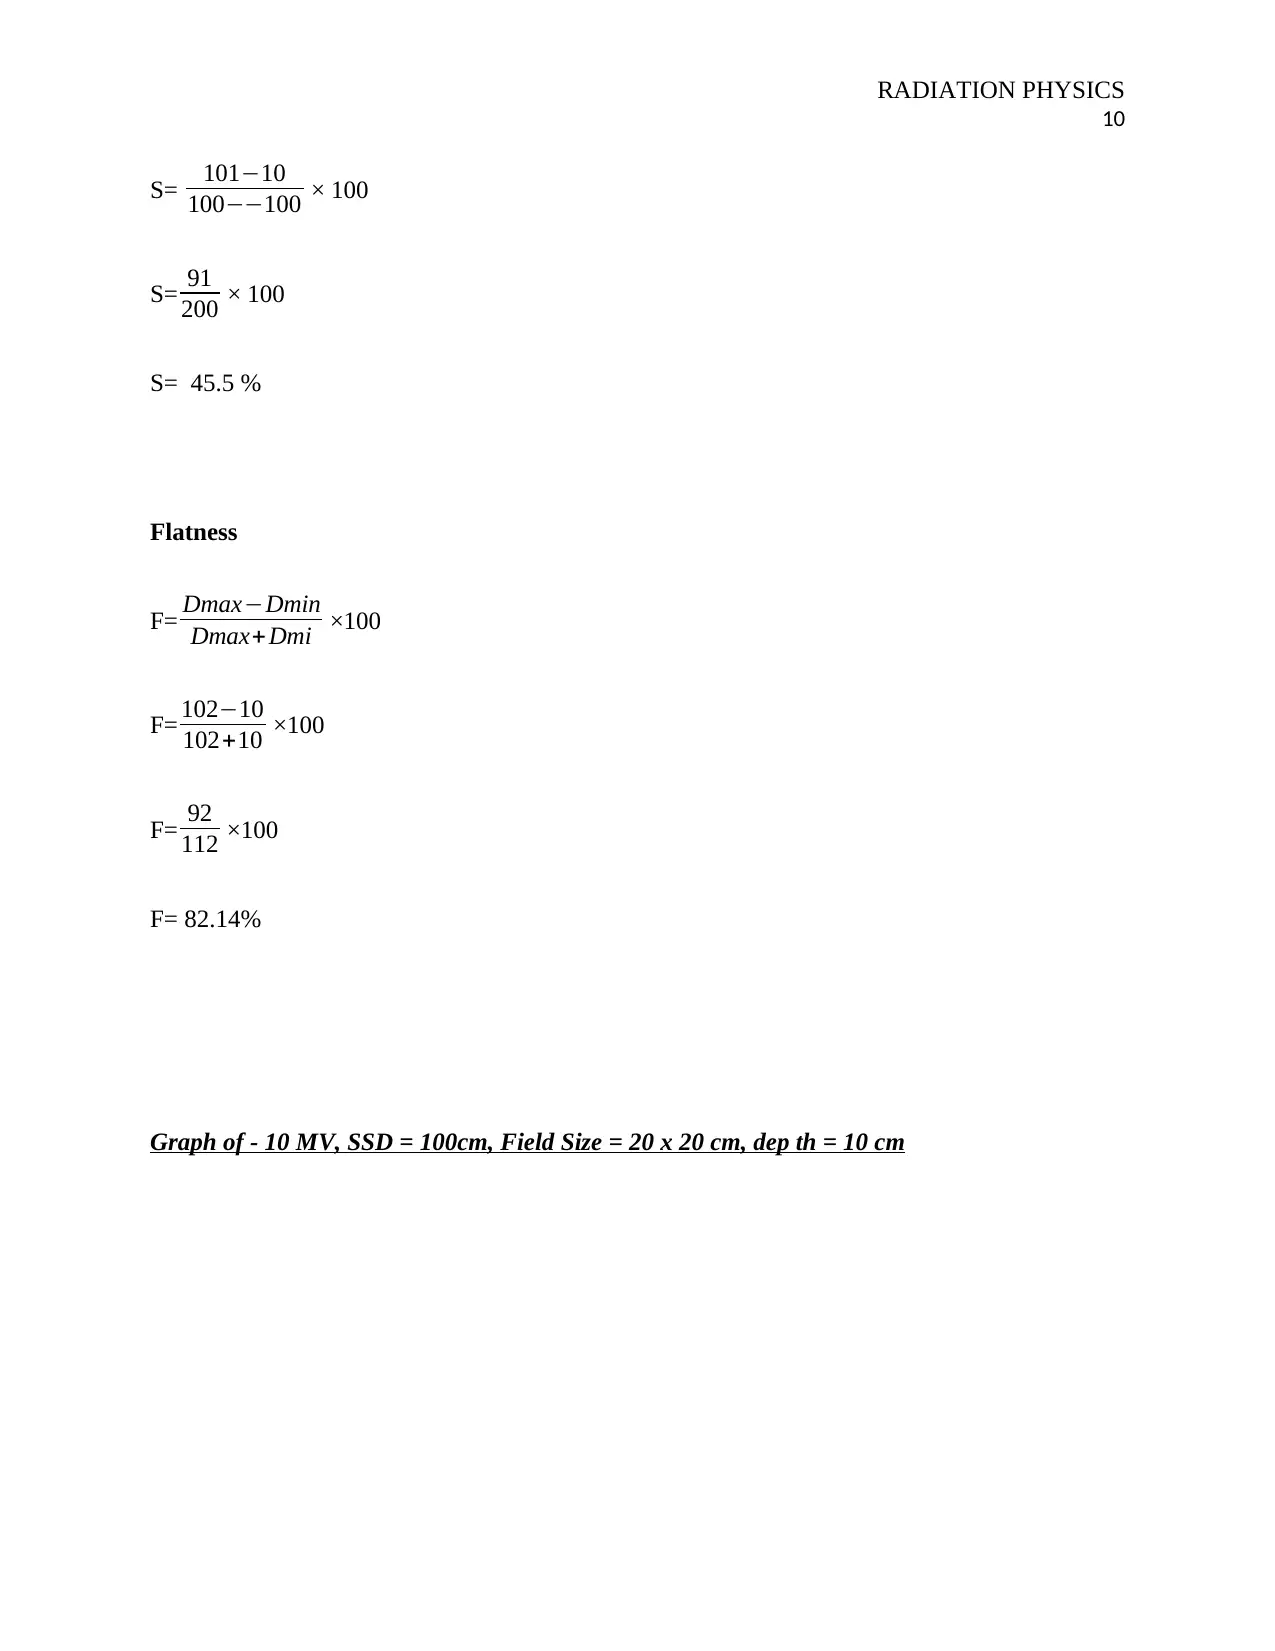
RADIATION PHYSICS
10
S= 101−10
100−−100 × 100
S= 91
200 × 100
S= 45.5 %
Flatness
F= Dmax−Dmin
Dmax+Dmi ×100
F= 102−10
102+10 ×100
F= 92
112 ×100
F= 82.14%
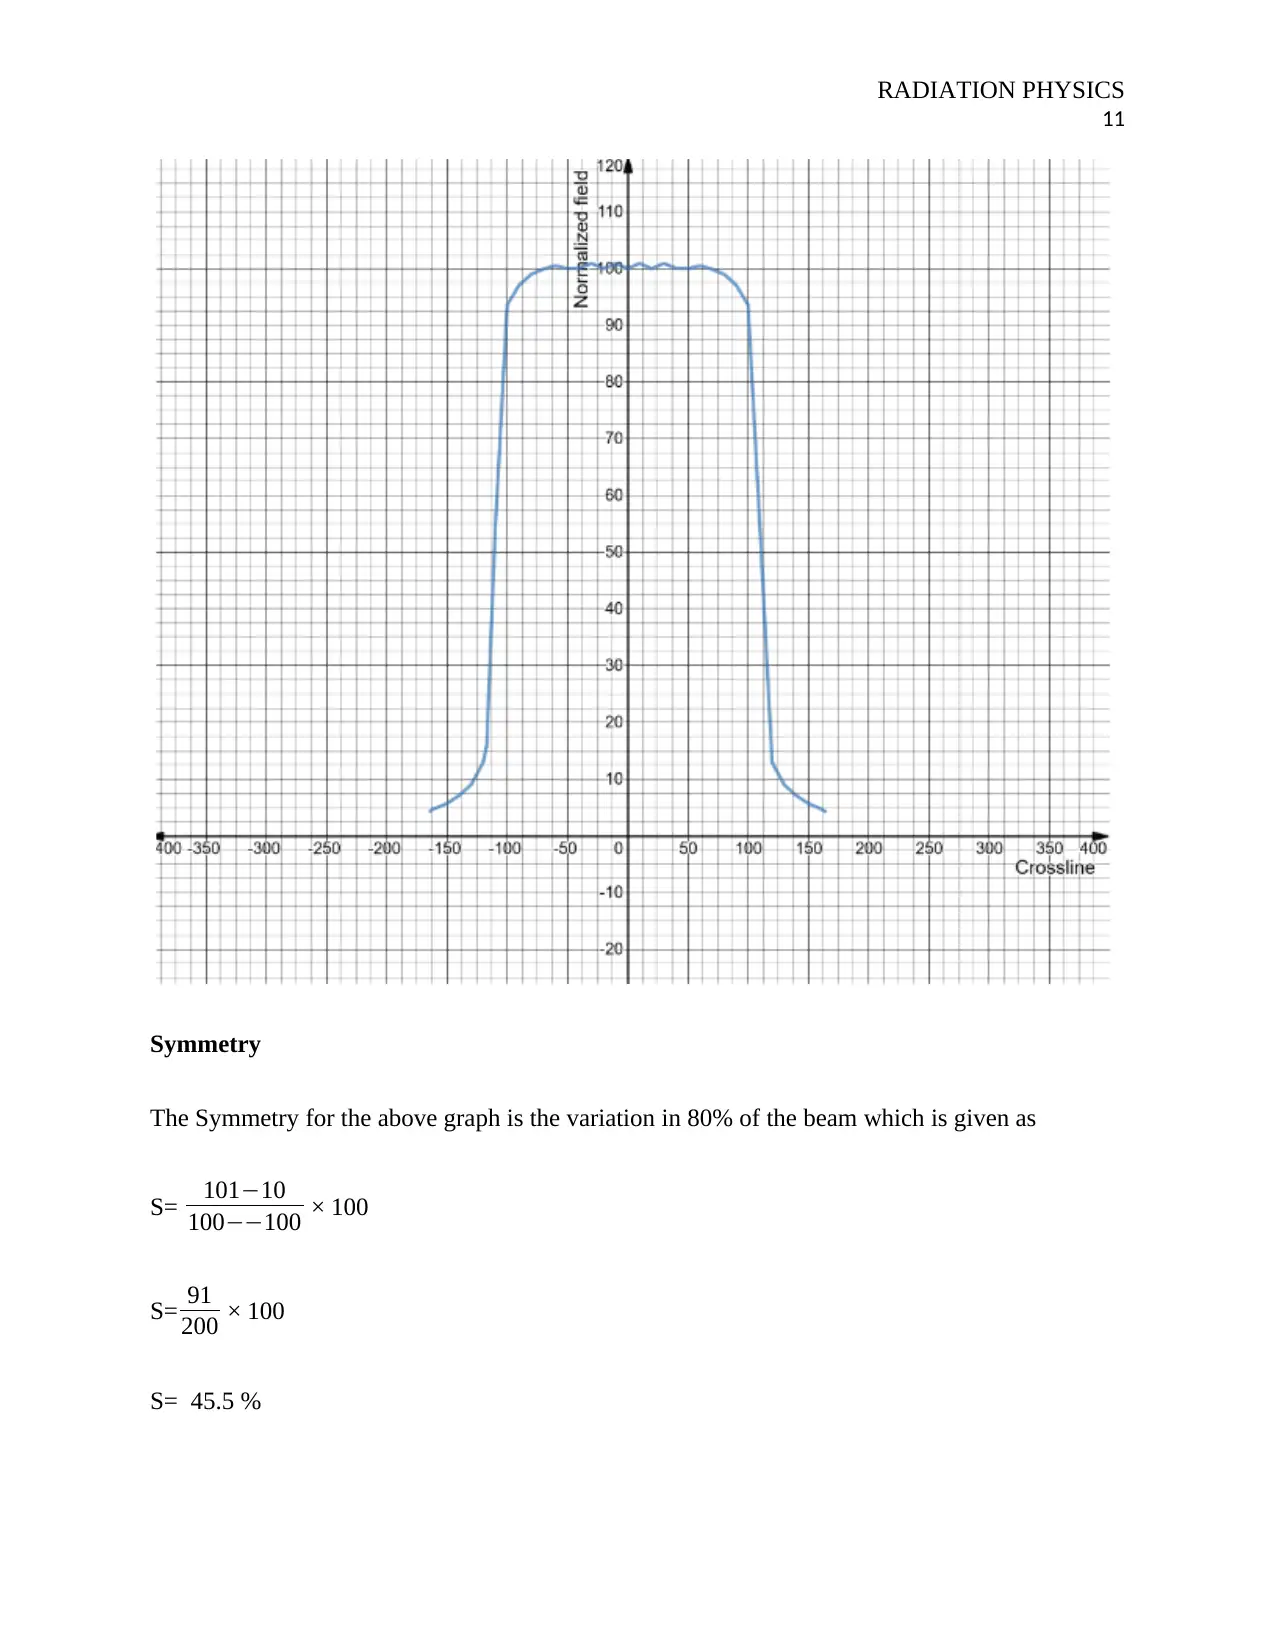
Graph of - 10 MV, SSD = 100cm, Field Size = 20 x 20 cm, dep th = 10 cm
10
S= 101−10
100−−100 × 100
S= 91
200 × 100
S= 45.5 %
Flatness
F= Dmax−Dmin
Dmax+Dmi ×100
F= 102−10
102+10 ×100
F= 92
112 ×100
F= 82.14%
Graph of - 10 MV, SSD = 100cm, Field Size = 20 x 20 cm, dep th = 10 cm
Secure Best Marks with AI Grader
Need help grading? Try our AI Grader for instant feedback on your assignments.
RADIATION PHYSICS
11
Symmetry
The Symmetry for the above graph is the variation in 80% of the beam which is given as
S= 101−10
100−−100 × 100
S= 91
200 × 100
S= 45.5 %
11
Symmetry
The Symmetry for the above graph is the variation in 80% of the beam which is given as
S= 101−10
100−−100 × 100
S= 91
200 × 100
S= 45.5 %
RADIATION PHYSICS
12
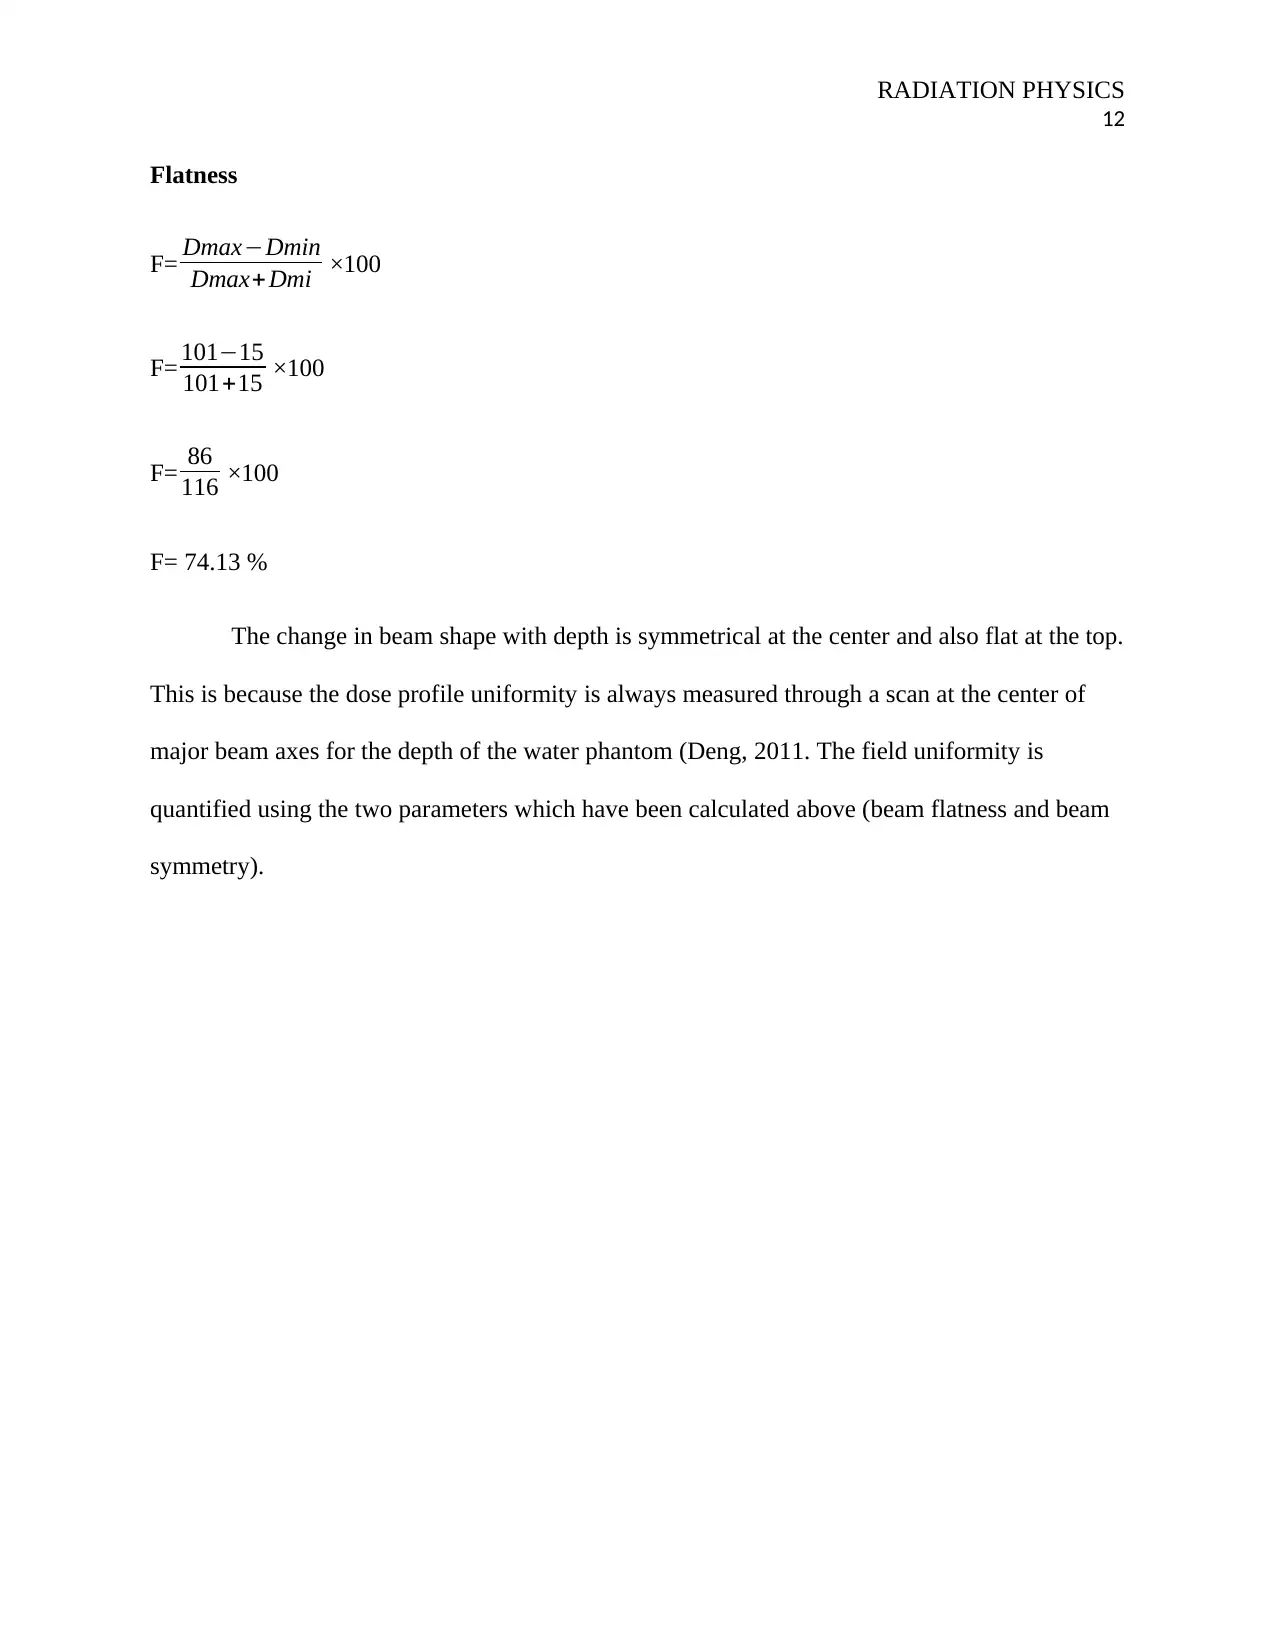
Flatness
F= Dmax−Dmin
Dmax+Dmi ×100
F= 101−15
101+15 ×100
F= 86
116 ×100
F= 74.13 %
The change in beam shape with depth is symmetrical at the center and also flat at the top.
This is because the dose profile uniformity is always measured through a scan at the center of
major beam axes for the depth of the water phantom (Deng, 2011. The field uniformity is
quantified using the two parameters which have been calculated above (beam flatness and beam
symmetry).
12
Flatness
F= Dmax−Dmin
Dmax+Dmi ×100
F= 101−15
101+15 ×100
F= 86
116 ×100
F= 74.13 %
The change in beam shape with depth is symmetrical at the center and also flat at the top.
This is because the dose profile uniformity is always measured through a scan at the center of
major beam axes for the depth of the water phantom (Deng, 2011. The field uniformity is
quantified using the two parameters which have been calculated above (beam flatness and beam
symmetry).
RADIATION PHYSICS
13
References
Andrews, H. L., Murphy, R. E., & LeBrun, E. J. (2017). Gel dosimeter for depth‐dose
measurements. Review of scientific instruments, 28(5), 329-332.
Clarkson, J. R. (2011). A note on depth doses in fields of irregular shape. The British Journal of
Radiology, 14(164), 265-268.
Deng, J., Jiang, S. B., Pawlicki, T., Li, J., & Ma, C. M. (2011). Derivation of electron and photon
energy spectra from electron beam central axis depth dose curves. Physics in Medicine &
Biology, 46(5), 1429.
Fletcher, C. L., & Mills, J. A. (2018). An assessment of GafChromic film for measuring 50 kV
and 100 kV percentage depth dose curves. Physics in Medicine & Biology, 53(11), N209.
Lax, I. N. G. M. A. R., Brahme, A. N. D. E. R. S., & Andreo, P. E. D. R. O. (2013). Electron
beam dose planning using Gaussian beams. Improved radial dose profiles. Acta radiologica.
Supplementum, 364, 49-59.
McIntyre, R. D., & Turnbull, W. G. (2018). Improvement of linear accelerator depth‐dose
curves. Medical physics, 5(6), 518-524.
McNally, N. J., & Bewley, D. K. (2019). A biological dosimeter using mammalian cells in tissue
culture and its use in obtaining neutron depth dose curves. The British journal of radiology,
42(496), 289-294.
Paraphrase This Document
Need a fresh take? Get an instant paraphrase of this document with our AI Paraphraser
RADIATION PHYSICS
14
Poppe, B., Chofor, N., Rühmann, A., Kunth, W., Djouguela, A., Kollhoff, R., & Willborn, K. C.
(2017). The effect of a carbon-fiber couch on the depth-dose curves and transmission properties
for megavoltage photon beams. Strahlentherapie und Onkologie, 183(1), 43-48.
Rogers, D. W. O., & Bielajew, A. F. (2016). Differences in electron depth‐dose curves calculated
with EGS and ETRAN and improved energy‐range relationships. Medical physics, 13(5), 687-
694.
Snyder, W. S., & Neufeld, J. (2015). Calculated depth dose curves in tissue for broad beams of
fast neutrons. The British journal of radiology, 28(331), 342-350.
1 out of 14
Your All-in-One AI-Powered Toolkit for Academic Success.
+13062052269
info@desklib.com
Available 24*7 on WhatsApp / Email
![[object Object]](/_next/static/media/star-bottom.7253800d.svg)
Unlock your academic potential
© 2024 | Zucol Services PVT LTD | All rights reserved.