Deterioration Modelling of Railway Infrastructure in Australia
VerifiedAdded on 2023/06/03
|22
|5620
|459
Project
AI Summary
This project focuses on the deterioration and condition assessment of railway infrastructure, specifically within the context of Australia. The methodology chapter outlines the data collection process, utilizing both existing research on railway infrastructure deterioration and data on Australian railway infrastructure parameters such as track geometry, ballast, sleepers, rails, speeds, load capacity, and weather conditions. Data collection methods include track geometry cars, visual and digital inspections, and technologies like LIDAR and ultrasonic energy. The project classifies railway infrastructure parameters into intrinsic (track geometry, ballast, rails, sleepers) and extrinsic (controllable: speeds, load capacity; uncontrollable: weather conditions) categories. It employs the Likert Scale technique to grade parameters and assess the condition of the railway network, using questionnaires and specific scales for each parameter. The project aims to develop models for railway infrastructure deterioration and condition assessment, incorporating grading scales and considering both intrinsic and extrinsic factors. The research uses resources like track geometry cars, visual and digital inspections, and the use of LIDAR and ultrasonic energy technologies to collect data on parameters. The project is designed to develop a model for assessing the condition and predicting the deterioration of railway infrastructure.
CHAPTER 3: METHODOLOGY
3.1. OVERVIEW OF DATA COLLECTION
This research will rely on two sources of data. The first source will be previously done work on
deterioration and condition assessment of railway infrastructure. These research works will
provide a comparative view for the eventual model developed in this paper.
The information from the previously done work will also give an idea on how to develop the
most reliable model for predicting the deterioration of railway infrastructure as well as assessing
its condition.
The research works will work as gauges for the accuracy of the data and analysis done in this
research paper. The error in the analysis can be evaluated by considering analysis and
conclusions arrived at in previous works.
The data collected in previous works also form a reliable pool of data for consideration in present
research.
The second source will be the data on the railway infrastructure in Australia. This will be data on
the metrics of the railway infrastructure. These railway infrastructure parameters are; Track
Geometry, Ballast, Sleepers, Rails, Speeds, Load Capacity and Weather Conditions.
These parameters are going to enable an understanding of the critical factors of the railways
infrastructures that are both subject to deterioration and causes of deterioration. The data on
these parameters is going to be collected from records kept by the relevant agencies, authorities
and organizations.
Paraphrase This Document
Need a fresh take? Get an instant paraphrase of this document with our AI Paraphraser
DETERIORATING OF RAILWAY INFRASTRUCTURE MODELLING (A CASE
STUDY OF AUSTRALIA)
3.2. RESOURCES USED FOR THE RESEARCH
Resources will be mainly used in the collection of data from one of the two data sources. The
collection of data from the work previously done on deterioration of railway infrastructure will
be the exception.
We will require resources to obtain data will be the railway infrastructure parameters. The
resources required for the parameters will be as follows:
Track Geometry: In order to collect information on the track geometry, Track Geometry
Cars will be used. These are vehicles that move on the rails and collect information on
the track geometry (Department of Planning Transport, and Infrastructure - Government
of South Australia, 2008). The cars are high speed moving and operate in such a way that
they don’t interfere with the operations in the rail network (Transportation Technology
Center, 2009). These cars will provide this research with information on the condition of
the track geometry of the railways.
Ballast: The information on the ballast will be collected using three methods: visual
inspection, digital inspection and the use of the LIDAR technology. The visual and
digital inspection will work on an almost similar way. Observations will be made on the
condition of the ballast either physically and in person or from recorded videos and
images of the rails. The LIDAR (in full: Laser Image Detection and Ranging)
Technology on the other hand operates by shooting laser light into the ballast and taking
measurements of the light that reflects back (Heritage & Large, 2009; J & K, 2008;
Vooselman & Maas, 2010). This enables the LIDAR to get information on the quality
and condition of the ballast.
Sleepers: The information on the Sleepers is also collected using three methods: visual
inspection, digital inspection and the use of the ultrasonic energy technology. The visual
and digital inspection will work on an almost similar way. Observations will be made on
the condition of the sleeper either physically and in person or from recorded videos and
images of the rails. The ultrasonic technology operates by shooting ultrasonic energy
onto the sleepers and taking measurements of the energy reflected back (Middleton, et al.,
2007). These measurements allow for information on the type and condition of the
sleepers to be collected.
Rails: Similar to the sleepers, information on the rails is collected using three methods:
visual inspection, digital inspection and the use of the ultrasonic energy technology. The
visual and digital inspection will work on an almost similar way. Observations will be
made on the condition of the rails either physically and in person or from recorded videos
and images of the rails. The ultrasonic technology operates by shooting ultrasonic energy
onto the rails and taking measurements of the energy reflected back (Middleton, et al.,
2007). These measurements allow for information on the type and condition of the rails
to be collected.
Speeds: The average speeds of the trains is going to be considered for this parameter.
Information will be collected from the agencies operating the railway systems on the
2
DETERIORATING OF RAILWAY INFRASTRUCTURE MODELLING (A CASE
STUDY OF AUSTRALIA)
average speeds of the train that use a particular rail network. This will provide
information on the speeds that the rail is regularly subjected to.
Load Capacity: The average load capacity of the trains is going to be considered for this
parameter. Information will be collected from the agencies operating the railway systems
on the average load capacity of the train that use a particular rail network. Both the
passenger and freight trains will be considered in computing the average load capacity.
This will provide information on the load capacity that the rail is regularly subjected to.
Weather Condition: The dominant weather condition along a rail network will be
considered for this parameter. This information will be collected from the relevant
weather agencies throughout Australia. The information will be an indicator on the type
of weather and climatic conditions that a rail network is exposed to (Krzysztof, 2015).
3
⊘ This is a preview!⊘
Do you want full access?
Subscribe today to unlock all pages.
Trusted by 1+ million students worldwide
DETERIORATING OF RAILWAY INFRASTRUCTURE MODELLING (A CASE
STUDY OF AUSTRALIA)
3.3. DEVELOPMENT OF MODELS
3.3.1. CLASSIFICATION OF PARAMETERS
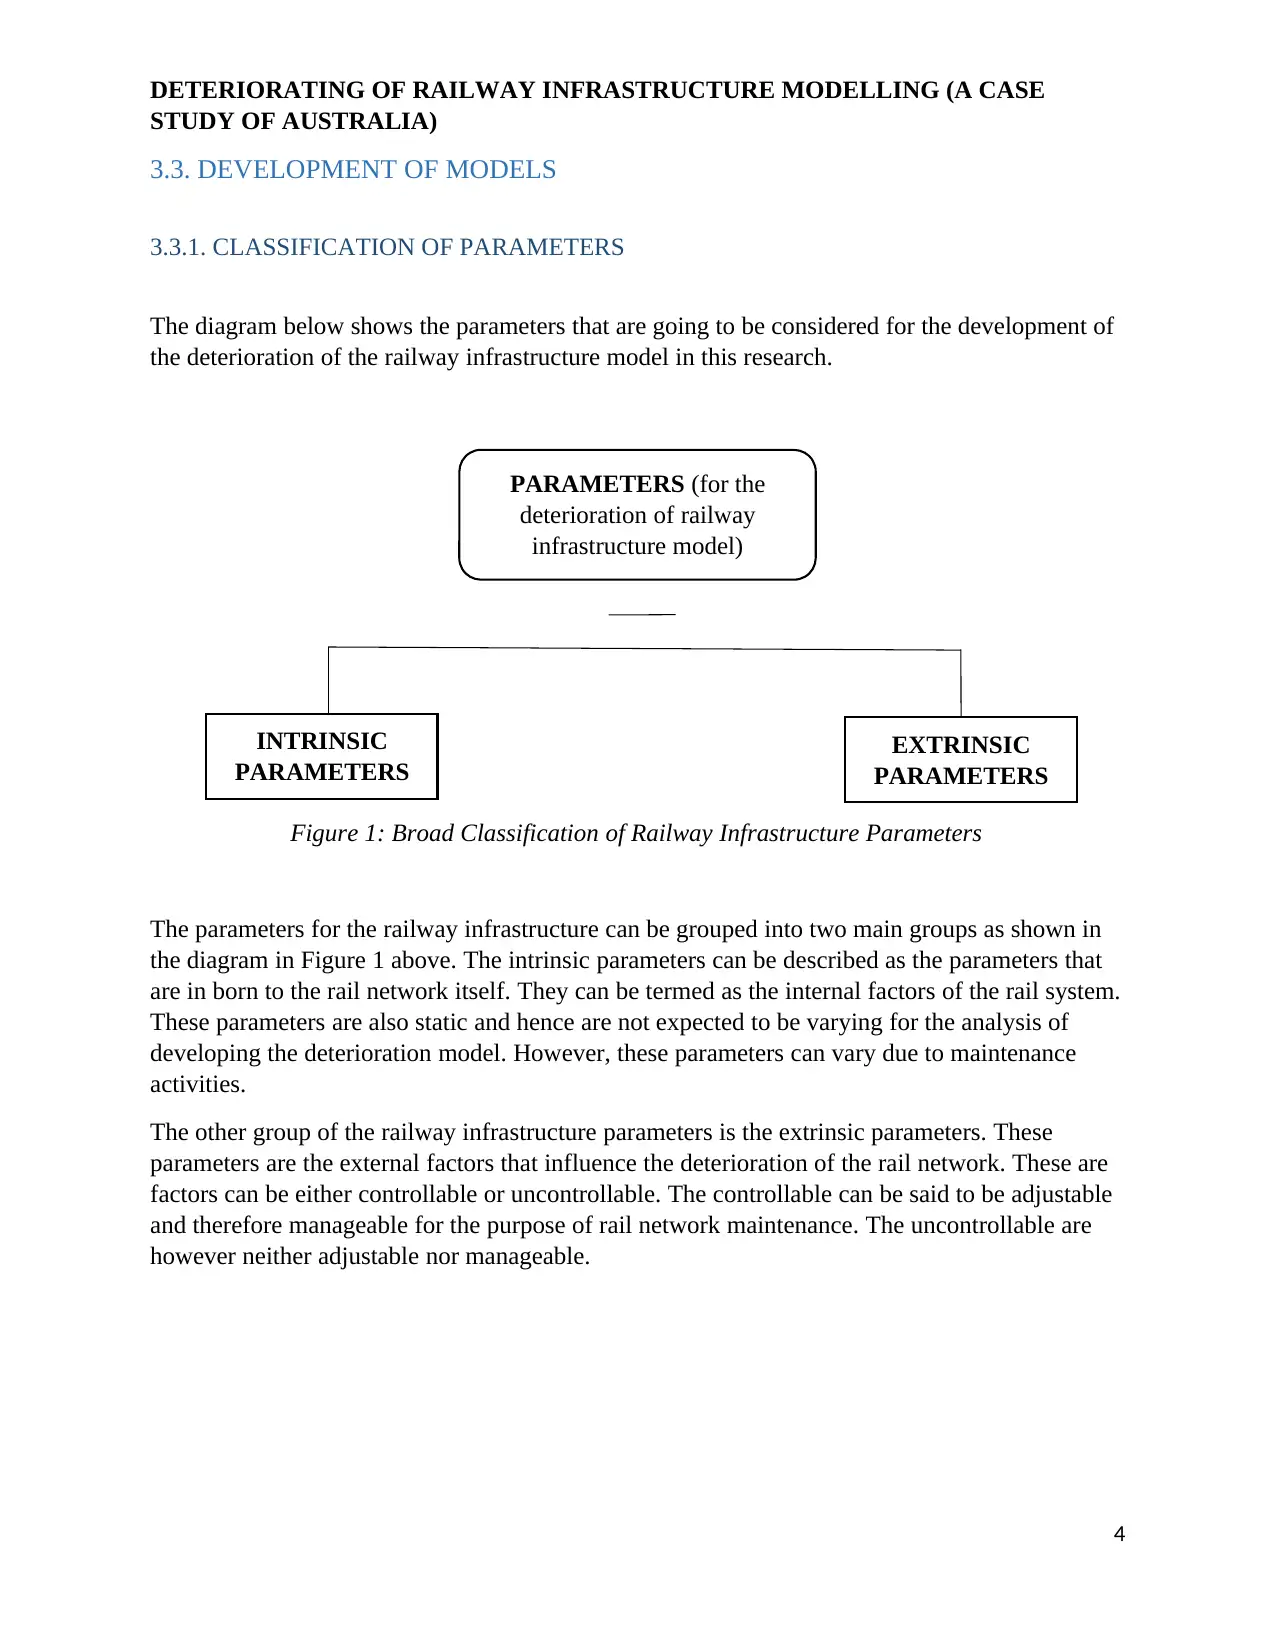
The diagram below shows the parameters that are going to be considered for the development of
the deterioration of the railway infrastructure model in this research.
Figure 1: Broad Classification of Railway Infrastructure Parameters
The parameters for the railway infrastructure can be grouped into two main groups as shown in
the diagram in Figure 1 above. The intrinsic parameters can be described as the parameters that
are in born to the rail network itself. They can be termed as the internal factors of the rail system.
These parameters are also static and hence are not expected to be varying for the analysis of
developing the deterioration model. However, these parameters can vary due to maintenance
activities.
The other group of the railway infrastructure parameters is the extrinsic parameters. These
parameters are the external factors that influence the deterioration of the rail network. These are
factors can be either controllable or uncontrollable. The controllable can be said to be adjustable
and therefore manageable for the purpose of rail network maintenance. The uncontrollable are
however neither adjustable nor manageable.
4
PARAMETERS (for the
deterioration of railway
infrastructure model)
INTRINSIC
PARAMETERS
EXTRINSIC
PARAMETERS
STUDY OF AUSTRALIA)
3.3. DEVELOPMENT OF MODELS
3.3.1. CLASSIFICATION OF PARAMETERS
The diagram below shows the parameters that are going to be considered for the development of
the deterioration of the railway infrastructure model in this research.
Figure 1: Broad Classification of Railway Infrastructure Parameters
The parameters for the railway infrastructure can be grouped into two main groups as shown in
the diagram in Figure 1 above. The intrinsic parameters can be described as the parameters that
are in born to the rail network itself. They can be termed as the internal factors of the rail system.
These parameters are also static and hence are not expected to be varying for the analysis of
developing the deterioration model. However, these parameters can vary due to maintenance
activities.
The other group of the railway infrastructure parameters is the extrinsic parameters. These
parameters are the external factors that influence the deterioration of the rail network. These are
factors can be either controllable or uncontrollable. The controllable can be said to be adjustable
and therefore manageable for the purpose of rail network maintenance. The uncontrollable are
however neither adjustable nor manageable.
4
PARAMETERS (for the
deterioration of railway
infrastructure model)
INTRINSIC
PARAMETERS
EXTRINSIC
PARAMETERS
Paraphrase This Document
Need a fresh take? Get an instant paraphrase of this document with our AI Paraphraser
DETERIORATING OF RAILWAY INFRASTRUCTURE MODELLING (A CASE
STUDY OF AUSTRALIA)
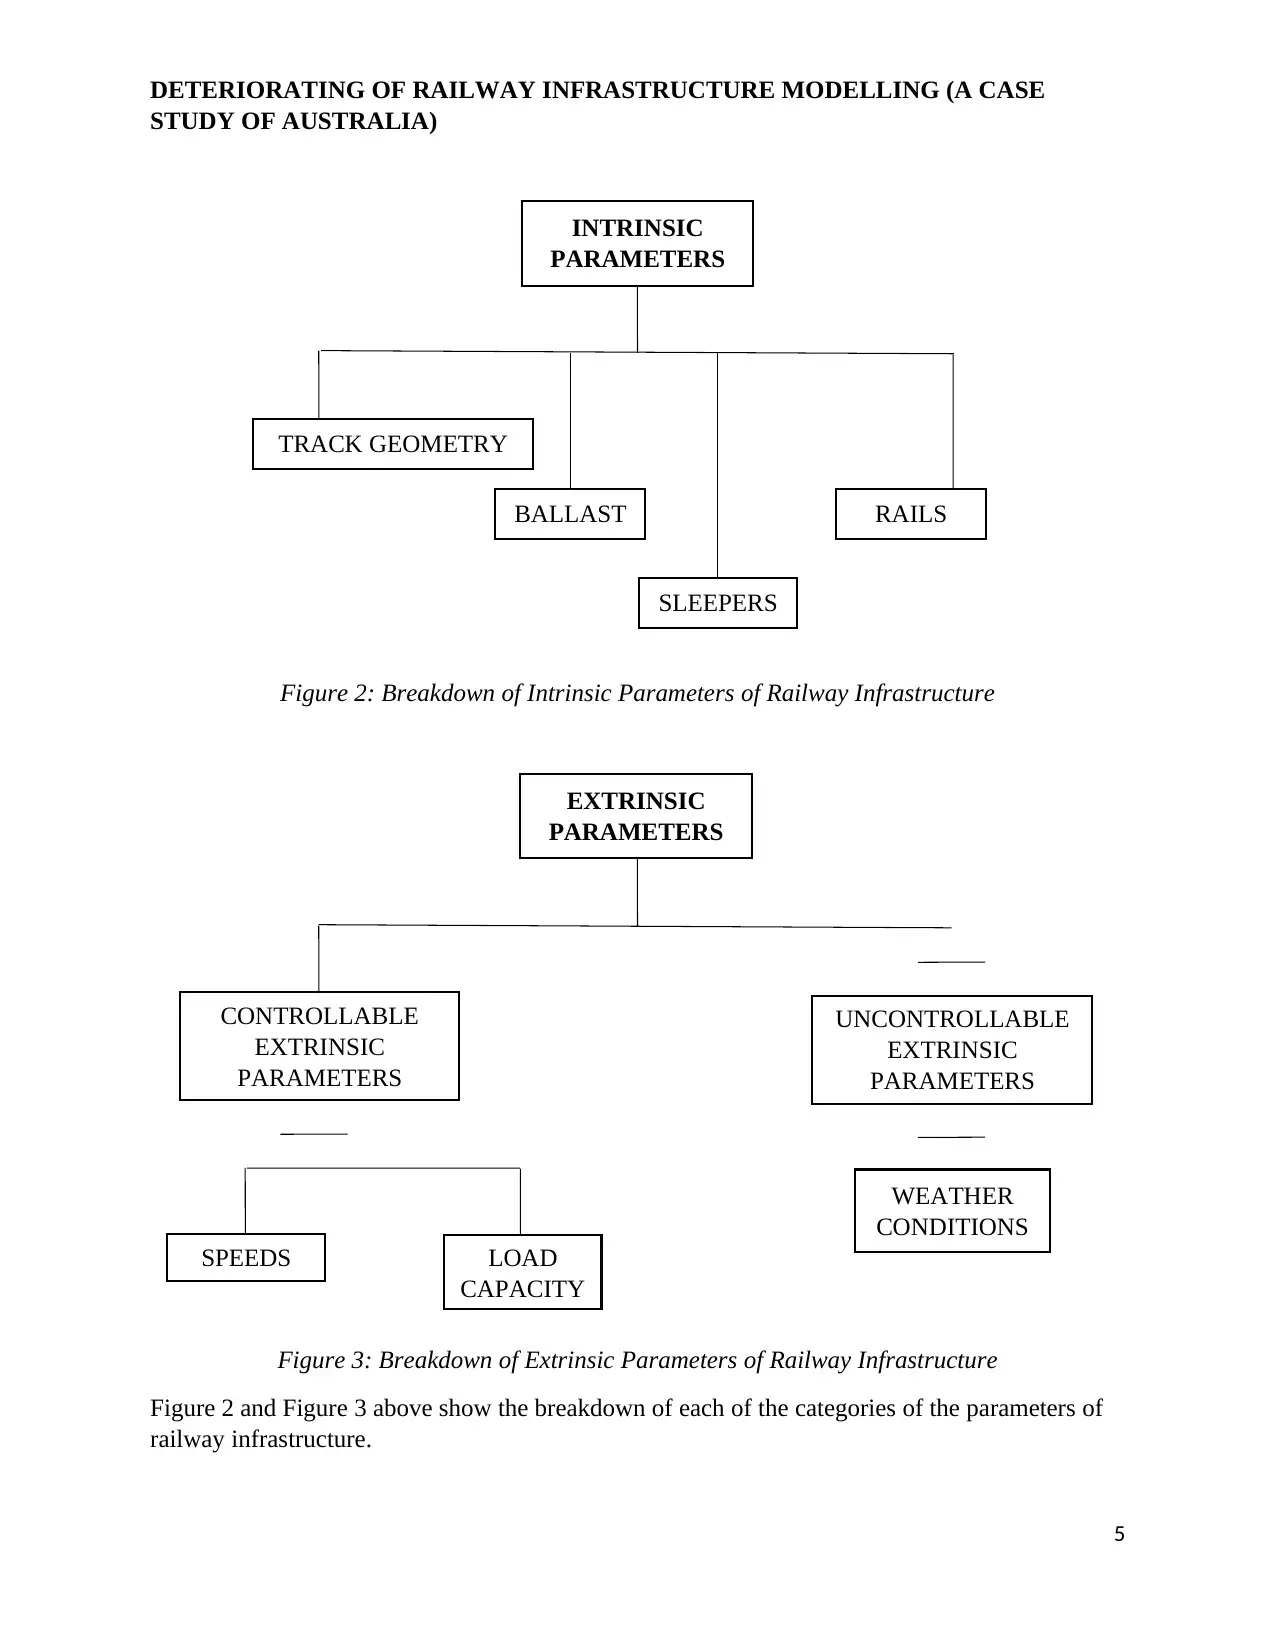
Figure 2: Breakdown of Intrinsic Parameters of Railway Infrastructure
Figure 3: Breakdown of Extrinsic Parameters of Railway Infrastructure
Figure 2 and Figure 3 above show the breakdown of each of the categories of the parameters of
railway infrastructure.
5
INTRINSIC
PARAMETERS
TRACK GEOMETRY
BALLAST
SLEEPERS
RAILS
EXTRINSIC
PARAMETERS
CONTROLLABLE
EXTRINSIC
PARAMETERS
UNCONTROLLABLE
EXTRINSIC
PARAMETERS
SPEEDS LOAD
CAPACITY
WEATHER
CONDITIONS
STUDY OF AUSTRALIA)
Figure 2: Breakdown of Intrinsic Parameters of Railway Infrastructure
Figure 3: Breakdown of Extrinsic Parameters of Railway Infrastructure
Figure 2 and Figure 3 above show the breakdown of each of the categories of the parameters of
railway infrastructure.
5
INTRINSIC
PARAMETERS
TRACK GEOMETRY
BALLAST
SLEEPERS
RAILS
EXTRINSIC
PARAMETERS
CONTROLLABLE
EXTRINSIC
PARAMETERS
UNCONTROLLABLE
EXTRINSIC
PARAMETERS
SPEEDS LOAD
CAPACITY
WEATHER
CONDITIONS
DETERIORATING OF RAILWAY INFRASTRUCTURE MODELLING (A CASE
STUDY OF AUSTRALIA)
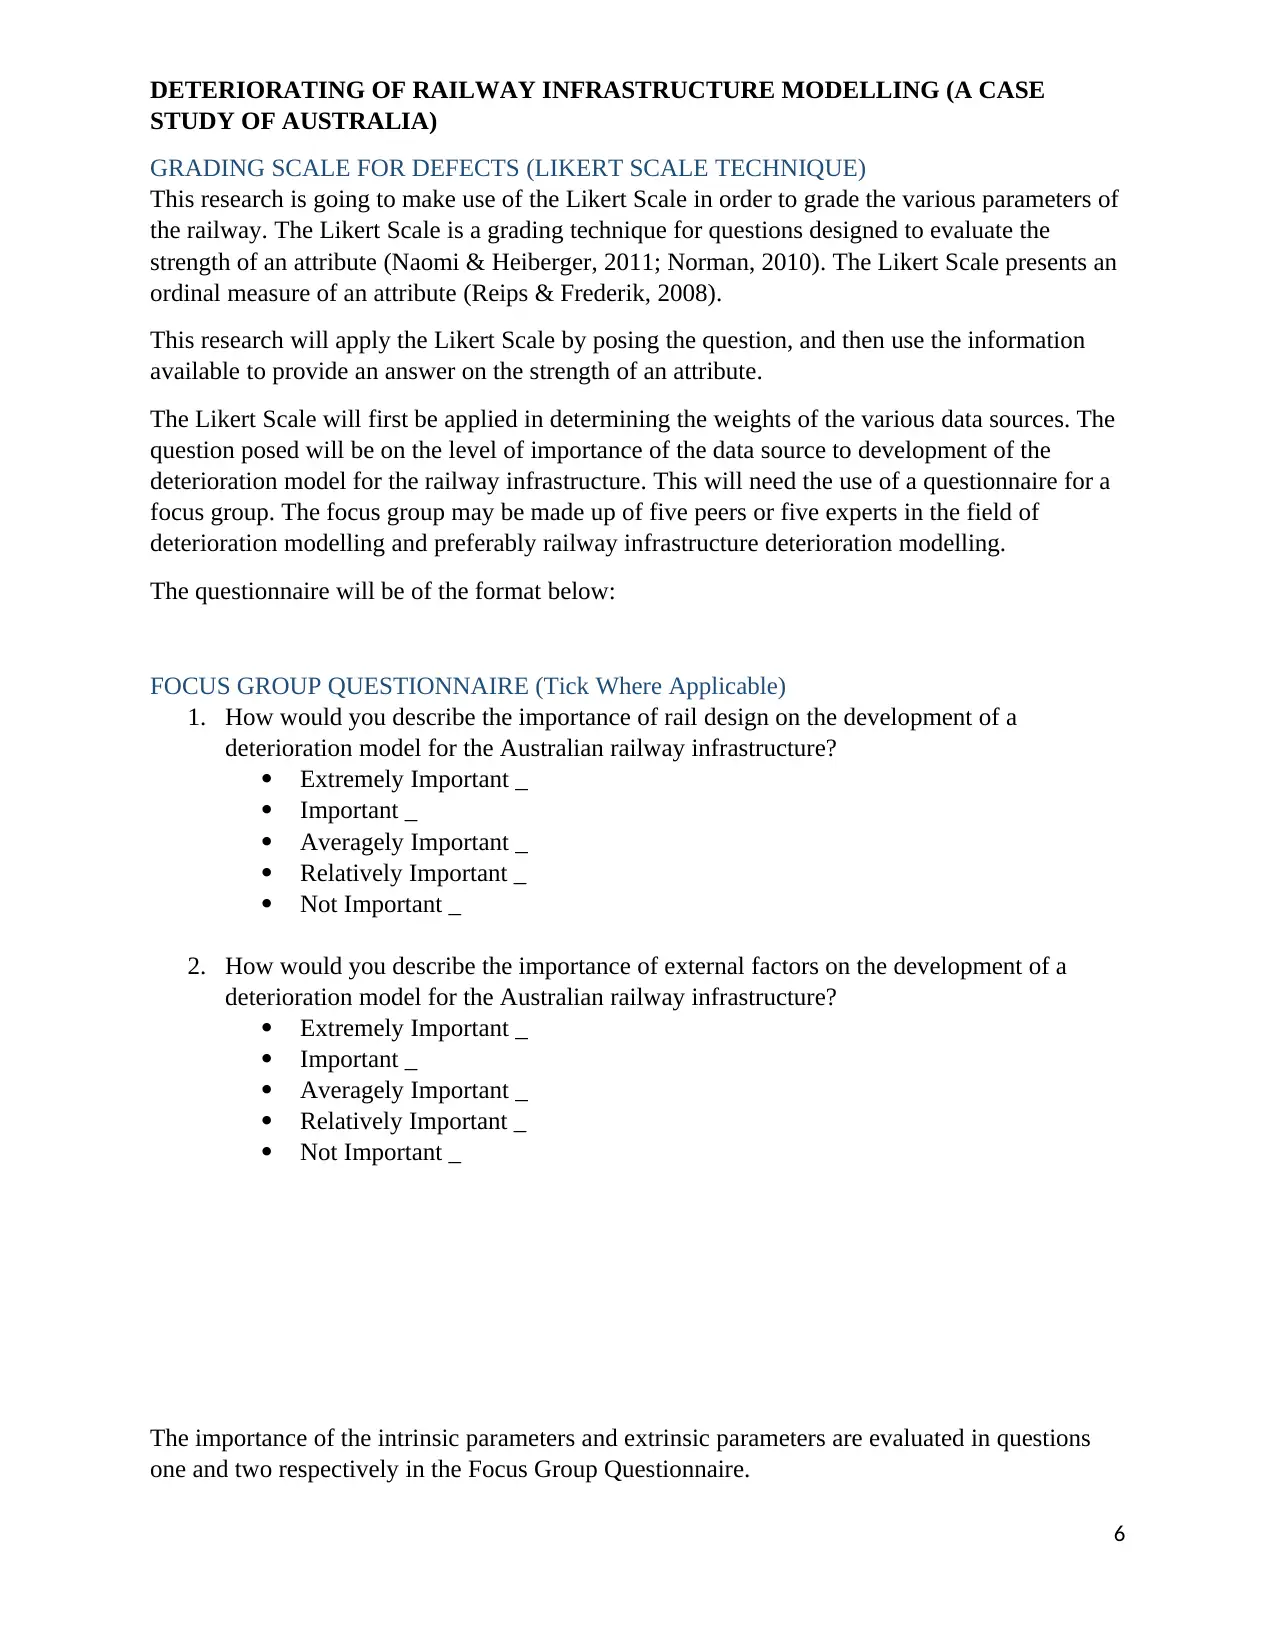
GRADING SCALE FOR DEFECTS (LIKERT SCALE TECHNIQUE)
This research is going to make use of the Likert Scale in order to grade the various parameters of
the railway. The Likert Scale is a grading technique for questions designed to evaluate the
strength of an attribute (Naomi & Heiberger, 2011; Norman, 2010). The Likert Scale presents an
ordinal measure of an attribute (Reips & Frederik, 2008).
This research will apply the Likert Scale by posing the question, and then use the information
available to provide an answer on the strength of an attribute.
The Likert Scale will first be applied in determining the weights of the various data sources. The
question posed will be on the level of importance of the data source to development of the
deterioration model for the railway infrastructure. This will need the use of a questionnaire for a
focus group. The focus group may be made up of five peers or five experts in the field of
deterioration modelling and preferably railway infrastructure deterioration modelling.
The questionnaire will be of the format below:
FOCUS GROUP QUESTIONNAIRE (Tick Where Applicable)
1. How would you describe the importance of rail design on the development of a
deterioration model for the Australian railway infrastructure?
Extremely Important _
Important _
Averagely Important _
Relatively Important _
Not Important _
2. How would you describe the importance of external factors on the development of a
deterioration model for the Australian railway infrastructure?
Extremely Important _
Important _
Averagely Important _
Relatively Important _
Not Important _
The importance of the intrinsic parameters and extrinsic parameters are evaluated in questions
one and two respectively in the Focus Group Questionnaire.
6
STUDY OF AUSTRALIA)
GRADING SCALE FOR DEFECTS (LIKERT SCALE TECHNIQUE)
This research is going to make use of the Likert Scale in order to grade the various parameters of
the railway. The Likert Scale is a grading technique for questions designed to evaluate the
strength of an attribute (Naomi & Heiberger, 2011; Norman, 2010). The Likert Scale presents an
ordinal measure of an attribute (Reips & Frederik, 2008).
This research will apply the Likert Scale by posing the question, and then use the information
available to provide an answer on the strength of an attribute.
The Likert Scale will first be applied in determining the weights of the various data sources. The
question posed will be on the level of importance of the data source to development of the
deterioration model for the railway infrastructure. This will need the use of a questionnaire for a
focus group. The focus group may be made up of five peers or five experts in the field of
deterioration modelling and preferably railway infrastructure deterioration modelling.
The questionnaire will be of the format below:
FOCUS GROUP QUESTIONNAIRE (Tick Where Applicable)
1. How would you describe the importance of rail design on the development of a
deterioration model for the Australian railway infrastructure?
Extremely Important _
Important _
Averagely Important _
Relatively Important _
Not Important _
2. How would you describe the importance of external factors on the development of a
deterioration model for the Australian railway infrastructure?
Extremely Important _
Important _
Averagely Important _
Relatively Important _
Not Important _
The importance of the intrinsic parameters and extrinsic parameters are evaluated in questions
one and two respectively in the Focus Group Questionnaire.
6
⊘ This is a preview!⊘
Do you want full access?
Subscribe today to unlock all pages.
Trusted by 1+ million students worldwide
DETERIORATING OF RAILWAY INFRASTRUCTURE MODELLING (A CASE
STUDY OF AUSTRALIA)
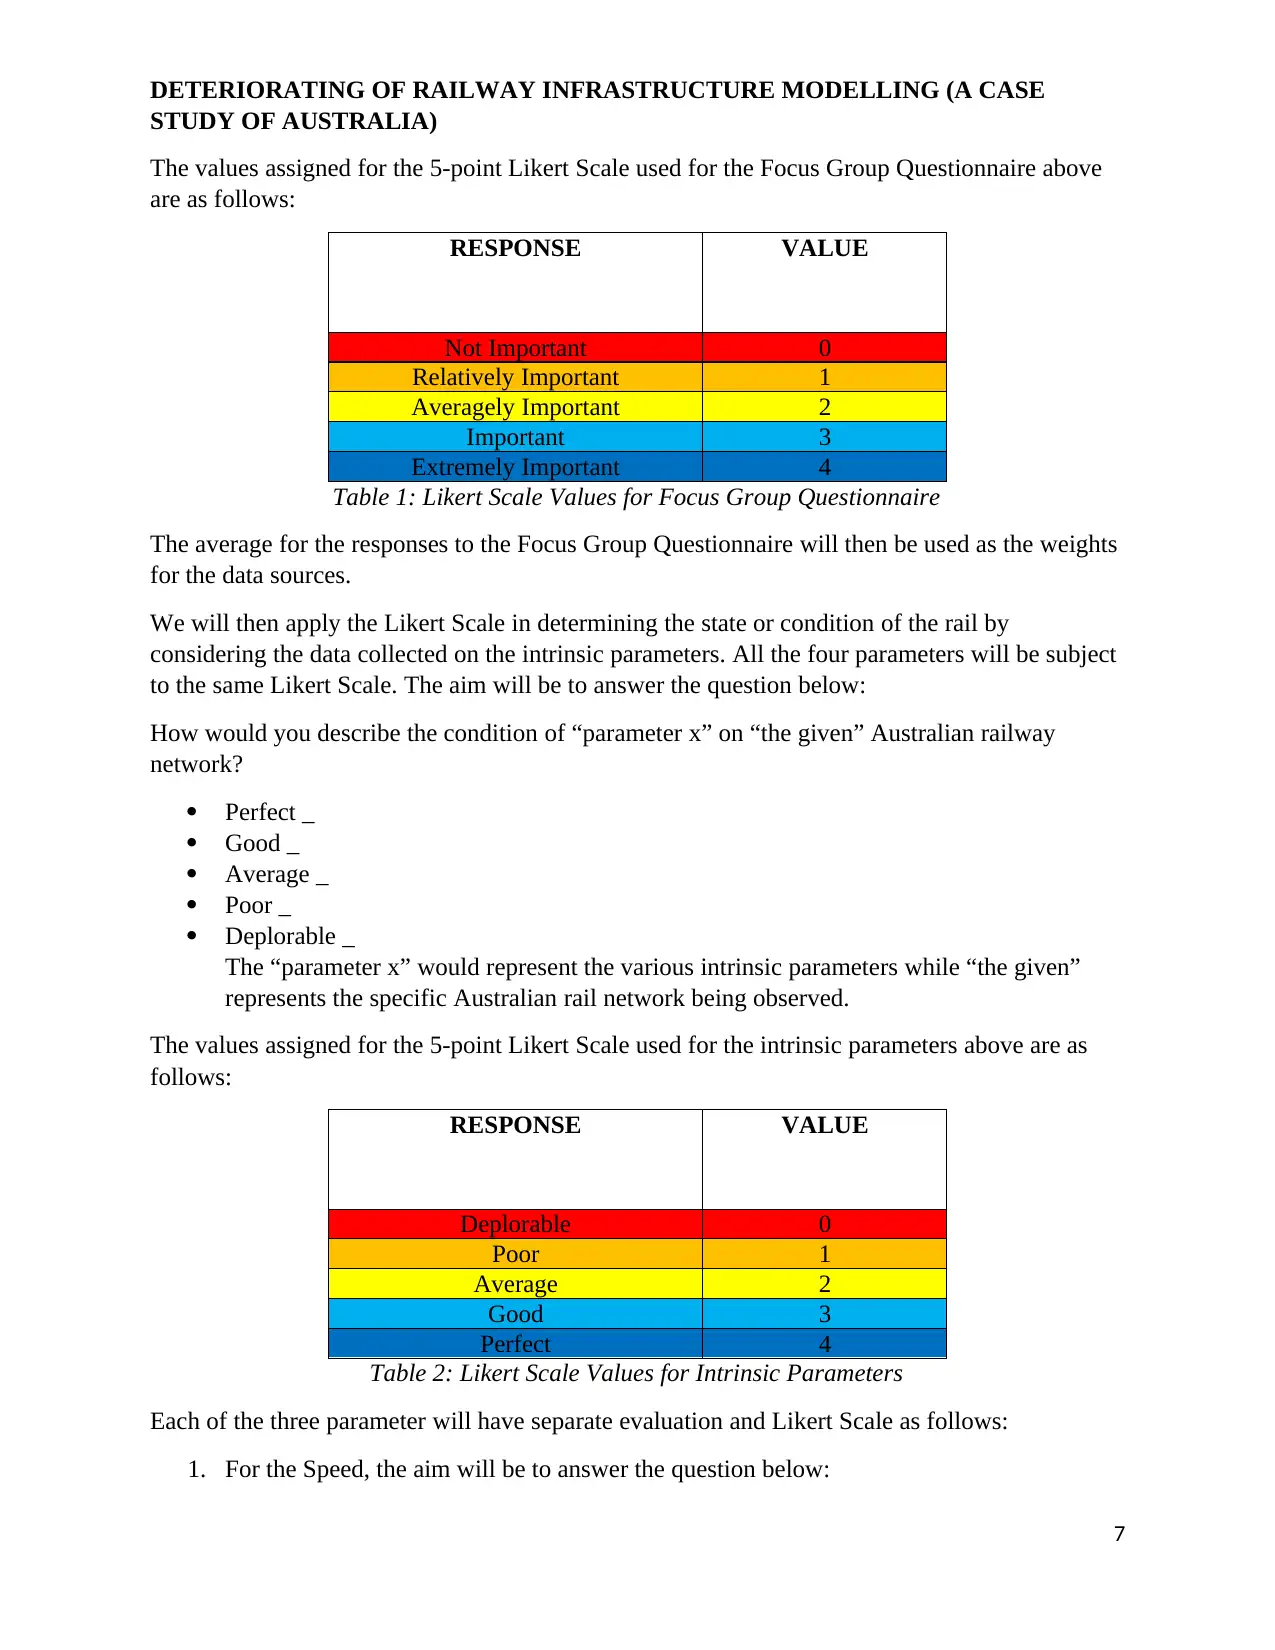
The values assigned for the 5-point Likert Scale used for the Focus Group Questionnaire above
are as follows:
RESPONSE VALUE
Not Important 0
Relatively Important 1
Averagely Important 2
Important 3
Extremely Important 4
Table 1: Likert Scale Values for Focus Group Questionnaire
The average for the responses to the Focus Group Questionnaire will then be used as the weights
for the data sources.
We will then apply the Likert Scale in determining the state or condition of the rail by
considering the data collected on the intrinsic parameters. All the four parameters will be subject
to the same Likert Scale. The aim will be to answer the question below:
How would you describe the condition of “parameter x” on “the given” Australian railway
network?
Perfect _
Good _
Average _
Poor _
Deplorable _
The “parameter x” would represent the various intrinsic parameters while “the given”
represents the specific Australian rail network being observed.
The values assigned for the 5-point Likert Scale used for the intrinsic parameters above are as
follows:
RESPONSE VALUE
Deplorable 0
Poor 1
Average 2
Good 3
Perfect 4
Table 2: Likert Scale Values for Intrinsic Parameters
Each of the three parameter will have separate evaluation and Likert Scale as follows:
1. For the Speed, the aim will be to answer the question below:
7
STUDY OF AUSTRALIA)
The values assigned for the 5-point Likert Scale used for the Focus Group Questionnaire above
are as follows:
RESPONSE VALUE
Not Important 0
Relatively Important 1
Averagely Important 2
Important 3
Extremely Important 4
Table 1: Likert Scale Values for Focus Group Questionnaire
The average for the responses to the Focus Group Questionnaire will then be used as the weights
for the data sources.
We will then apply the Likert Scale in determining the state or condition of the rail by
considering the data collected on the intrinsic parameters. All the four parameters will be subject
to the same Likert Scale. The aim will be to answer the question below:
How would you describe the condition of “parameter x” on “the given” Australian railway
network?
Perfect _
Good _
Average _
Poor _
Deplorable _
The “parameter x” would represent the various intrinsic parameters while “the given”
represents the specific Australian rail network being observed.
The values assigned for the 5-point Likert Scale used for the intrinsic parameters above are as
follows:
RESPONSE VALUE
Deplorable 0
Poor 1
Average 2
Good 3
Perfect 4
Table 2: Likert Scale Values for Intrinsic Parameters
Each of the three parameter will have separate evaluation and Likert Scale as follows:
1. For the Speed, the aim will be to answer the question below:
7
Paraphrase This Document
Need a fresh take? Get an instant paraphrase of this document with our AI Paraphraser
DETERIORATING OF RAILWAY INFRASTRUCTURE MODELLING (A CASE
STUDY OF AUSTRALIA)
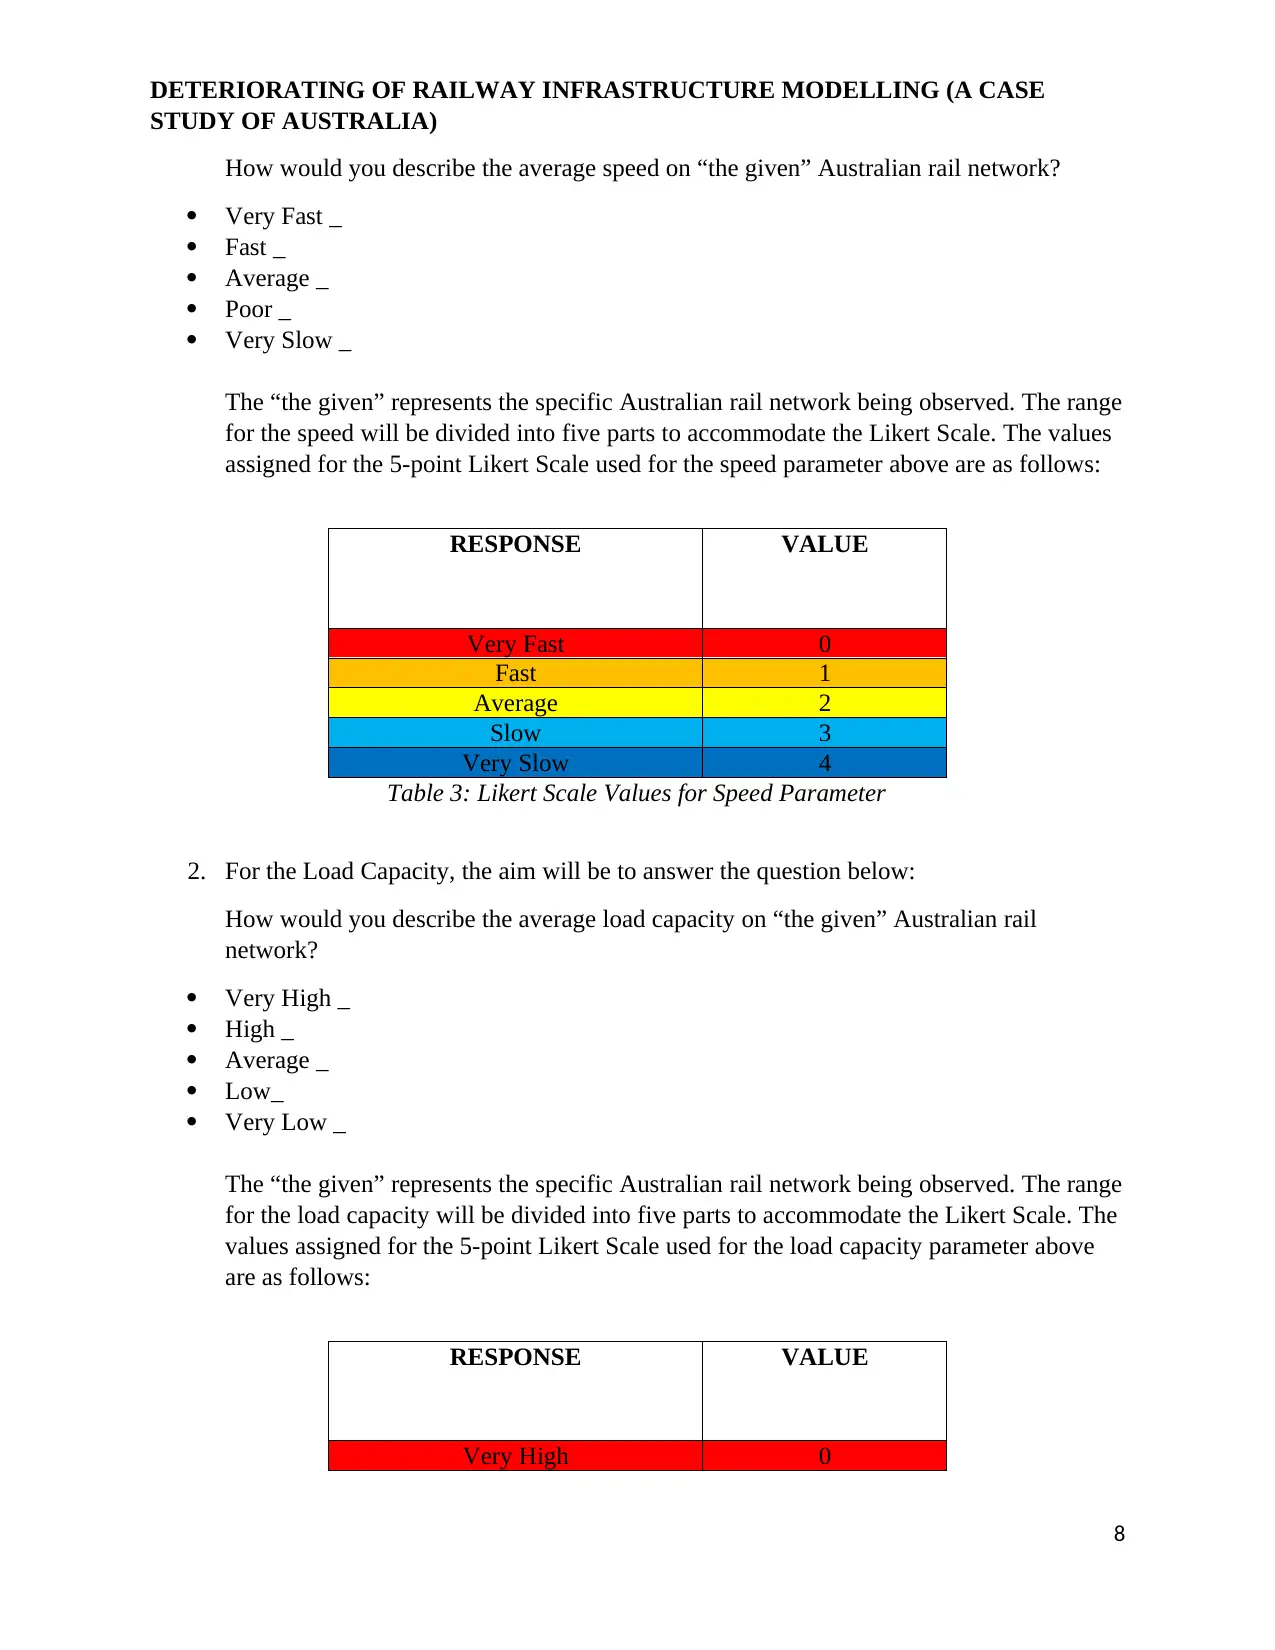
How would you describe the average speed on “the given” Australian rail network?
Very Fast _
Fast _
Average _
Poor _
Very Slow _
The “the given” represents the specific Australian rail network being observed. The range
for the speed will be divided into five parts to accommodate the Likert Scale. The values
assigned for the 5-point Likert Scale used for the speed parameter above are as follows:
RESPONSE VALUE
Very Fast 0
Fast 1
Average 2
Slow 3
Very Slow 4
Table 3: Likert Scale Values for Speed Parameter
2. For the Load Capacity, the aim will be to answer the question below:
How would you describe the average load capacity on “the given” Australian rail
network?
Very High _
High _
Average _
Low_
Very Low _
The “the given” represents the specific Australian rail network being observed. The range
for the load capacity will be divided into five parts to accommodate the Likert Scale. The
values assigned for the 5-point Likert Scale used for the load capacity parameter above
are as follows:
RESPONSE VALUE
Very High 0
8
STUDY OF AUSTRALIA)
How would you describe the average speed on “the given” Australian rail network?
Very Fast _
Fast _
Average _
Poor _
Very Slow _
The “the given” represents the specific Australian rail network being observed. The range
for the speed will be divided into five parts to accommodate the Likert Scale. The values
assigned for the 5-point Likert Scale used for the speed parameter above are as follows:
RESPONSE VALUE
Very Fast 0
Fast 1
Average 2
Slow 3
Very Slow 4
Table 3: Likert Scale Values for Speed Parameter
2. For the Load Capacity, the aim will be to answer the question below:
How would you describe the average load capacity on “the given” Australian rail
network?
Very High _
High _
Average _
Low_
Very Low _
The “the given” represents the specific Australian rail network being observed. The range
for the load capacity will be divided into five parts to accommodate the Likert Scale. The
values assigned for the 5-point Likert Scale used for the load capacity parameter above
are as follows:
RESPONSE VALUE
Very High 0
8
DETERIORATING OF RAILWAY INFRASTRUCTURE MODELLING (A CASE
STUDY OF AUSTRALIA)
High 1
Average 2
Low 3
Very Low 4
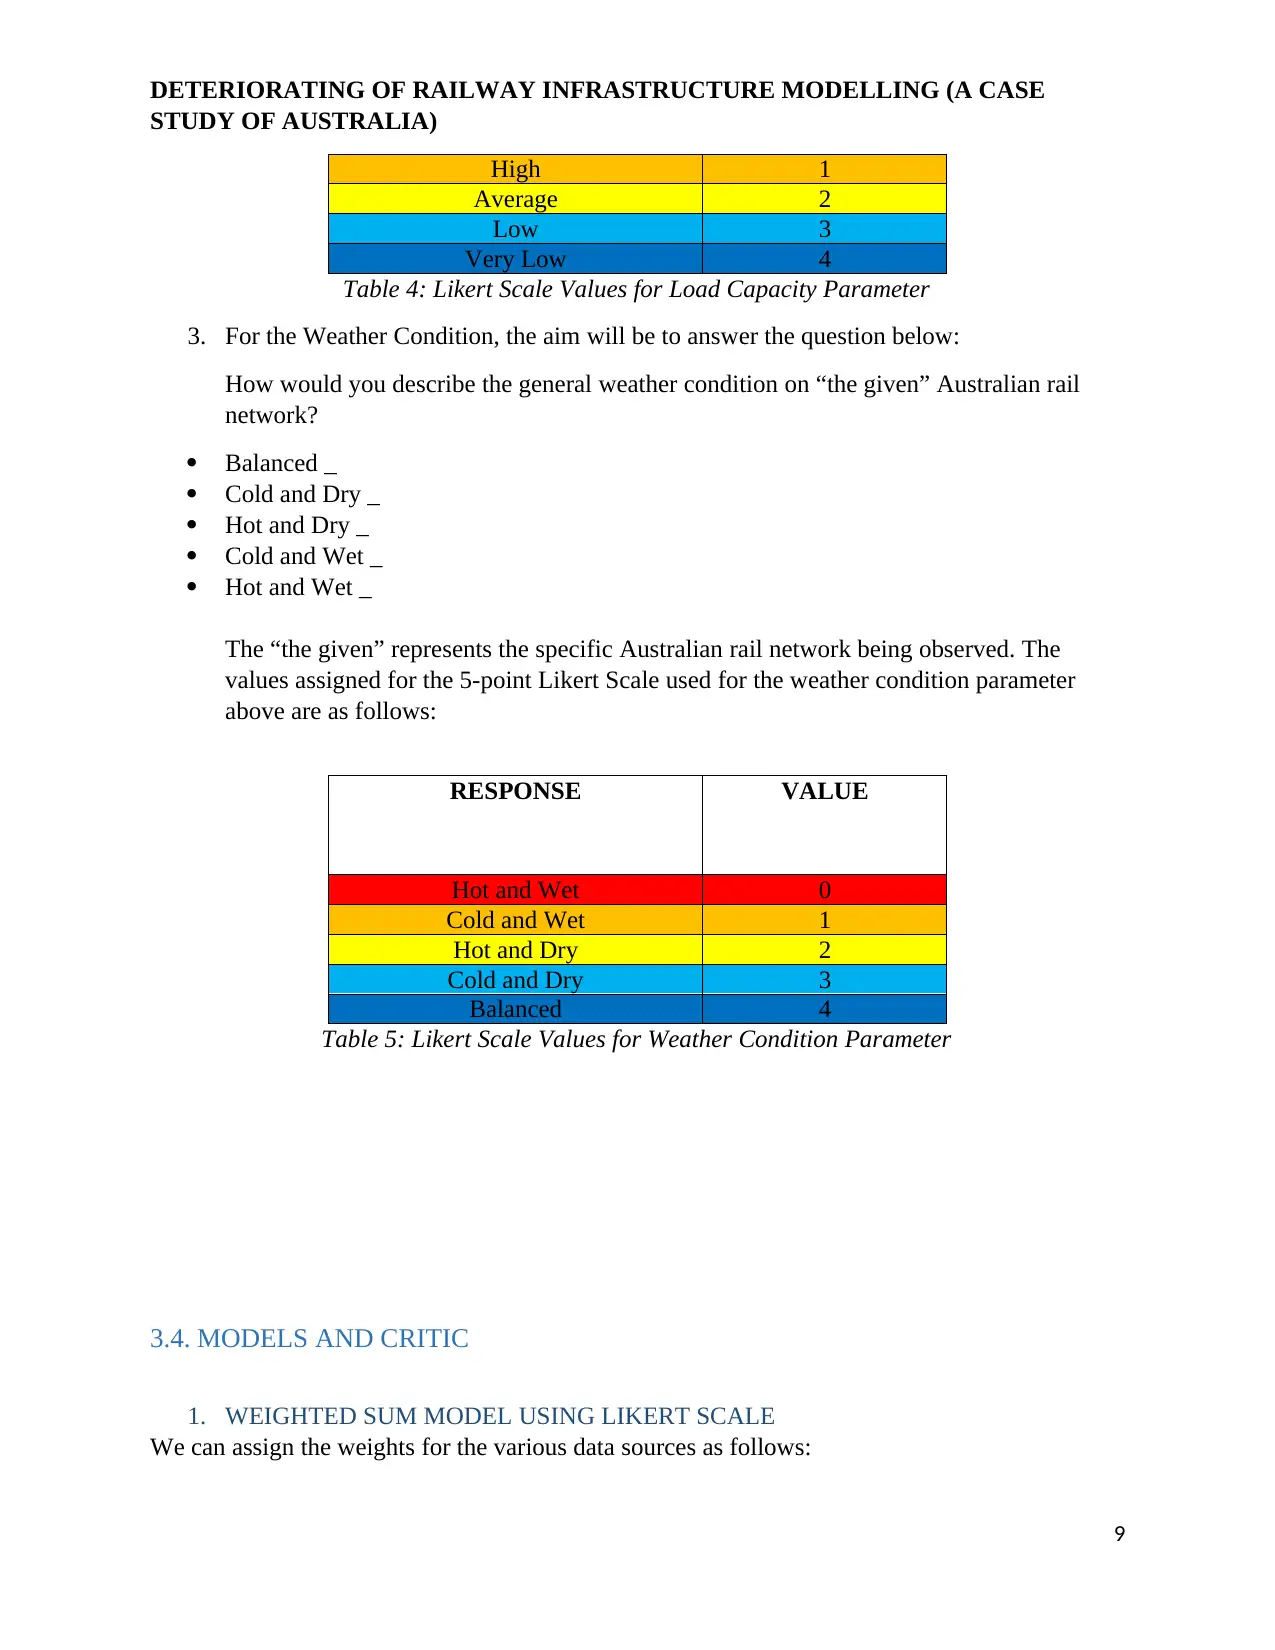
Table 4: Likert Scale Values for Load Capacity Parameter
3. For the Weather Condition, the aim will be to answer the question below:
How would you describe the general weather condition on “the given” Australian rail
network?
Balanced _
Cold and Dry _
Hot and Dry _
Cold and Wet _
Hot and Wet _
The “the given” represents the specific Australian rail network being observed. The
values assigned for the 5-point Likert Scale used for the weather condition parameter
above are as follows:
RESPONSE VALUE
Hot and Wet 0
Cold and Wet 1
Hot and Dry 2
Cold and Dry 3
Balanced 4
Table 5: Likert Scale Values for Weather Condition Parameter
3.4. MODELS AND CRITIC
1. WEIGHTED SUM MODEL USING LIKERT SCALE
We can assign the weights for the various data sources as follows:
9
STUDY OF AUSTRALIA)
High 1
Average 2
Low 3
Very Low 4
Table 4: Likert Scale Values for Load Capacity Parameter
3. For the Weather Condition, the aim will be to answer the question below:
How would you describe the general weather condition on “the given” Australian rail
network?
Balanced _
Cold and Dry _
Hot and Dry _
Cold and Wet _
Hot and Wet _
The “the given” represents the specific Australian rail network being observed. The
values assigned for the 5-point Likert Scale used for the weather condition parameter
above are as follows:
RESPONSE VALUE
Hot and Wet 0
Cold and Wet 1
Hot and Dry 2
Cold and Dry 3
Balanced 4
Table 5: Likert Scale Values for Weather Condition Parameter
3.4. MODELS AND CRITIC
1. WEIGHTED SUM MODEL USING LIKERT SCALE
We can assign the weights for the various data sources as follows:
9
⊘ This is a preview!⊘
Do you want full access?
Subscribe today to unlock all pages.
Trusted by 1+ million students worldwide
DETERIORATING OF RAILWAY INFRASTRUCTURE MODELLING (A CASE
STUDY OF AUSTRALIA)
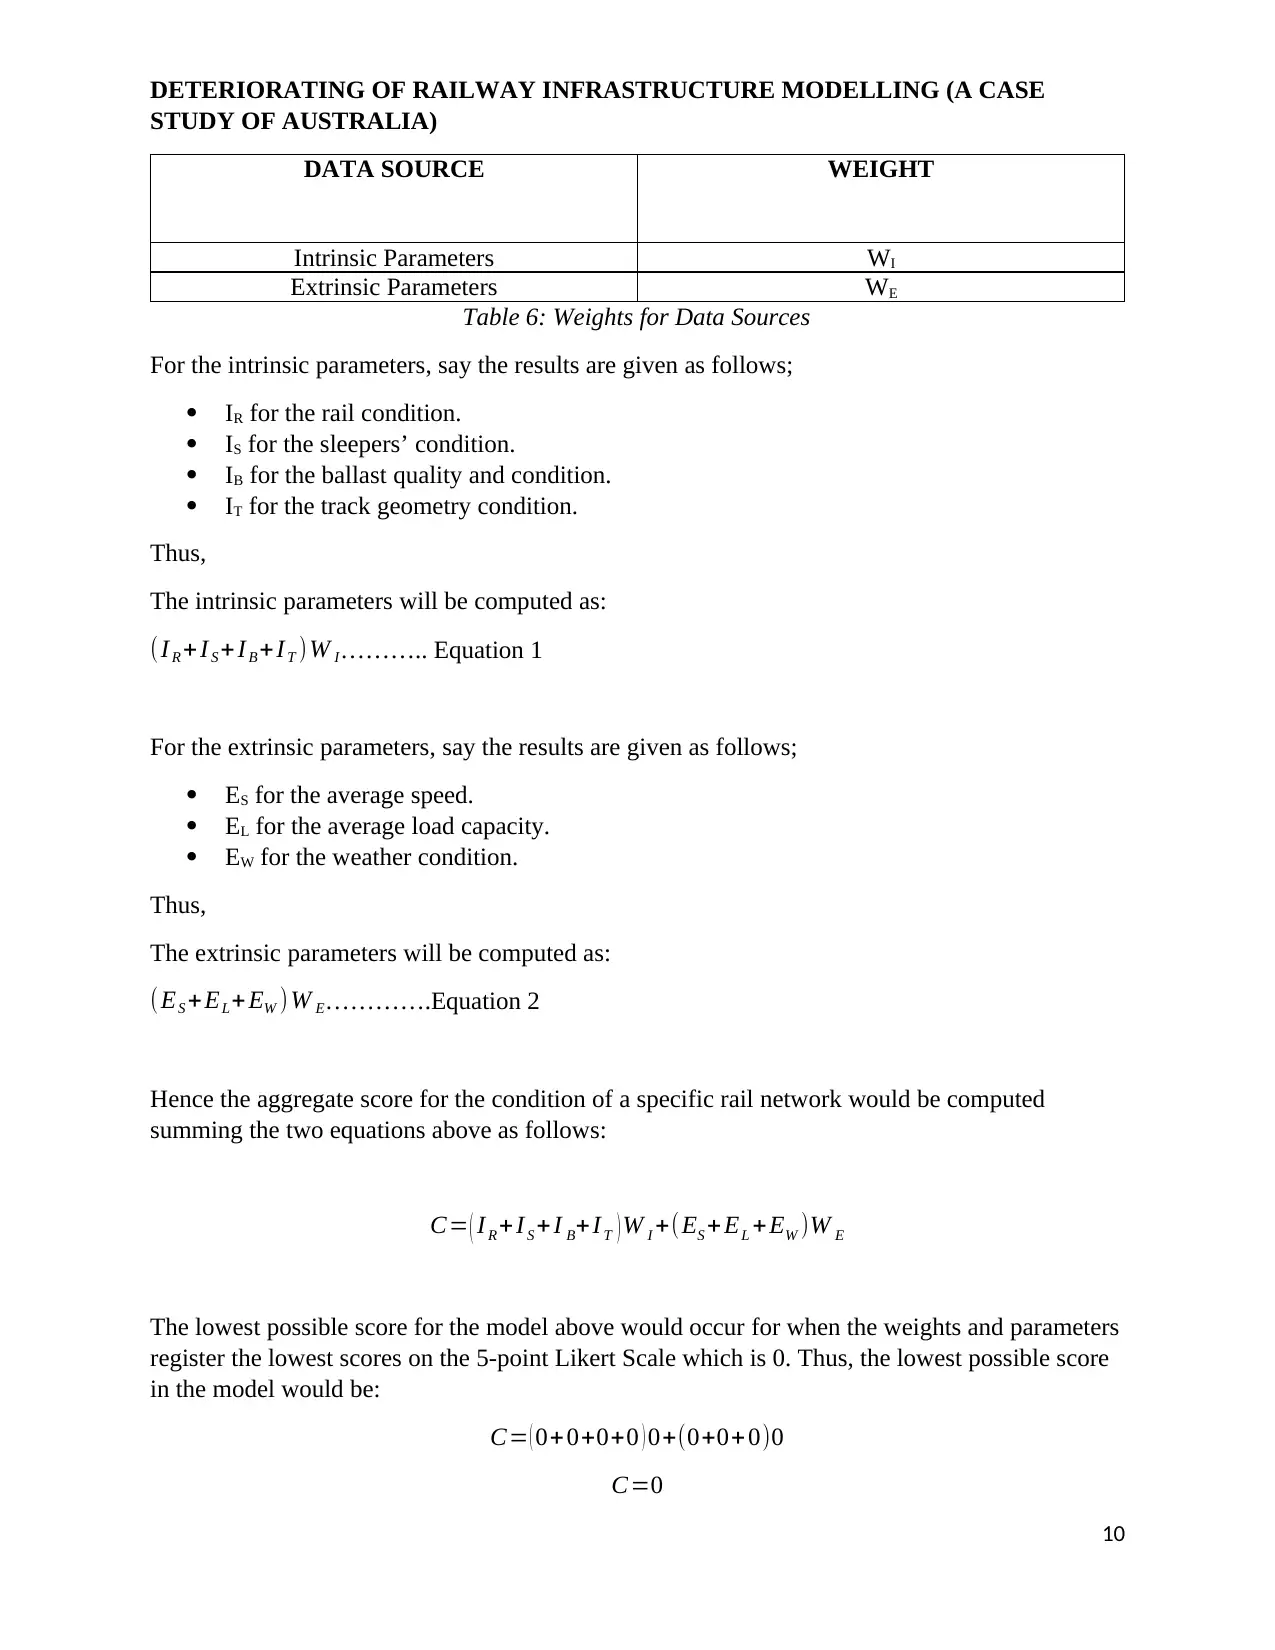
DATA SOURCE WEIGHT
Intrinsic Parameters WI
Extrinsic Parameters WE
Table 6: Weights for Data Sources
For the intrinsic parameters, say the results are given as follows;
IR for the rail condition.
IS for the sleepers’ condition.
IB for the ballast quality and condition.
IT for the track geometry condition.
Thus,
The intrinsic parameters will be computed as:
(I R + I S + I B +I T )W I……….. Equation 1
For the extrinsic parameters, say the results are given as follows;
ES for the average speed.
EL for the average load capacity.
EW for the weather condition.
Thus,
The extrinsic parameters will be computed as:
(ES + EL+ EW ) W E………….Equation 2
Hence the aggregate score for the condition of a specific rail network would be computed
summing the two equations above as follows:
C= ( I R + I S + I B+I T ) W I +(ES + EL + EW )W E
The lowest possible score for the model above would occur for when the weights and parameters
register the lowest scores on the 5-point Likert Scale which is 0. Thus, the lowest possible score
in the model would be:
C= ( 0+ 0+0+0 ) 0+(0+0+ 0)0
C=0
10
STUDY OF AUSTRALIA)
DATA SOURCE WEIGHT
Intrinsic Parameters WI
Extrinsic Parameters WE
Table 6: Weights for Data Sources
For the intrinsic parameters, say the results are given as follows;
IR for the rail condition.
IS for the sleepers’ condition.
IB for the ballast quality and condition.
IT for the track geometry condition.
Thus,
The intrinsic parameters will be computed as:
(I R + I S + I B +I T )W I……….. Equation 1
For the extrinsic parameters, say the results are given as follows;
ES for the average speed.
EL for the average load capacity.
EW for the weather condition.
Thus,
The extrinsic parameters will be computed as:
(ES + EL+ EW ) W E………….Equation 2
Hence the aggregate score for the condition of a specific rail network would be computed
summing the two equations above as follows:
C= ( I R + I S + I B+I T ) W I +(ES + EL + EW )W E
The lowest possible score for the model above would occur for when the weights and parameters
register the lowest scores on the 5-point Likert Scale which is 0. Thus, the lowest possible score
in the model would be:
C= ( 0+ 0+0+0 ) 0+(0+0+ 0)0
C=0
10
Paraphrase This Document
Need a fresh take? Get an instant paraphrase of this document with our AI Paraphraser
DETERIORATING OF RAILWAY INFRASTRUCTURE MODELLING (A CASE
STUDY OF AUSTRALIA)
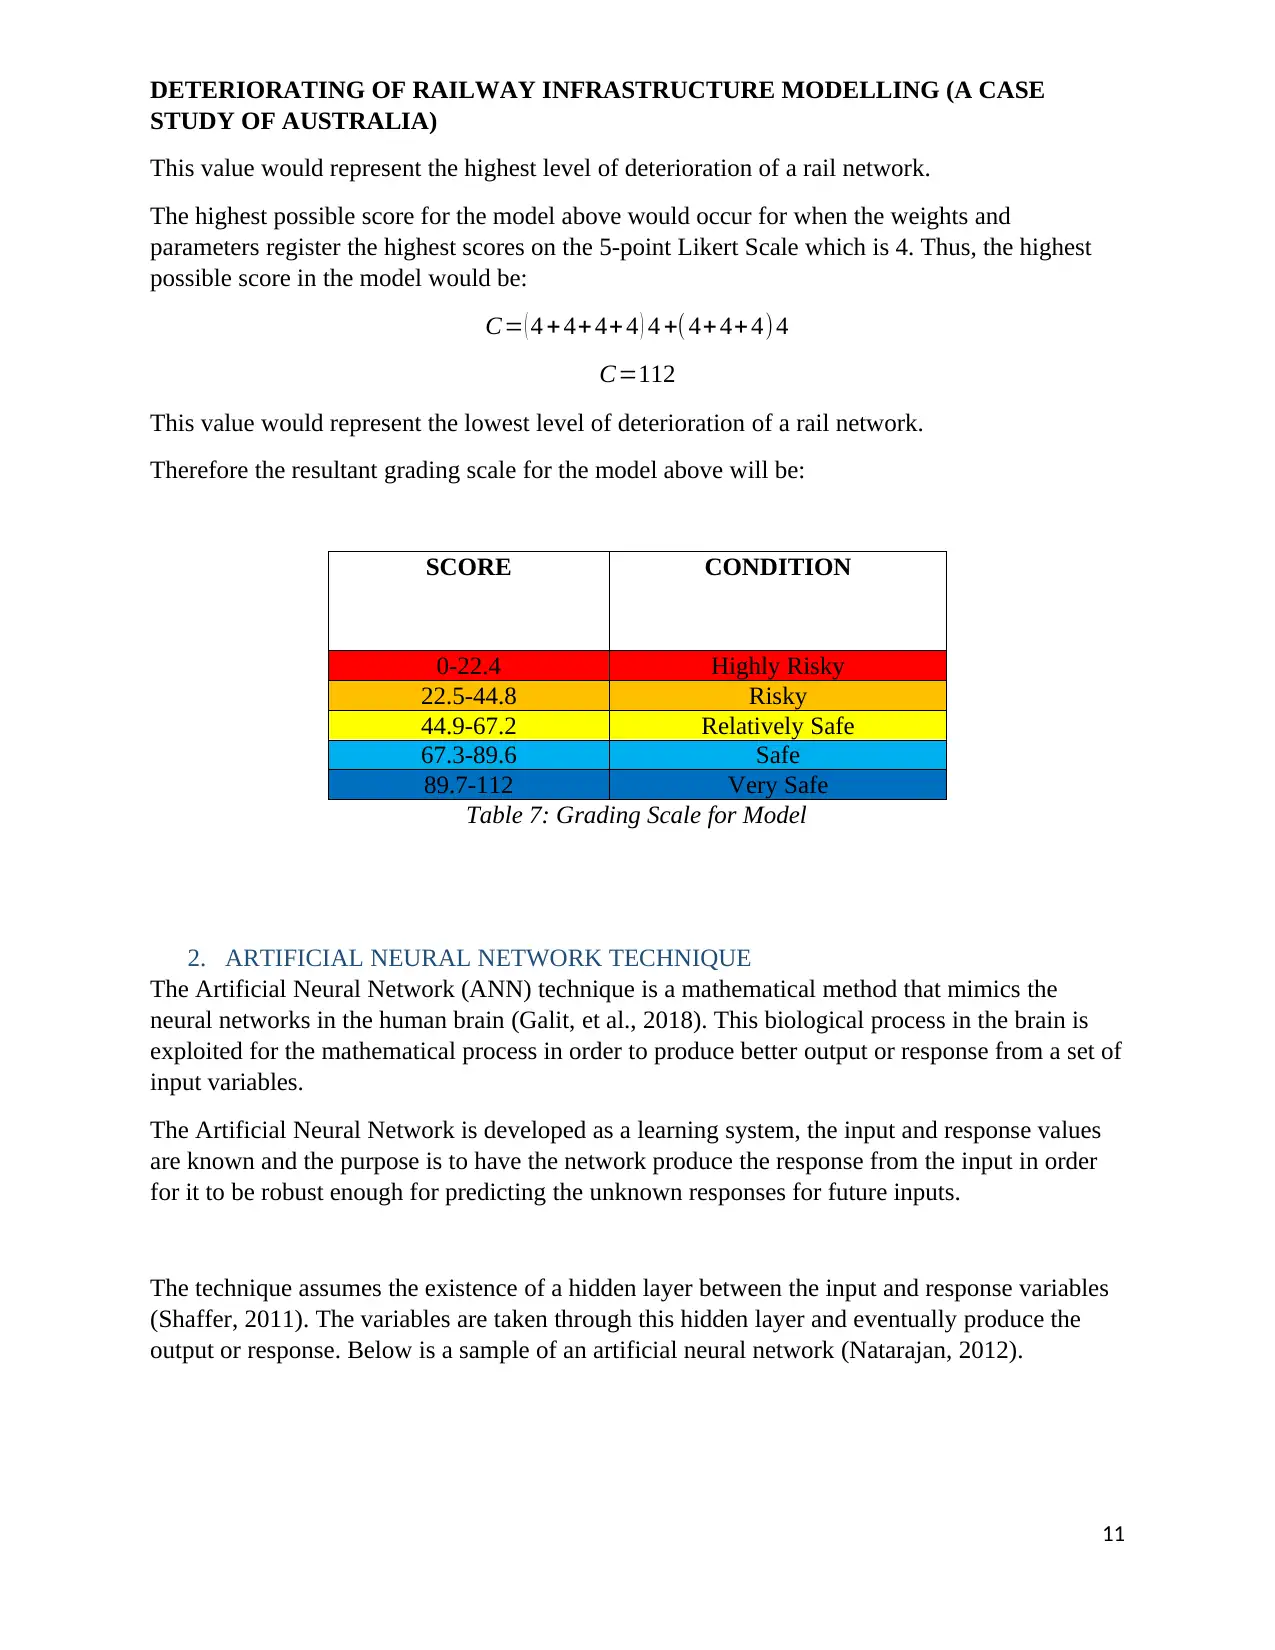
This value would represent the highest level of deterioration of a rail network.
The highest possible score for the model above would occur for when the weights and
parameters register the highest scores on the 5-point Likert Scale which is 4. Thus, the highest
possible score in the model would be:
C= ( 4 + 4+ 4+ 4 ) 4 +( 4+ 4+ 4)4
C=112
This value would represent the lowest level of deterioration of a rail network.
Therefore the resultant grading scale for the model above will be:
SCORE CONDITION
0-22.4 Highly Risky
22.5-44.8 Risky
44.9-67.2 Relatively Safe
67.3-89.6 Safe
89.7-112 Very Safe
Table 7: Grading Scale for Model
2. ARTIFICIAL NEURAL NETWORK TECHNIQUE
The Artificial Neural Network (ANN) technique is a mathematical method that mimics the
neural networks in the human brain (Galit, et al., 2018). This biological process in the brain is
exploited for the mathematical process in order to produce better output or response from a set of
input variables.
The Artificial Neural Network is developed as a learning system, the input and response values
are known and the purpose is to have the network produce the response from the input in order
for it to be robust enough for predicting the unknown responses for future inputs.
The technique assumes the existence of a hidden layer between the input and response variables
(Shaffer, 2011). The variables are taken through this hidden layer and eventually produce the
output or response. Below is a sample of an artificial neural network (Natarajan, 2012).
11
STUDY OF AUSTRALIA)
This value would represent the highest level of deterioration of a rail network.
The highest possible score for the model above would occur for when the weights and
parameters register the highest scores on the 5-point Likert Scale which is 4. Thus, the highest
possible score in the model would be:
C= ( 4 + 4+ 4+ 4 ) 4 +( 4+ 4+ 4)4
C=112
This value would represent the lowest level of deterioration of a rail network.
Therefore the resultant grading scale for the model above will be:
SCORE CONDITION
0-22.4 Highly Risky
22.5-44.8 Risky
44.9-67.2 Relatively Safe
67.3-89.6 Safe
89.7-112 Very Safe
Table 7: Grading Scale for Model
2. ARTIFICIAL NEURAL NETWORK TECHNIQUE
The Artificial Neural Network (ANN) technique is a mathematical method that mimics the
neural networks in the human brain (Galit, et al., 2018). This biological process in the brain is
exploited for the mathematical process in order to produce better output or response from a set of
input variables.
The Artificial Neural Network is developed as a learning system, the input and response values
are known and the purpose is to have the network produce the response from the input in order
for it to be robust enough for predicting the unknown responses for future inputs.
The technique assumes the existence of a hidden layer between the input and response variables
(Shaffer, 2011). The variables are taken through this hidden layer and eventually produce the
output or response. Below is a sample of an artificial neural network (Natarajan, 2012).
11
DETERIORATING OF RAILWAY INFRASTRUCTURE MODELLING (A CASE
STUDY OF AUSTRALIA)
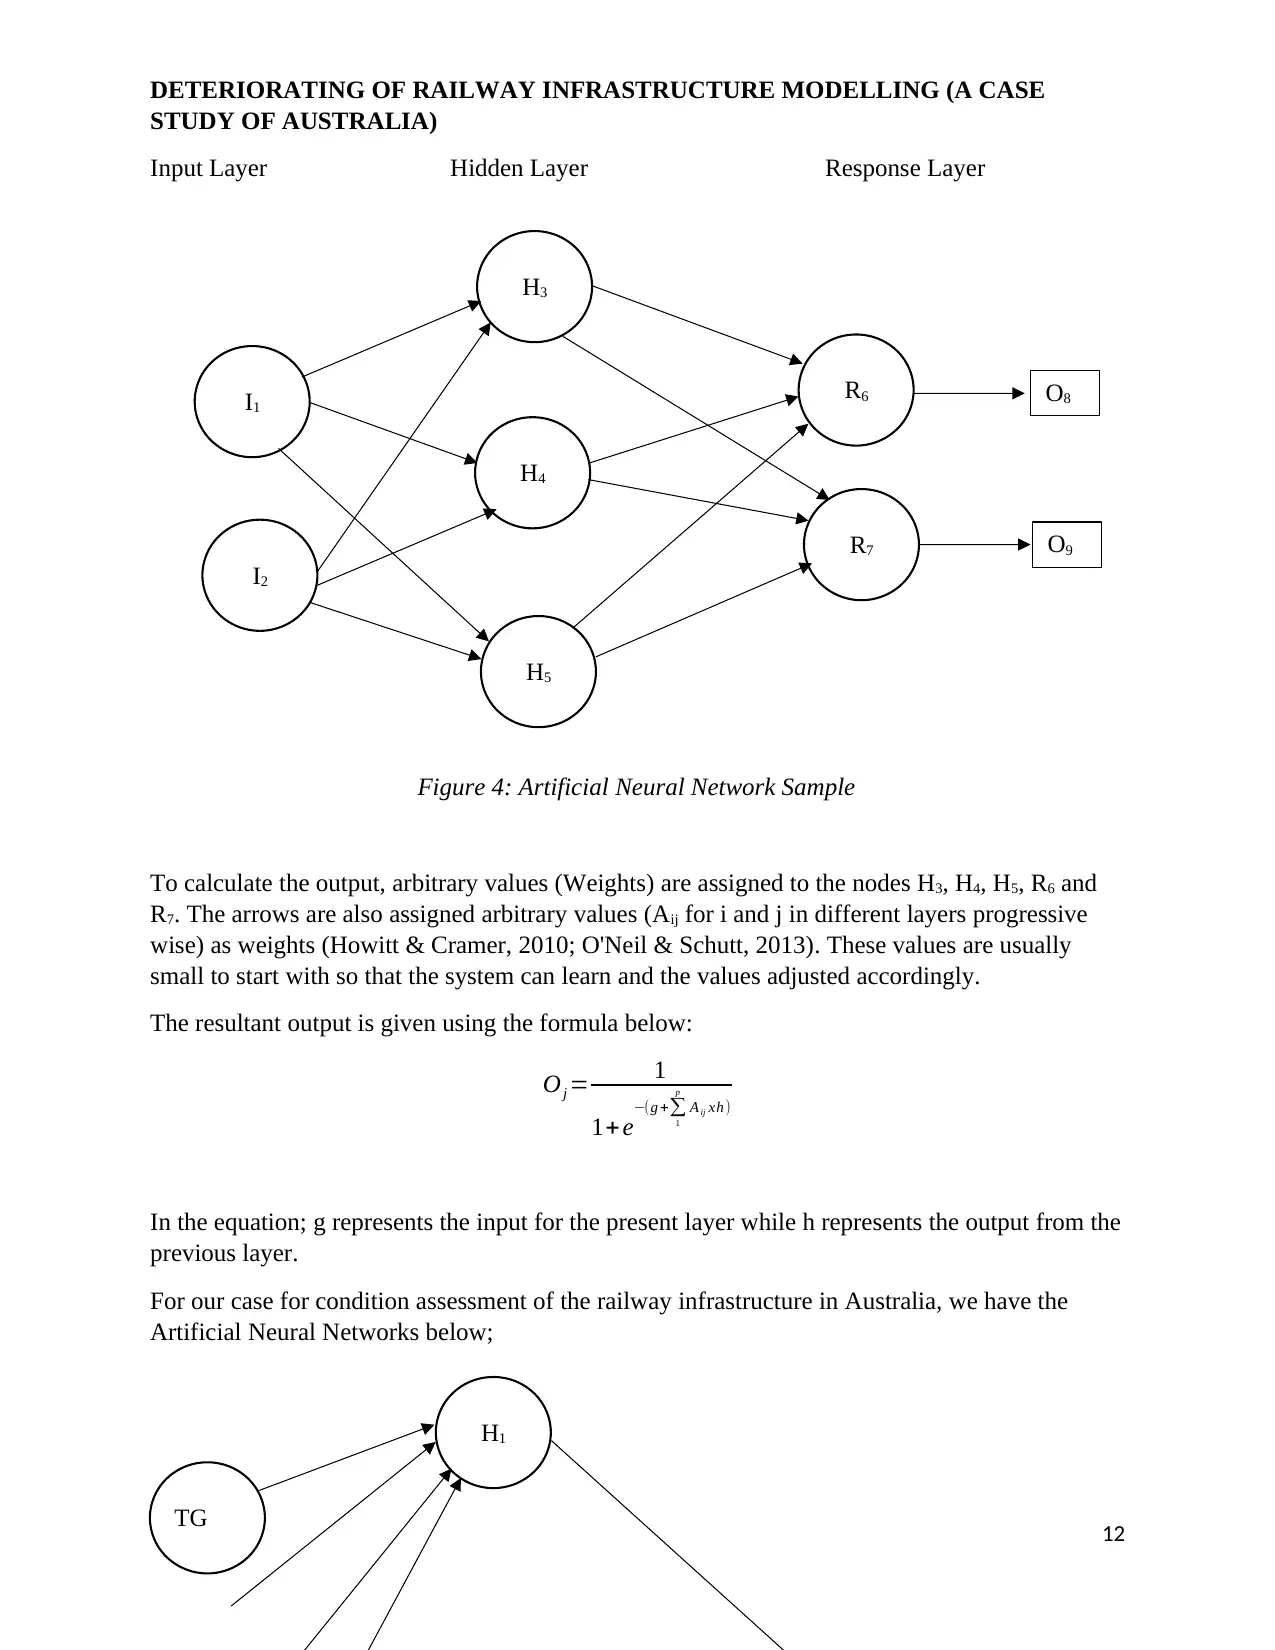
Input Layer Hidden Layer Response Layer
Figure 4: Artificial Neural Network Sample
To calculate the output, arbitrary values (Weights) are assigned to the nodes H3, H4, H5, R6 and
R7. The arrows are also assigned arbitrary values (Aij for i and j in different layers progressive
wise) as weights (Howitt & Cramer, 2010; O'Neil & Schutt, 2013). These values are usually
small to start with so that the system can learn and the values adjusted accordingly.
The resultant output is given using the formula below:
Oj = 1
1+e−(g +∑
1
p
A ij xh )
In the equation; g represents the input for the present layer while h represents the output from the
previous layer.
For our case for condition assessment of the railway infrastructure in Australia, we have the
Artificial Neural Networks below;
12
I1
I2
H3
H4
H5
R6
R7 O9
O8
TG
H1
STUDY OF AUSTRALIA)
Input Layer Hidden Layer Response Layer
Figure 4: Artificial Neural Network Sample
To calculate the output, arbitrary values (Weights) are assigned to the nodes H3, H4, H5, R6 and
R7. The arrows are also assigned arbitrary values (Aij for i and j in different layers progressive
wise) as weights (Howitt & Cramer, 2010; O'Neil & Schutt, 2013). These values are usually
small to start with so that the system can learn and the values adjusted accordingly.
The resultant output is given using the formula below:
Oj = 1
1+e−(g +∑
1
p
A ij xh )
In the equation; g represents the input for the present layer while h represents the output from the
previous layer.
For our case for condition assessment of the railway infrastructure in Australia, we have the
Artificial Neural Networks below;
12
I1
I2
H3
H4
H5
R6
R7 O9
O8
TG
H1
⊘ This is a preview!⊘
Do you want full access?
Subscribe today to unlock all pages.
Trusted by 1+ million students worldwide
1 out of 22


Your All-in-One AI-Powered Toolkit for Academic Success.
+13062052269
info@desklib.com
Available 24*7 on WhatsApp / Email
![[object Object]](/_next/static/media/star-bottom.7253800d.svg)
Unlock your academic potential
Copyright © 2020–2026 A2Z Services. All Rights Reserved. Developed and managed by ZUCOL.