Ratio Analysis for Elegant Sdn Bhd: Performance Evaluation for 2016-2017
VerifiedAdded on 2023/06/03
|11
|1576
|341
AI Summary
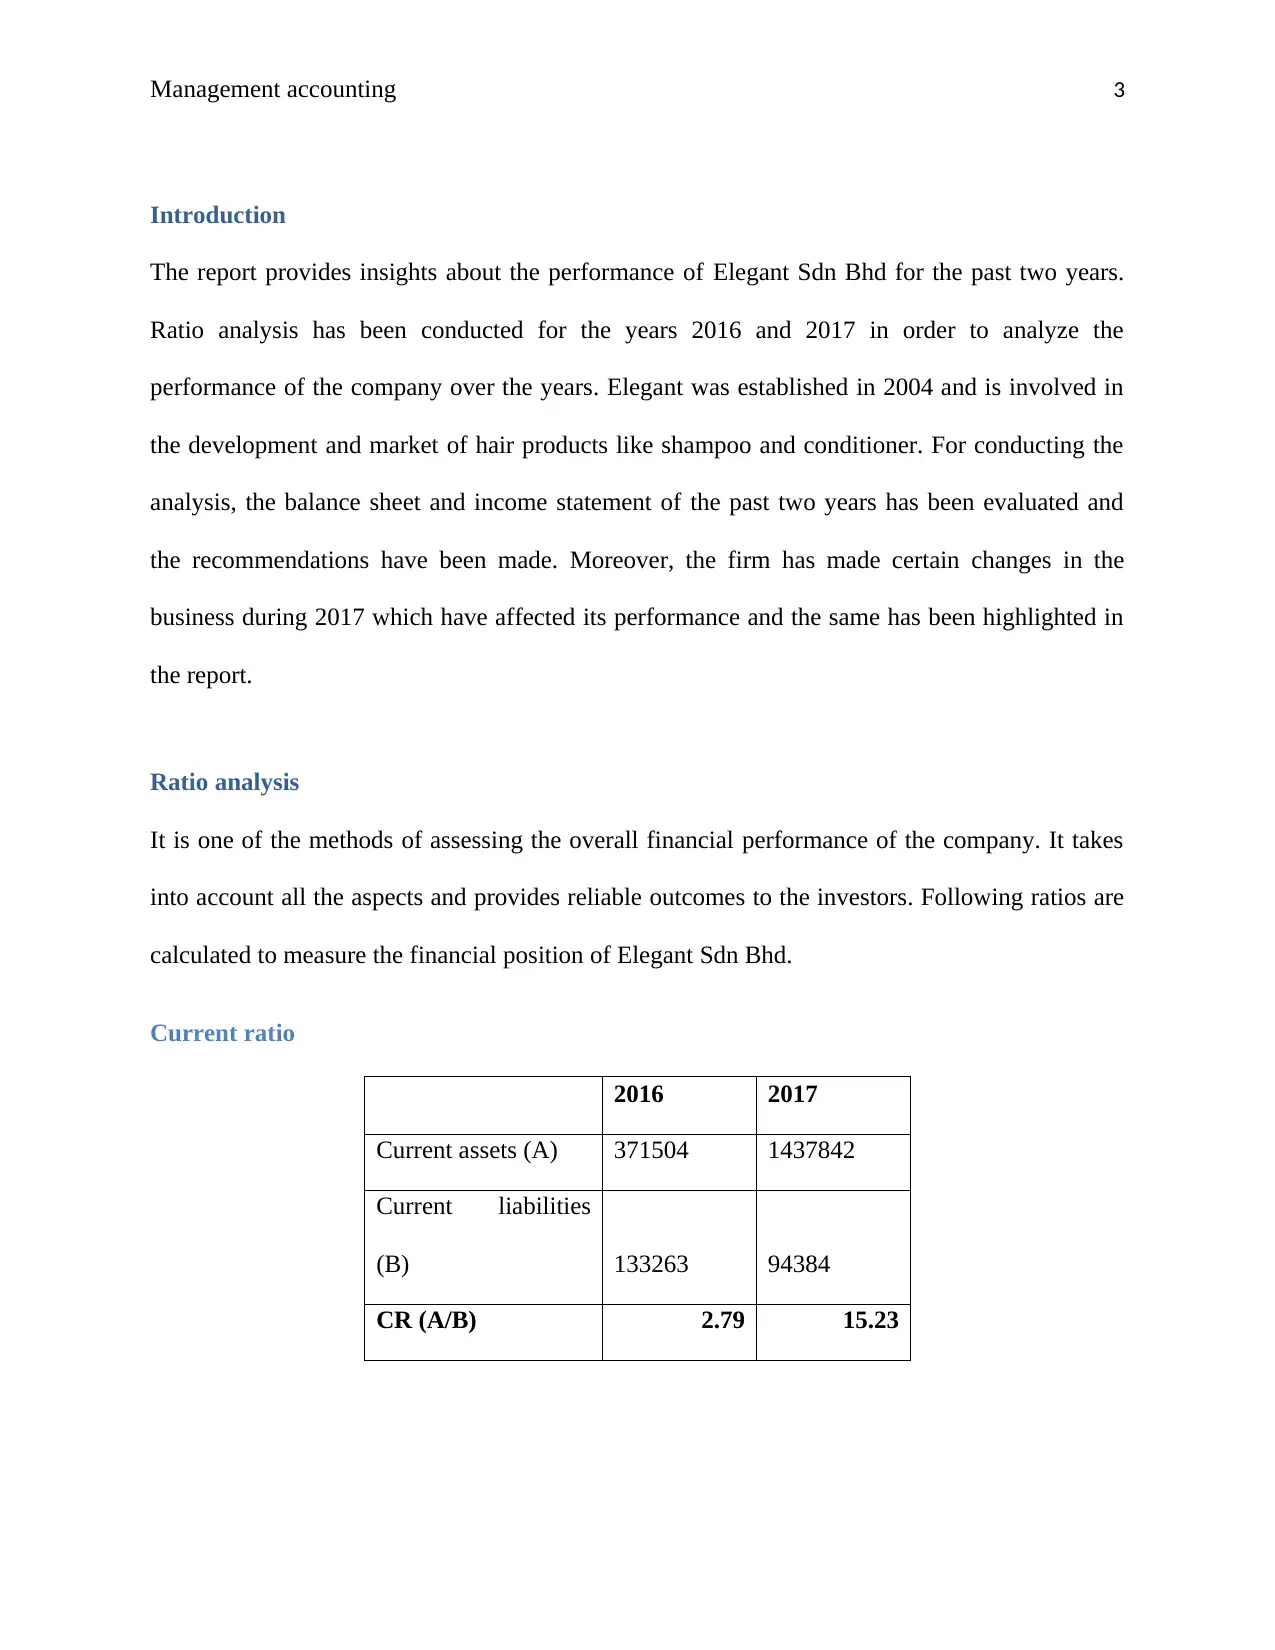
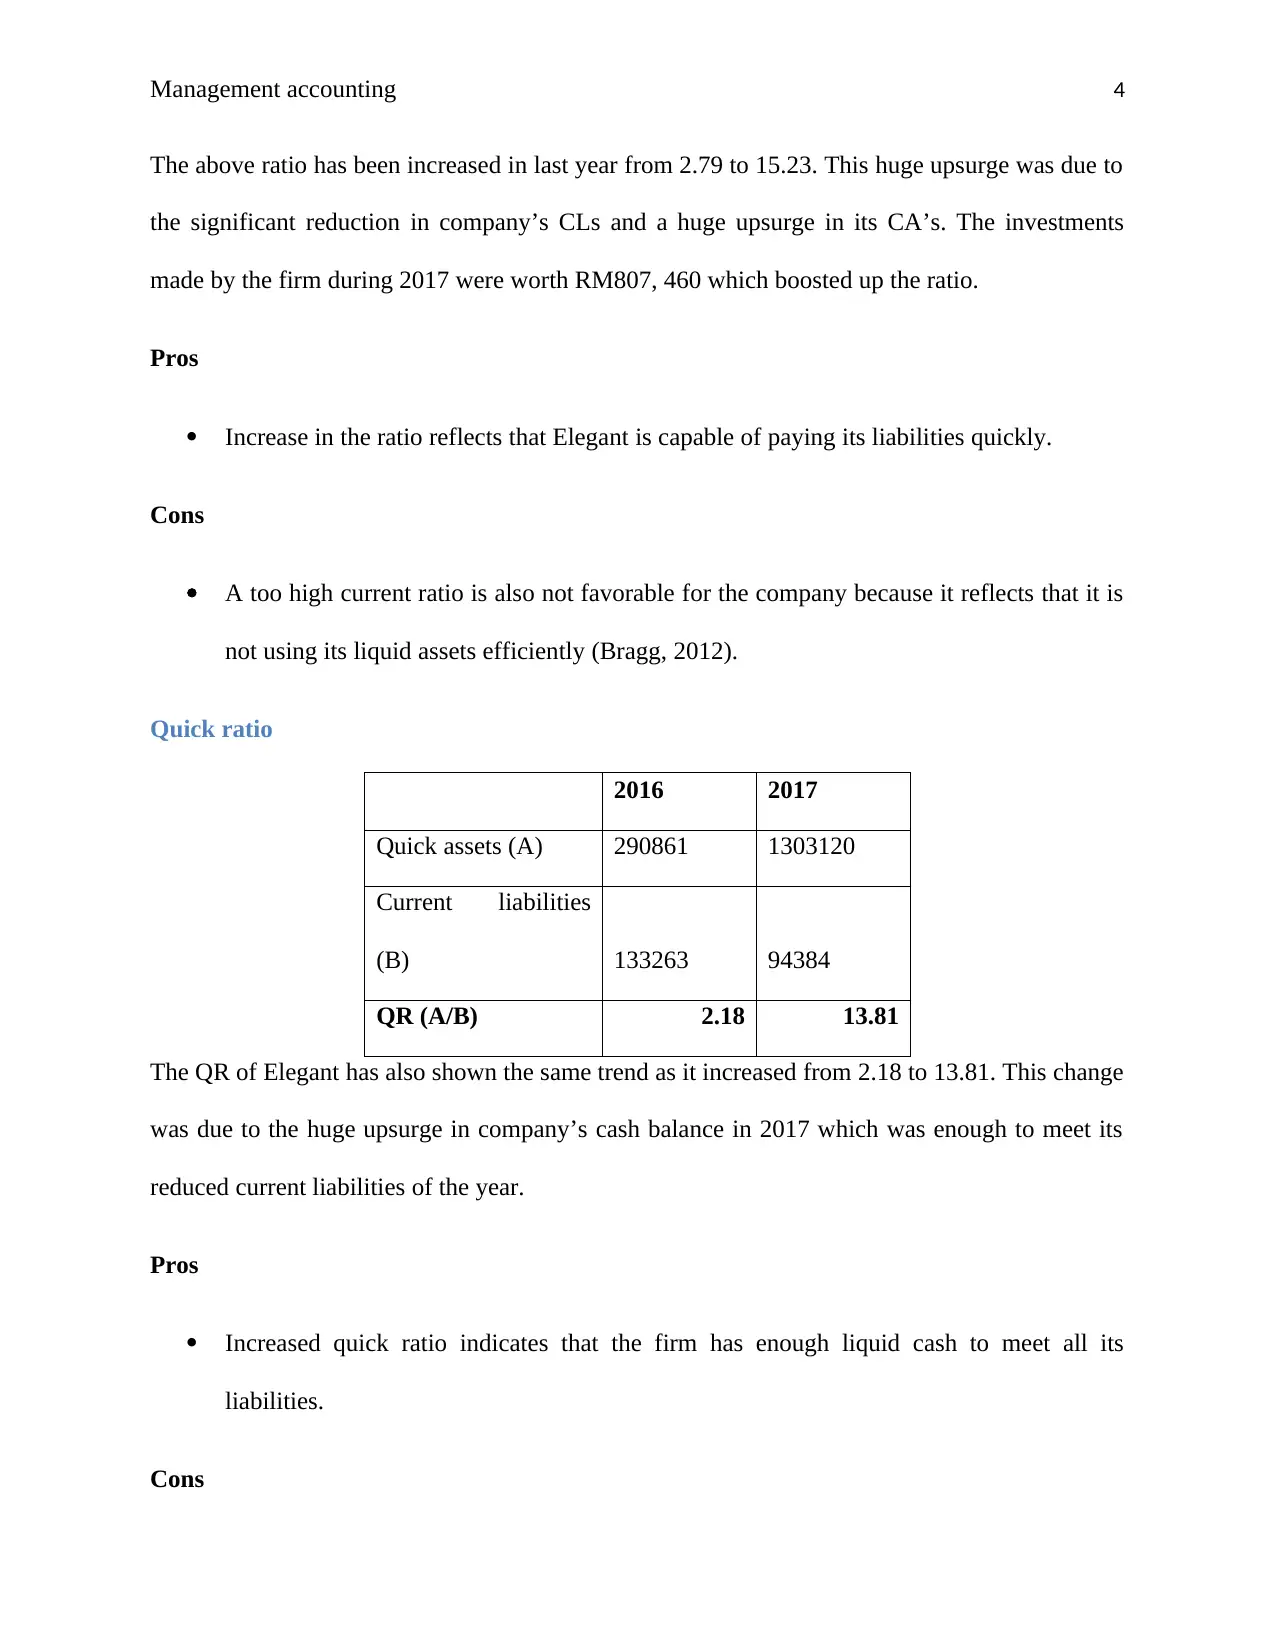
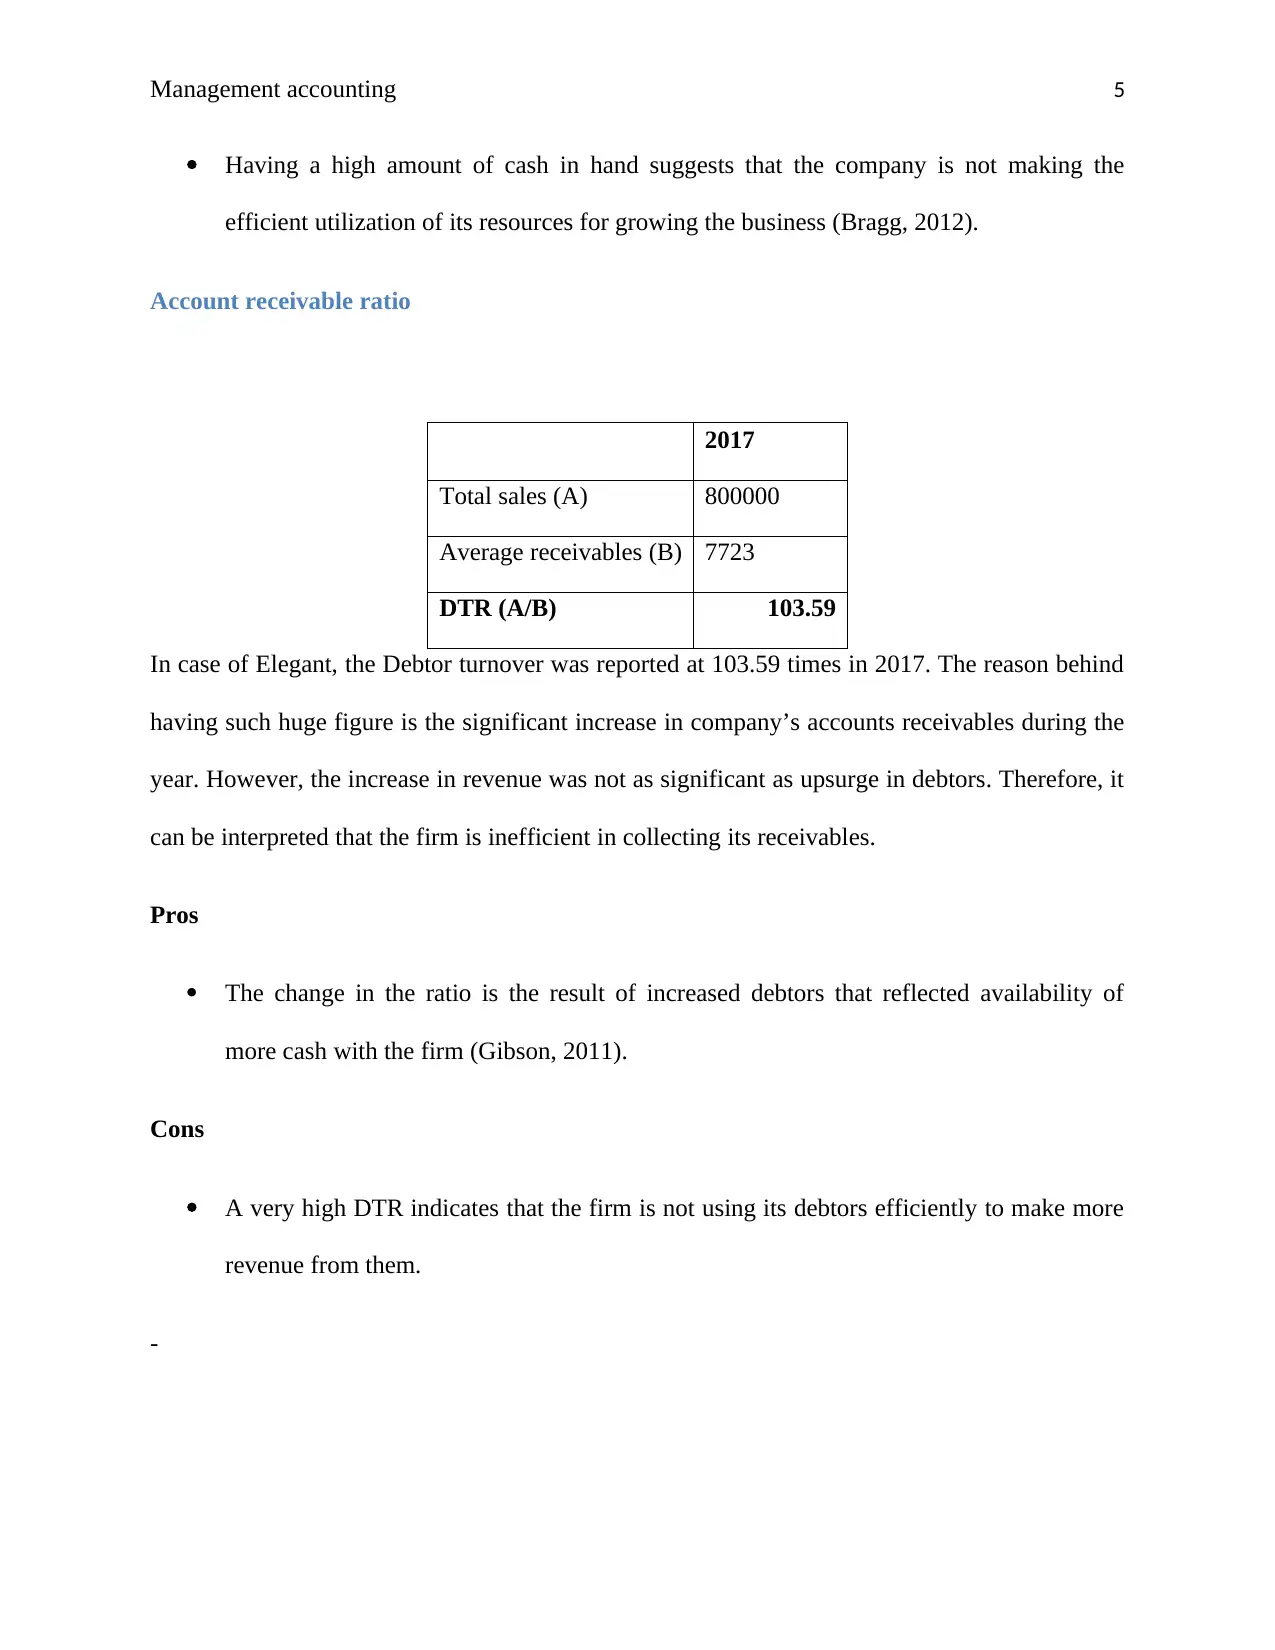
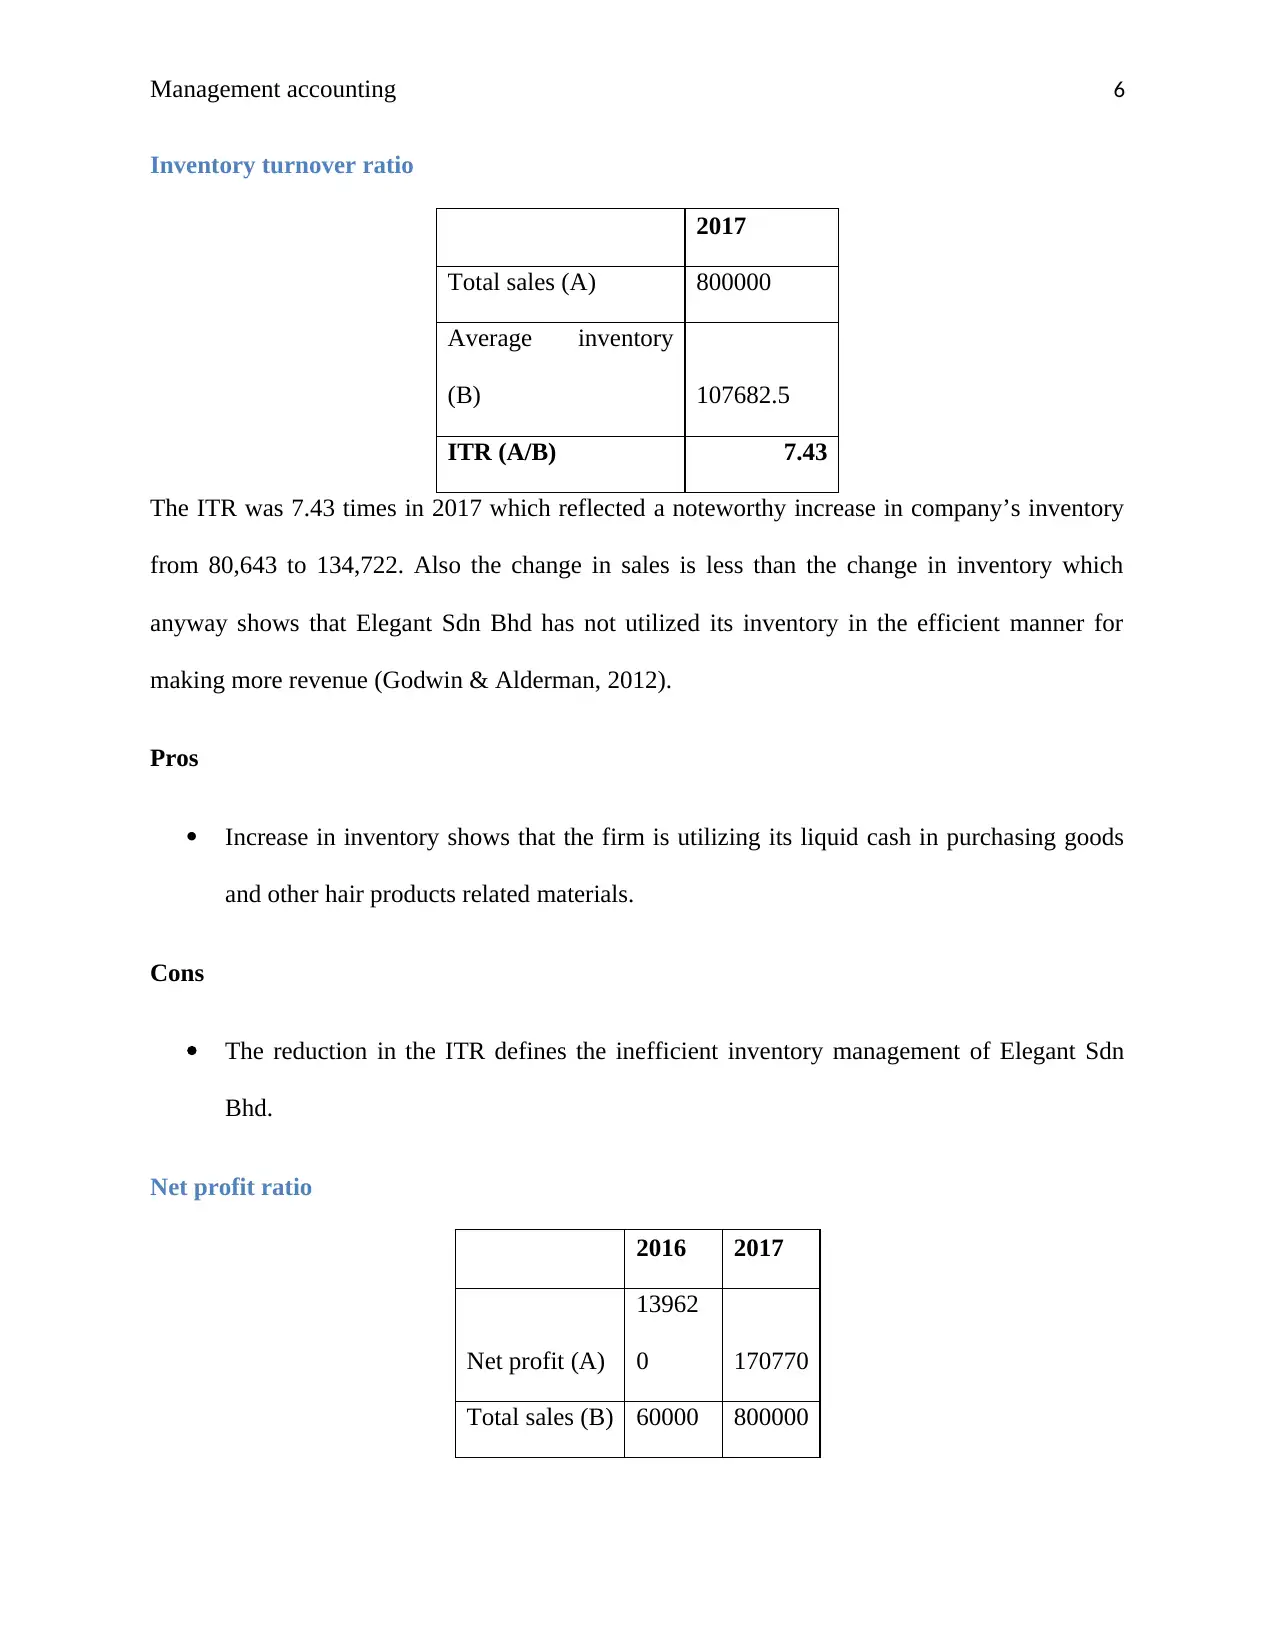
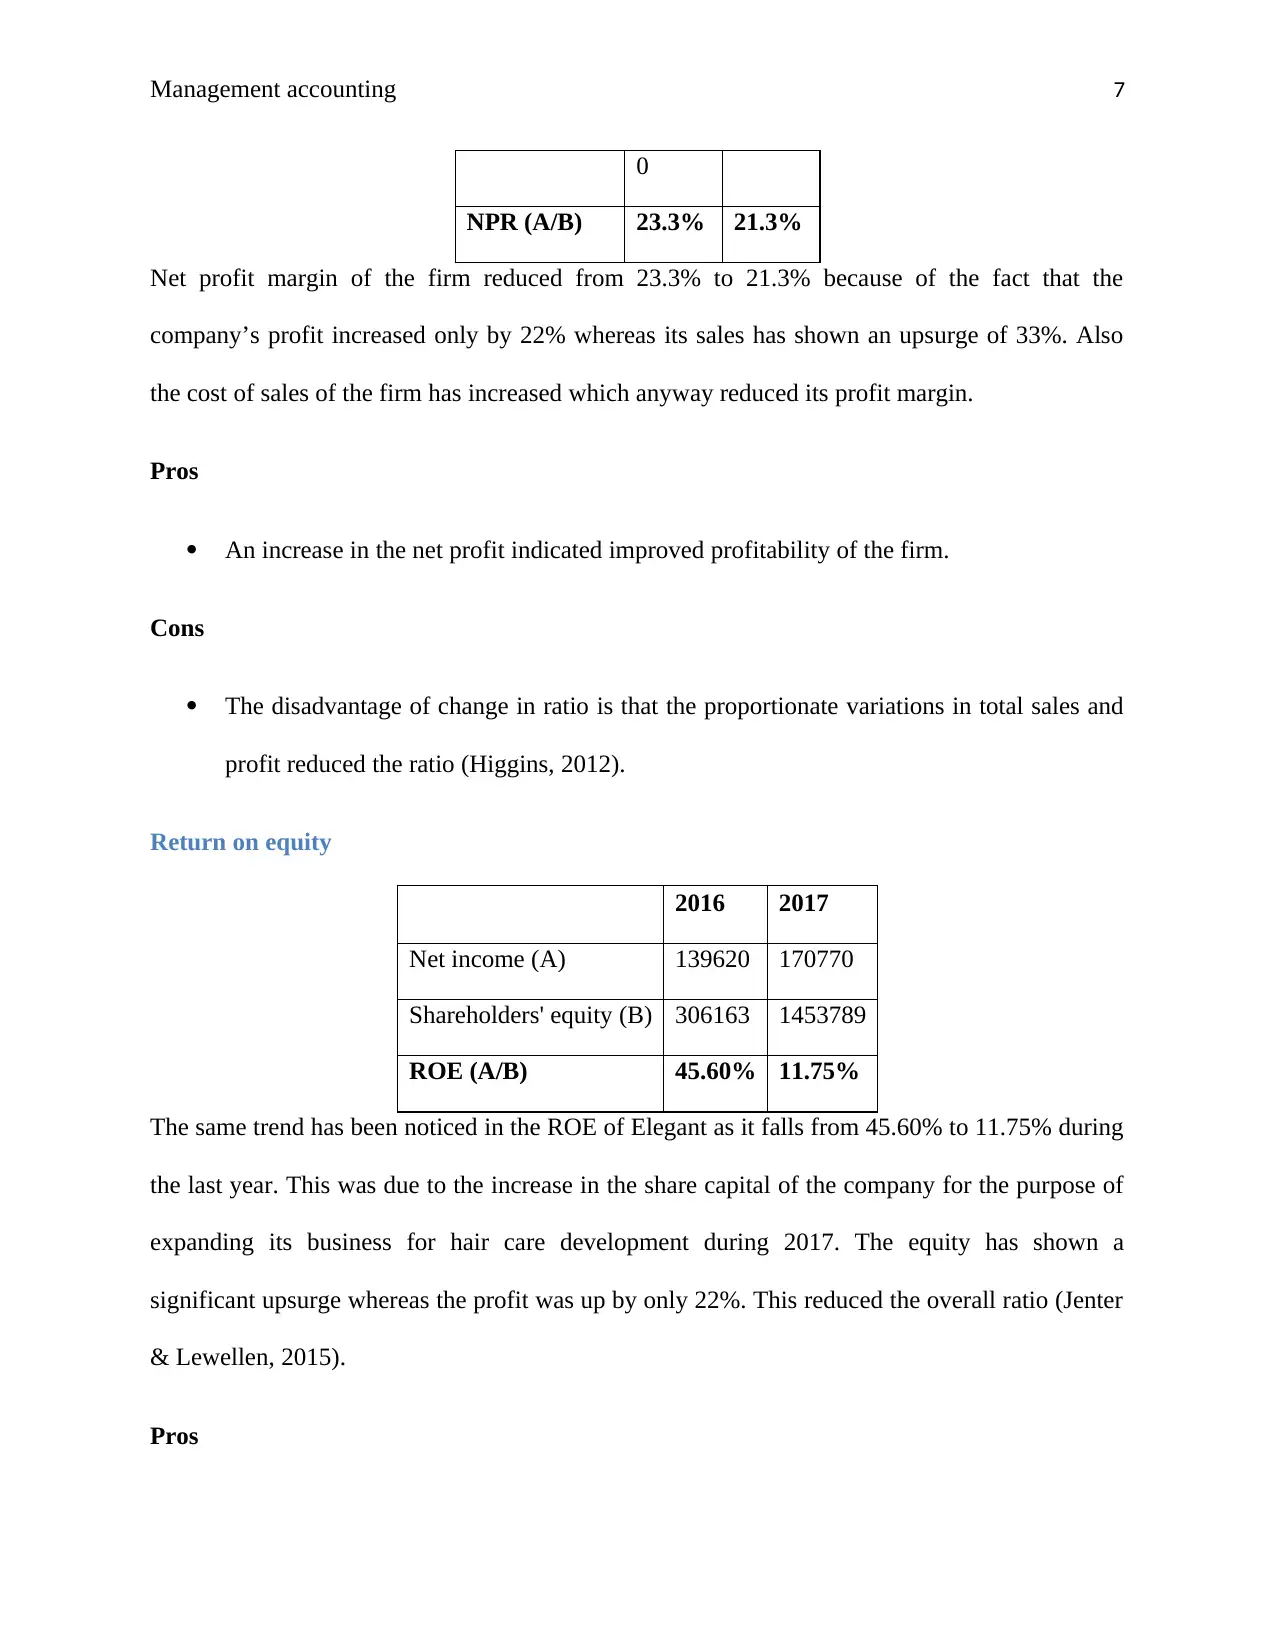
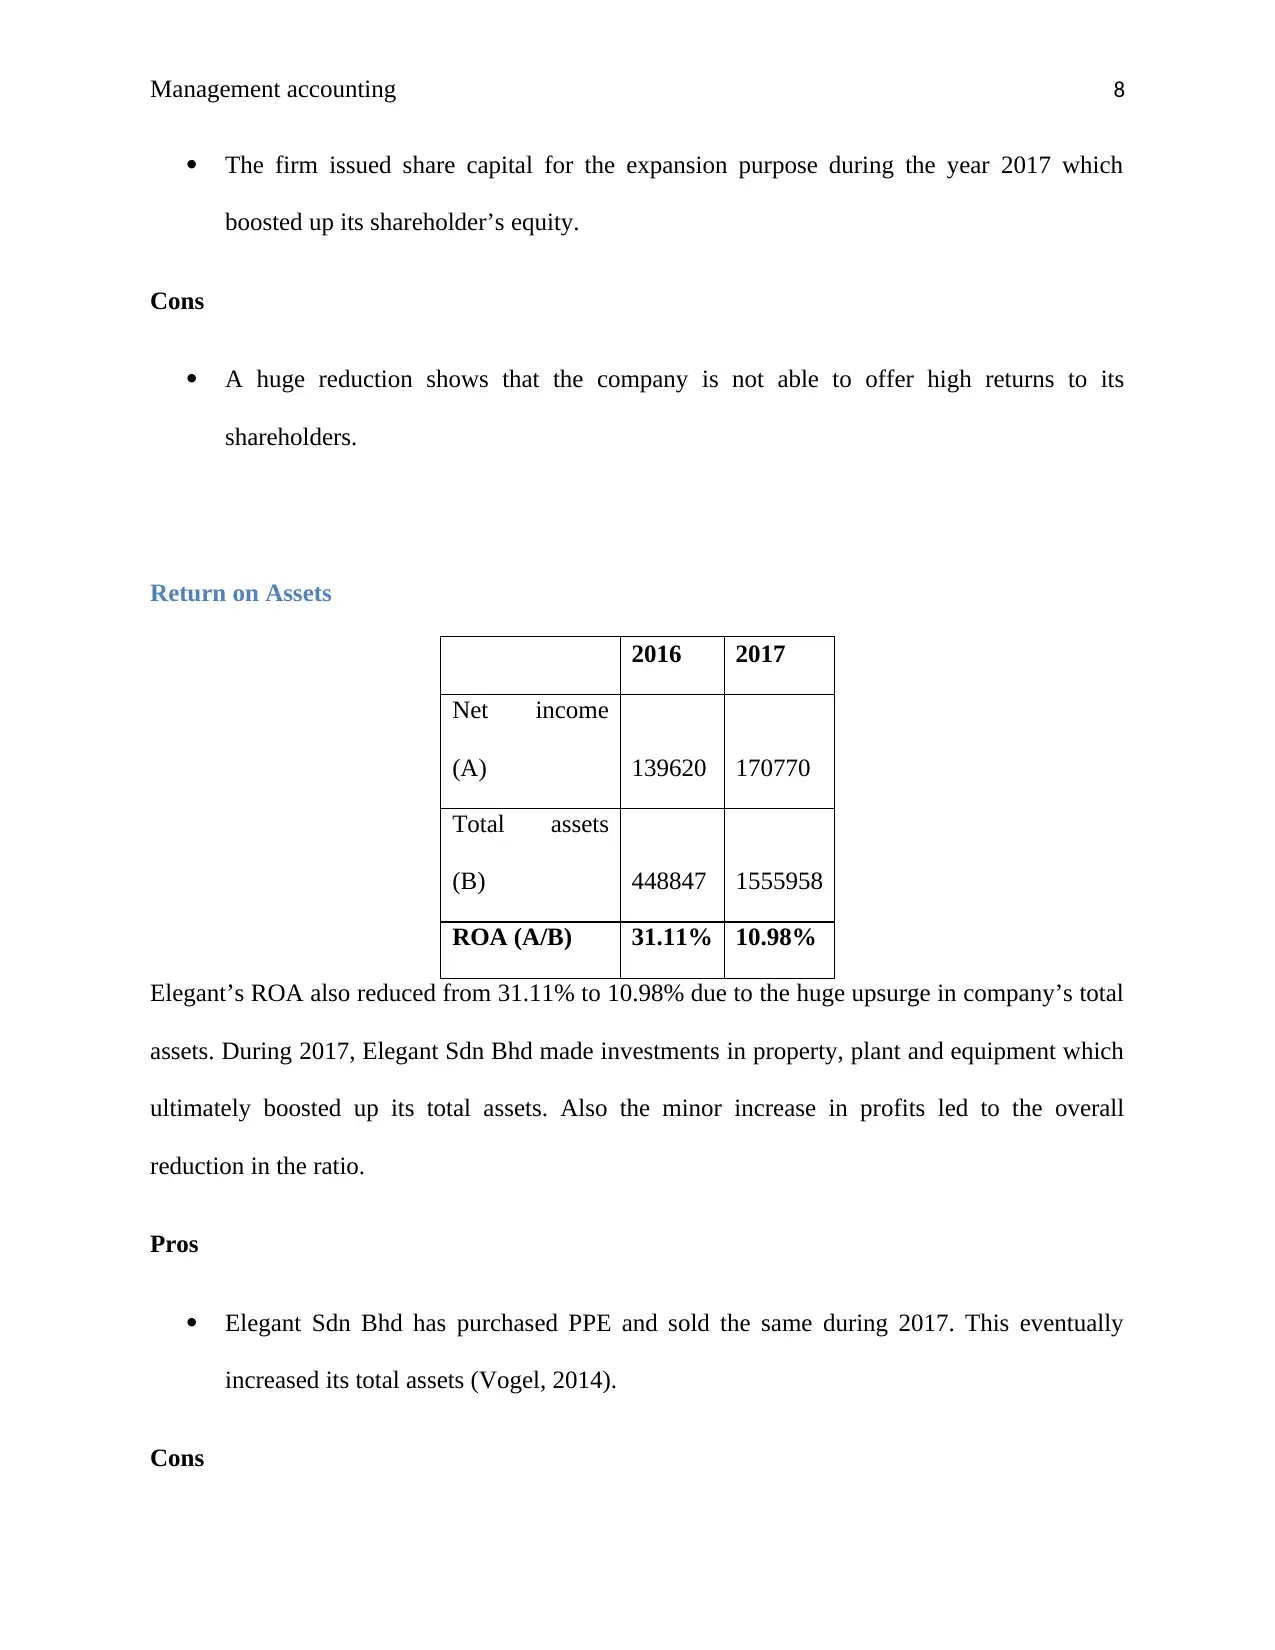
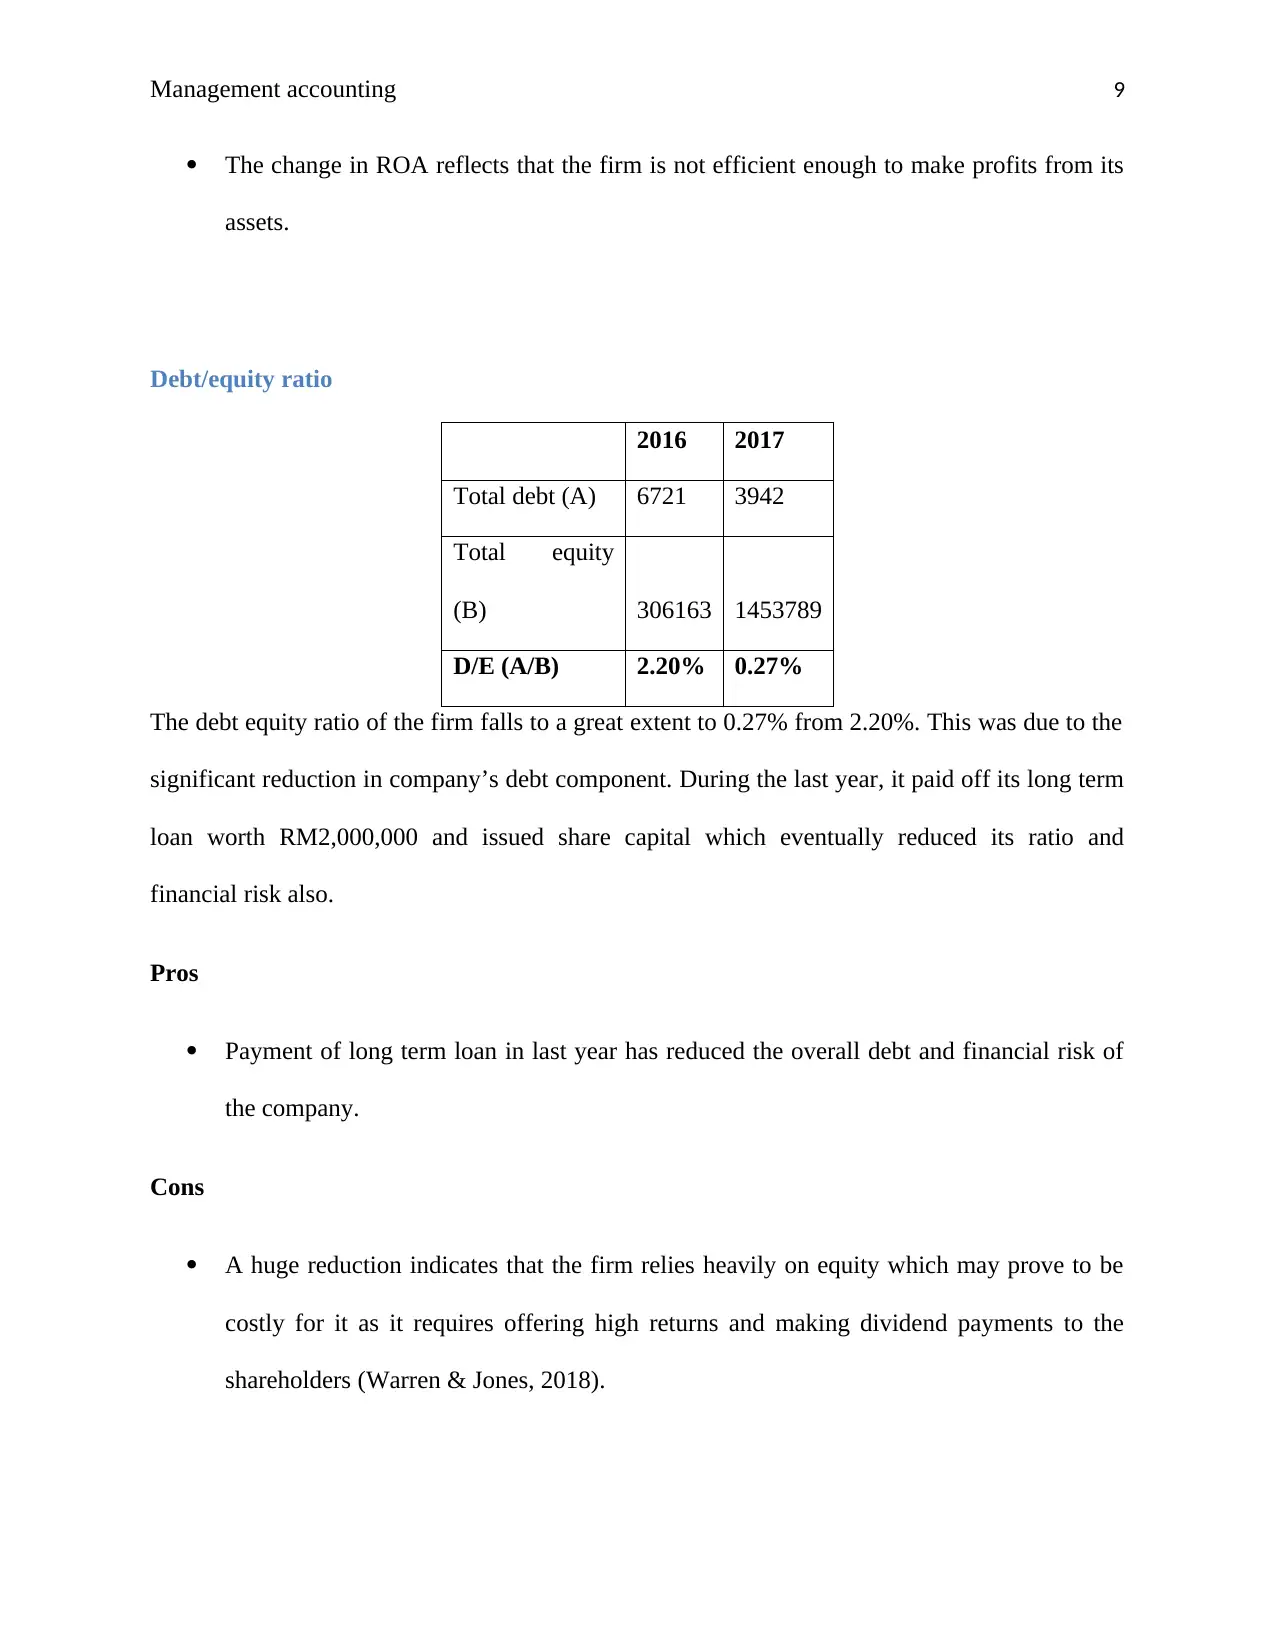
This report provides insights about the performance of Elegant Sdn Bhd for the past two years through ratio analysis. The report evaluates the financial position of the company through various ratios like current ratio, quick ratio, account receivable ratio, inventory turnover ratio, net profit ratio, return on equity, return on assets, and debt/equity ratio. The report concludes with recommendations for the company to improve its profitability and efficiency position.
Contribute Materials
Your contribution can guide someone’s learning journey. Share your
documents today.
![Document Page](https://desklib.com/media/document/docfile/pages/ratio-analysis-elegant-sdn-bhd/2024/09/10/568c65e3-a6ca-40c6-8afd-9e2f1ad0e1f0-page-1.webp)
RUNNING HEAD: MANAGEMENT ACCOUNTING
Ratio analysis
Ratio analysis
Secure Best Marks with AI Grader
Need help grading? Try our AI Grader for instant feedback on your assignments.
![Document Page](https://desklib.com/media/document/docfile/pages/ratio-analysis-elegant-sdn-bhd/2024/09/10/d939015d-f5ad-4dcf-bdff-bc1207361cd2-page-2.webp)
Management accounting 2
Contents
Introduction.................................................................................................................................................3
Ratio analysis..............................................................................................................................................3
Current ratio............................................................................................................................................3
Quick ratio...............................................................................................................................................4
Account receivable ratio..........................................................................................................................4
Inventory turnover ratio...........................................................................................................................5
Net profit ratio.........................................................................................................................................6
Return on equity......................................................................................................................................7
Return on Assets......................................................................................................................................8
Debt/equity ratio......................................................................................................................................8
Conclusion...................................................................................................................................................9
References.................................................................................................................................................10
![Document Page](https://desklib.com/media/document/docfile/pages/ratio-analysis-elegant-sdn-bhd/2024/09/10/4be0d89a-f71d-4ff1-be8a-5a78a79ab23c-page-3.webp)
Management accounting 3
Introduction
The report provides insights about the performance of Elegant Sdn Bhd for the past two years.
Ratio analysis has been conducted for the years 2016 and 2017 in order to analyze the
performance of the company over the years. Elegant was established in 2004 and is involved in
the development and market of hair products like shampoo and conditioner. For conducting the
analysis, the balance sheet and income statement of the past two years has been evaluated and
the recommendations have been made. Moreover, the firm has made certain changes in the
business during 2017 which have affected its performance and the same has been highlighted in
the report.
Ratio analysis
It is one of the methods of assessing the overall financial performance of the company. It takes
into account all the aspects and provides reliable outcomes to the investors. Following ratios are
calculated to measure the financial position of Elegant Sdn Bhd.
Current ratio
2016 2017
Current assets (A) 371504 1437842
Current liabilities
(B) 133263 94384
CR (A/B) 2.79 15.23
![Document Page](https://desklib.com/media/document/docfile/pages/ratio-analysis-elegant-sdn-bhd/2024/09/10/3c5402a5-7658-491e-8063-072abac117af-page-4.webp)
Management accounting 4
The above ratio has been increased in last year from 2.79 to 15.23. This huge upsurge was due to
the significant reduction in company’s CLs and a huge upsurge in its CA’s. The investments
made by the firm during 2017 were worth RM807, 460 which boosted up the ratio.
Pros
Increase in the ratio reflects that Elegant is capable of paying its liabilities quickly.
Cons
A too high current ratio is also not favorable for the company because it reflects that it is
not using its liquid assets efficiently (Bragg, 2012).
Quick ratio
2016 2017
Quick assets (A) 290861 1303120
Current liabilities
(B) 133263 94384
QR (A/B) 2.18 13.81
The QR of Elegant has also shown the same trend as it increased from 2.18 to 13.81. This change
was due to the huge upsurge in company’s cash balance in 2017 which was enough to meet its
reduced current liabilities of the year.
Pros
Increased quick ratio indicates that the firm has enough liquid cash to meet all its
liabilities.
Cons
Secure Best Marks with AI Grader
Need help grading? Try our AI Grader for instant feedback on your assignments.
![Document Page](https://desklib.com/media/document/docfile/pages/ratio-analysis-elegant-sdn-bhd/2024/09/10/3cfbb9a4-474e-487b-8ba3-fb8539f19e33-page-5.webp)
Management accounting 5
Having a high amount of cash in hand suggests that the company is not making the
efficient utilization of its resources for growing the business (Bragg, 2012).
Account receivable ratio
2017
Total sales (A) 800000
Average receivables (B) 7723
DTR (A/B) 103.59
In case of Elegant, the Debtor turnover was reported at 103.59 times in 2017. The reason behind
having such huge figure is the significant increase in company’s accounts receivables during the
year. However, the increase in revenue was not as significant as upsurge in debtors. Therefore, it
can be interpreted that the firm is inefficient in collecting its receivables.
Pros
The change in the ratio is the result of increased debtors that reflected availability of
more cash with the firm (Gibson, 2011).
Cons
A very high DTR indicates that the firm is not using its debtors efficiently to make more
revenue from them.
-
![Document Page](https://desklib.com/media/document/docfile/pages/ratio-analysis-elegant-sdn-bhd/2024/09/10/887b548d-c255-4704-8e9e-29775403d494-page-6.webp)
Management accounting 6
Inventory turnover ratio
2017
Total sales (A) 800000
Average inventory
(B) 107682.5
ITR (A/B) 7.43
The ITR was 7.43 times in 2017 which reflected a noteworthy increase in company’s inventory
from 80,643 to 134,722. Also the change in sales is less than the change in inventory which
anyway shows that Elegant Sdn Bhd has not utilized its inventory in the efficient manner for
making more revenue (Godwin & Alderman, 2012).
Pros
Increase in inventory shows that the firm is utilizing its liquid cash in purchasing goods
and other hair products related materials.
Cons
The reduction in the ITR defines the inefficient inventory management of Elegant Sdn
Bhd.
Net profit ratio
2016 2017
Net profit (A)
13962
0 170770
Total sales (B) 60000 800000
![Document Page](https://desklib.com/media/document/docfile/pages/ratio-analysis-elegant-sdn-bhd/2024/09/10/0216490a-be0d-4594-9d72-48c3750f2f30-page-7.webp)
Management accounting 7
0
NPR (A/B) 23.3% 21.3%
Net profit margin of the firm reduced from 23.3% to 21.3% because of the fact that the
company’s profit increased only by 22% whereas its sales has shown an upsurge of 33%. Also
the cost of sales of the firm has increased which anyway reduced its profit margin.
Pros
An increase in the net profit indicated improved profitability of the firm.
Cons
The disadvantage of change in ratio is that the proportionate variations in total sales and
profit reduced the ratio (Higgins, 2012).
Return on equity
2016 2017
Net income (A) 139620 170770
Shareholders' equity (B) 306163 1453789
ROE (A/B) 45.60% 11.75%
The same trend has been noticed in the ROE of Elegant as it falls from 45.60% to 11.75% during
the last year. This was due to the increase in the share capital of the company for the purpose of
expanding its business for hair care development during 2017. The equity has shown a
significant upsurge whereas the profit was up by only 22%. This reduced the overall ratio (Jenter
& Lewellen, 2015).
Pros
Paraphrase This Document
Need a fresh take? Get an instant paraphrase of this document with our AI Paraphraser
![Document Page](https://desklib.com/media/document/docfile/pages/ratio-analysis-elegant-sdn-bhd/2024/09/10/11239066-d1b8-4e86-b13e-948b48f345e4-page-8.webp)
Management accounting 8
The firm issued share capital for the expansion purpose during the year 2017 which
boosted up its shareholder’s equity.
Cons
A huge reduction shows that the company is not able to offer high returns to its
shareholders.
Return on Assets
2016 2017
Net income
(A) 139620 170770
Total assets
(B) 448847 1555958
ROA (A/B) 31.11% 10.98%
Elegant’s ROA also reduced from 31.11% to 10.98% due to the huge upsurge in company’s total
assets. During 2017, Elegant Sdn Bhd made investments in property, plant and equipment which
ultimately boosted up its total assets. Also the minor increase in profits led to the overall
reduction in the ratio.
Pros
Elegant Sdn Bhd has purchased PPE and sold the same during 2017. This eventually
increased its total assets (Vogel, 2014).
Cons
![Document Page](https://desklib.com/media/document/docfile/pages/ratio-analysis-elegant-sdn-bhd/2024/09/10/28dd4b17-a1fe-4bd3-a62d-888de5c76500-page-9.webp)
Management accounting 9
The change in ROA reflects that the firm is not efficient enough to make profits from its
assets.
Debt/equity ratio
2016 2017
Total debt (A) 6721 3942
Total equity
(B) 306163 1453789
D/E (A/B) 2.20% 0.27%
The debt equity ratio of the firm falls to a great extent to 0.27% from 2.20%. This was due to the
significant reduction in company’s debt component. During the last year, it paid off its long term
loan worth RM2,000,000 and issued share capital which eventually reduced its ratio and
financial risk also.
Pros
Payment of long term loan in last year has reduced the overall debt and financial risk of
the company.
Cons
A huge reduction indicates that the firm relies heavily on equity which may prove to be
costly for it as it requires offering high returns and making dividend payments to the
shareholders (Warren & Jones, 2018).
![Document Page](https://desklib.com/media/document/docfile/pages/ratio-analysis-elegant-sdn-bhd/2024/09/10/5ec9707b-d9a3-4425-95a9-20438d9e60b8-page-10.webp)
Management accounting 10
Conclusion
From the above report, it can be concluded that Elegant needs to focus on its profitability and
efficiency position as it has to generate more revenue from its resources. Also, it needs to
improvise its capital structure, keeping the financial risk at low level.
References
Bragg, S. M. (2012). Business ratios and formulas: a comprehensive guide (Vol. 577). New
Jersy: John Wiley & Sons.
Bragg, S. M. (2012). Financial analysis: a controller's guide. New Jersy: John Wiley & Sons.
Gibson, C. H. (2011). Financial reporting and analysis. USA: South-Western Cengage
Learning.
Godwin, N., & Alderman, C. (2012). Financial ACCT2. USA: Cengage Learning.
Higgins, R. C. (2012). Analysis for financial management. New York: McGraw-Hill/Irwin.
Jenter, D. & Lewellen, K. (2015). CEO preferences and acquisitions. The Journal of
Finance, 70(6), pp.2813-2852.
Secure Best Marks with AI Grader
Need help grading? Try our AI Grader for instant feedback on your assignments.
![Document Page](https://desklib.com/media/document/docfile/pages/ratio-analysis-elegant-sdn-bhd/2024/09/10/47bbd8de-b470-4000-b64a-5fc9d8a909e6-page-11.webp)
Management accounting 11
Vogel, H.L. (2014). Entertainment industry economics: A guide for financial analysis. New
York: Cambridge University Press.
Warren, C. S., & Jones, J. (2018). Corporate financial accounting. USA: Cengage Learning.
Vogel, H.L. (2014). Entertainment industry economics: A guide for financial analysis. New
York: Cambridge University Press.
Warren, C. S., & Jones, J. (2018). Corporate financial accounting. USA: Cengage Learning.
1 out of 11
Related Documents
![logo.png](/_next/image/?url=%2F_next%2Fstatic%2Fmedia%2Flogo.6d15ce61.png&w=640&q=75)
Your All-in-One AI-Powered Toolkit for Academic Success.
+13062052269
info@desklib.com
Available 24*7 on WhatsApp / Email
Unlock your academic potential
© 2024 | Zucol Services PVT LTD | All rights reserved.