Analyzing Financial Health: Ratio Analysis of RIO Tinto & BHP Billiton
VerifiedAdded on 2023/06/13
|15
|2562
|144
Report
AI Summary
This report provides a comprehensive ratio analysis of RIO Tinto and BHP Billiton, focusing on liquidity, solvency, efficiency, and profitability from 2012 to 2017. It examines key financial ratios such as current ratio, quick ratio, debt ratio, debt to equity ratio, inventory turnover ratio, total asset turnover, and net profit margin. The analysis reveals that Rio Tinto generally reported a stronger financial performance compared to BHP Billiton, with robust current and quick ratios, and a profit margin reflecting better revenue generation from its assets. BHP Billiton, while showing improvements in some areas, experienced fluctuations in profitability and asset turnover. The report concludes that both companies have unique strengths and challenges in managing their financial performance.
Running head: RATIO ANALYSIS
Ratio Analysis
Name of the Student
Name of the University
Authors Note
Course ID
Ratio Analysis
Name of the Student
Name of the University
Authors Note
Course ID
Paraphrase This Document
Need a fresh take? Get an instant paraphrase of this document with our AI Paraphraser
1RATIO ANALYSIS
Table of Contents
Introduction:...............................................................................................................................2
Liquidity ratios:..........................................................................................................................2
Current Ratio:.........................................................................................................................2
Quick Ratio:...........................................................................................................................3
Solvency ratio:...........................................................................................................................4
Debt Ratio:.............................................................................................................................4
Debt to Equity Ratio:.............................................................................................................5
Efficiency Ratio:........................................................................................................................6
Inventory Turnover Ratio:......................................................................................................6
Total Asset Turnover:............................................................................................................7
Profitability ratio:.......................................................................................................................8
Net Profit Margin:..................................................................................................................9
Return on Assets:...................................................................................................................9
Conclusion:..............................................................................................................................10
Reference List:.........................................................................................................................12
Appendix:.................................................................................................................................13
2RATIO ANALYSIS
Introduction:
The current report is based on the analysis of the ratio for RIO Tinto and BHP
Billiton. The ratios will be based on the areas of profitability, solvency, liquidity and
efficiency ratio. Figures extracted are from the annual published statements of the respective
companies.
Liquidity ratios:
Liquidity ratio can be defined as the ratio that is used to determine the ability of the
company in meeting its ability to pay debt (Gitman et al., 2015).
Current Ratio:
The current ratio is generally used to determine the ability of the company in paying
back its liabilities with the assets (Henderson et al., 2015).
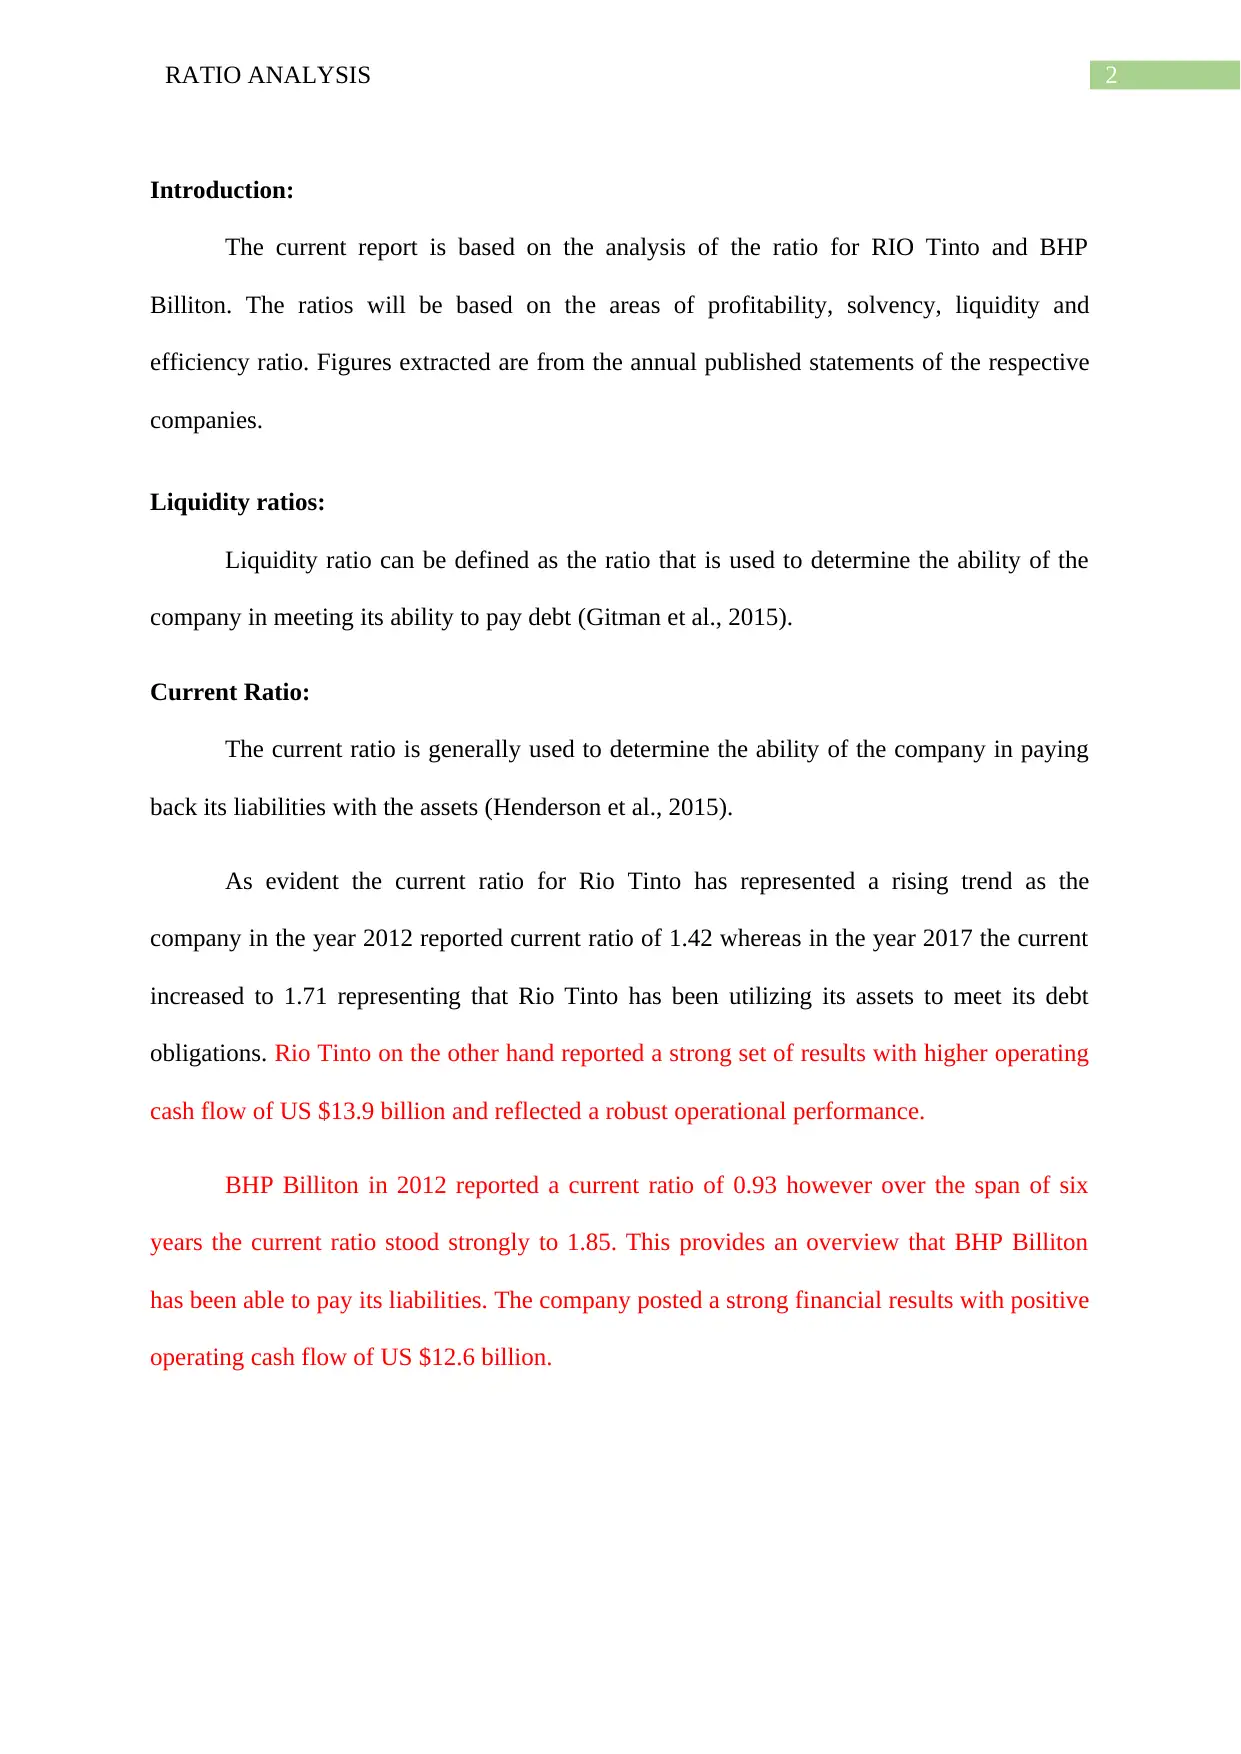
As evident the current ratio for Rio Tinto has represented a rising trend as the
company in the year 2012 reported current ratio of 1.42 whereas in the year 2017 the current
increased to 1.71 representing that Rio Tinto has been utilizing its assets to meet its debt
obligations. Rio Tinto on the other hand reported a strong set of results with higher operating
cash flow of US $13.9 billion and reflected a robust operational performance.
BHP Billiton in 2012 reported a current ratio of 0.93 however over the span of six
years the current ratio stood strongly to 1.85. This provides an overview that BHP Billiton
has been able to pay its liabilities. The company posted a strong financial results with positive
operating cash flow of US $12.6 billion.
Introduction:
The current report is based on the analysis of the ratio for RIO Tinto and BHP
Billiton. The ratios will be based on the areas of profitability, solvency, liquidity and
efficiency ratio. Figures extracted are from the annual published statements of the respective
companies.
Liquidity ratios:
Liquidity ratio can be defined as the ratio that is used to determine the ability of the
company in meeting its ability to pay debt (Gitman et al., 2015).
Current Ratio:
The current ratio is generally used to determine the ability of the company in paying
back its liabilities with the assets (Henderson et al., 2015).
As evident the current ratio for Rio Tinto has represented a rising trend as the
company in the year 2012 reported current ratio of 1.42 whereas in the year 2017 the current
increased to 1.71 representing that Rio Tinto has been utilizing its assets to meet its debt
obligations. Rio Tinto on the other hand reported a strong set of results with higher operating
cash flow of US $13.9 billion and reflected a robust operational performance.
BHP Billiton in 2012 reported a current ratio of 0.93 however over the span of six
years the current ratio stood strongly to 1.85. This provides an overview that BHP Billiton
has been able to pay its liabilities. The company posted a strong financial results with positive
operating cash flow of US $12.6 billion.
⊘ This is a preview!⊘
Do you want full access?
Subscribe today to unlock all pages.
Trusted by 1+ million students worldwide
3RATIO ANALYSIS
2012 2013 2014 2015 2016 2017
0.00
0.20
0.40
0.60
0.80
1.00
1.20
1.40
1.60
1.80
2.00
1.42 1.45
1.68
1.55 1.61 1.71
0.93 0.97
1.23 1.27
1.44
1.85
Current Ratio
Rio Tinto BHP
Figure 1: Figure representing Current Ratio
(Source: As Created by Author)
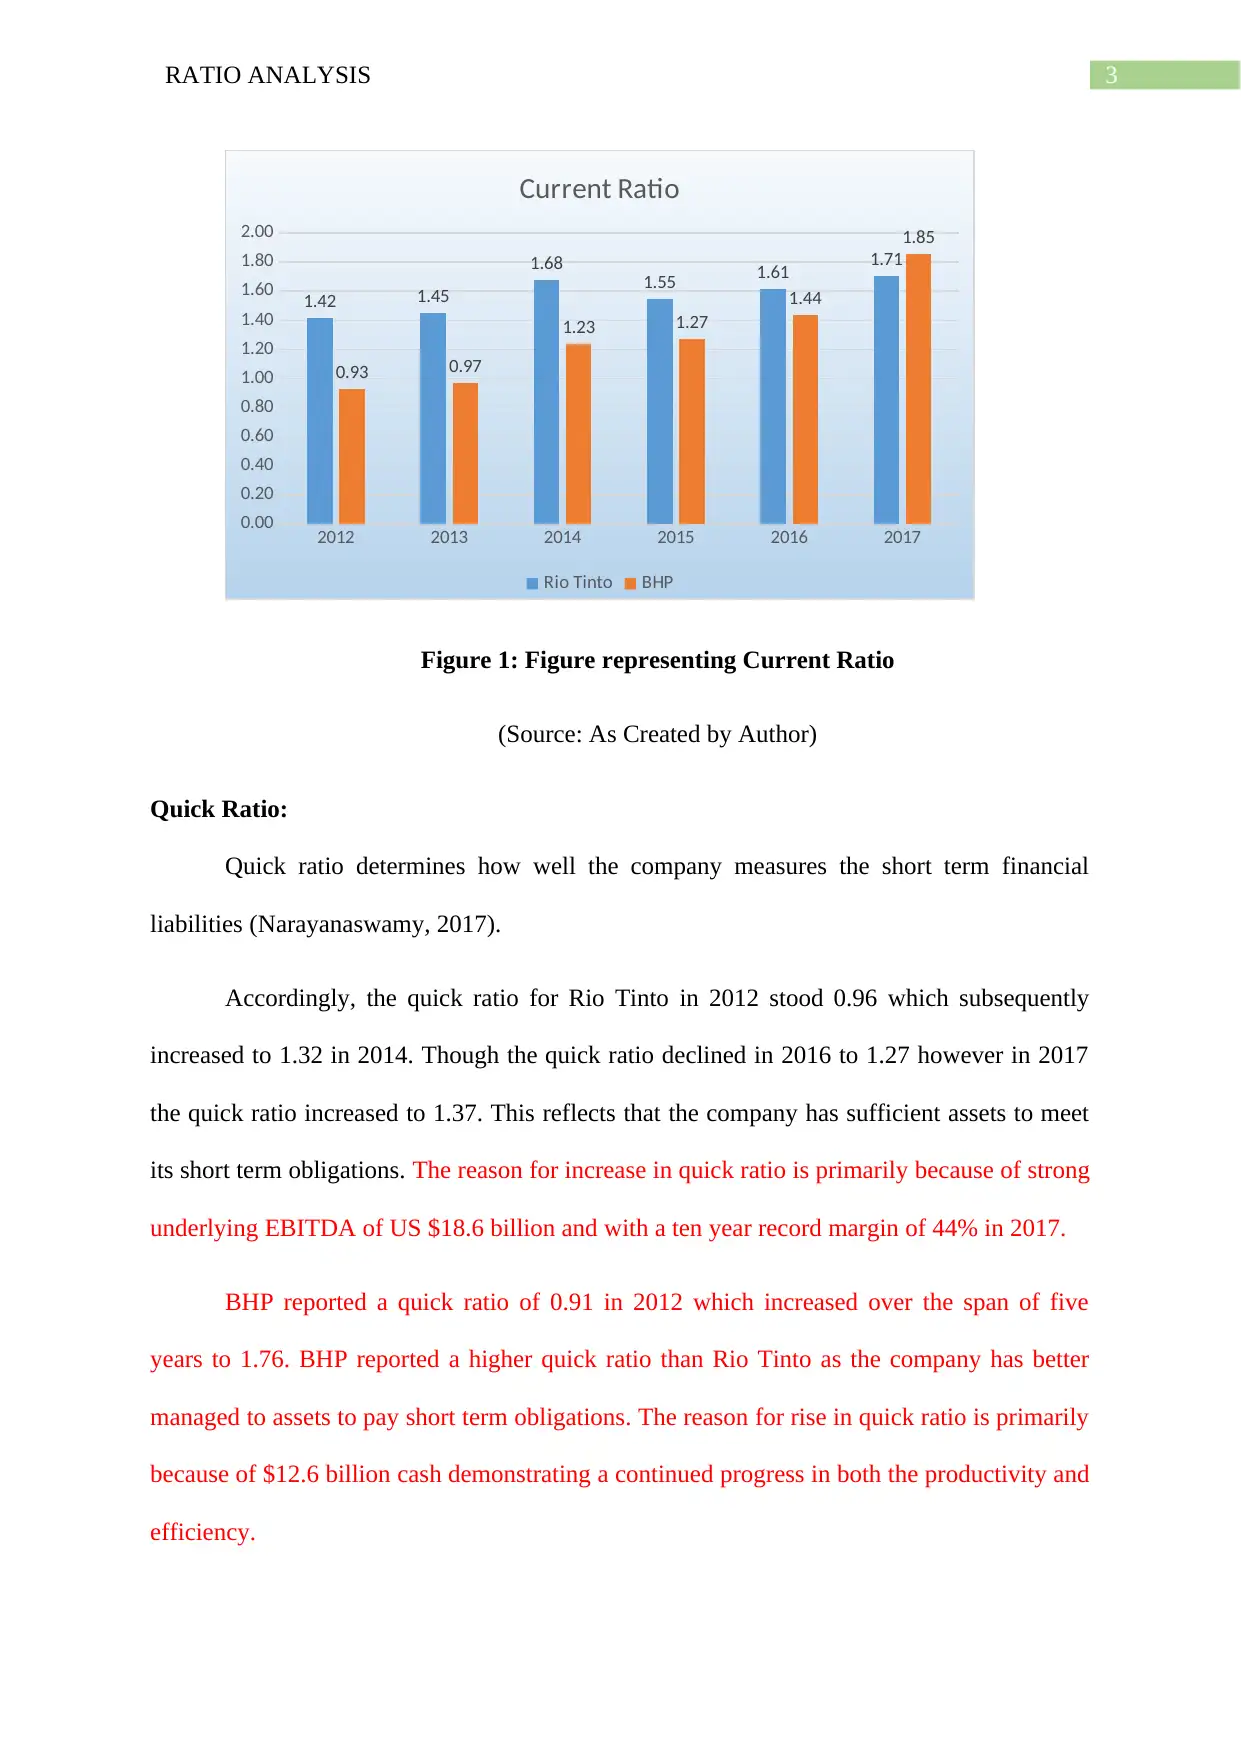
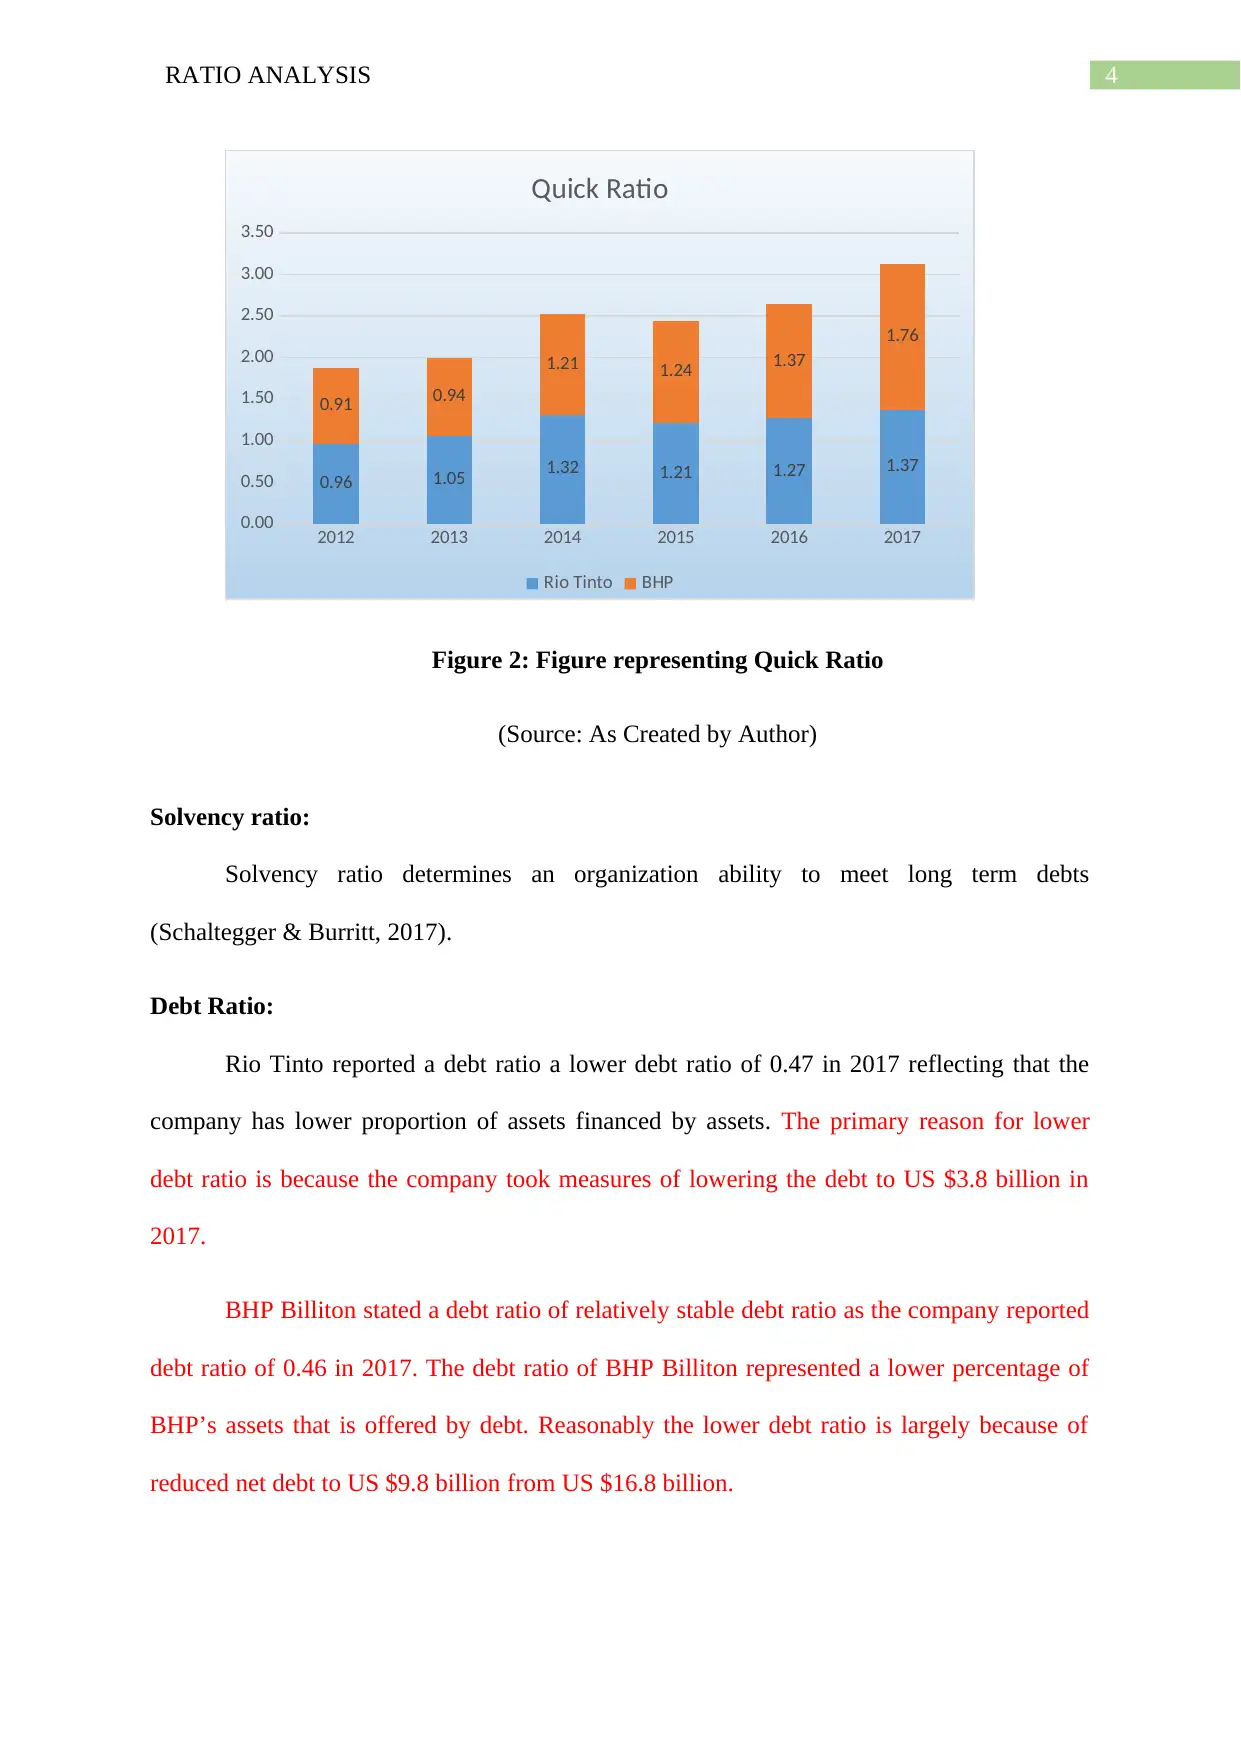
Quick Ratio:
Quick ratio determines how well the company measures the short term financial
liabilities (Narayanaswamy, 2017).
Accordingly, the quick ratio for Rio Tinto in 2012 stood 0.96 which subsequently
increased to 1.32 in 2014. Though the quick ratio declined in 2016 to 1.27 however in 2017
the quick ratio increased to 1.37. This reflects that the company has sufficient assets to meet
its short term obligations. The reason for increase in quick ratio is primarily because of strong
underlying EBITDA of US $18.6 billion and with a ten year record margin of 44% in 2017.
BHP reported a quick ratio of 0.91 in 2012 which increased over the span of five
years to 1.76. BHP reported a higher quick ratio than Rio Tinto as the company has better
managed to assets to pay short term obligations. The reason for rise in quick ratio is primarily
because of $12.6 billion cash demonstrating a continued progress in both the productivity and
efficiency.
2012 2013 2014 2015 2016 2017
0.00
0.20
0.40
0.60
0.80
1.00
1.20
1.40
1.60
1.80
2.00
1.42 1.45
1.68
1.55 1.61 1.71
0.93 0.97
1.23 1.27
1.44
1.85
Current Ratio
Rio Tinto BHP
Figure 1: Figure representing Current Ratio
(Source: As Created by Author)
Quick Ratio:
Quick ratio determines how well the company measures the short term financial
liabilities (Narayanaswamy, 2017).
Accordingly, the quick ratio for Rio Tinto in 2012 stood 0.96 which subsequently
increased to 1.32 in 2014. Though the quick ratio declined in 2016 to 1.27 however in 2017
the quick ratio increased to 1.37. This reflects that the company has sufficient assets to meet
its short term obligations. The reason for increase in quick ratio is primarily because of strong
underlying EBITDA of US $18.6 billion and with a ten year record margin of 44% in 2017.
BHP reported a quick ratio of 0.91 in 2012 which increased over the span of five
years to 1.76. BHP reported a higher quick ratio than Rio Tinto as the company has better
managed to assets to pay short term obligations. The reason for rise in quick ratio is primarily
because of $12.6 billion cash demonstrating a continued progress in both the productivity and
efficiency.
Paraphrase This Document
Need a fresh take? Get an instant paraphrase of this document with our AI Paraphraser
4RATIO ANALYSIS
2012 2013 2014 2015 2016 2017
0.00
0.50
1.00
1.50
2.00
2.50
3.00
3.50
0.96 1.05 1.32 1.21 1.27 1.37
0.91 0.94
1.21 1.24 1.37
1.76
Quick Ratio
Rio Tinto BHP
Figure 2: Figure representing Quick Ratio
(Source: As Created by Author)
Solvency ratio:
Solvency ratio determines an organization ability to meet long term debts
(Schaltegger & Burritt, 2017).
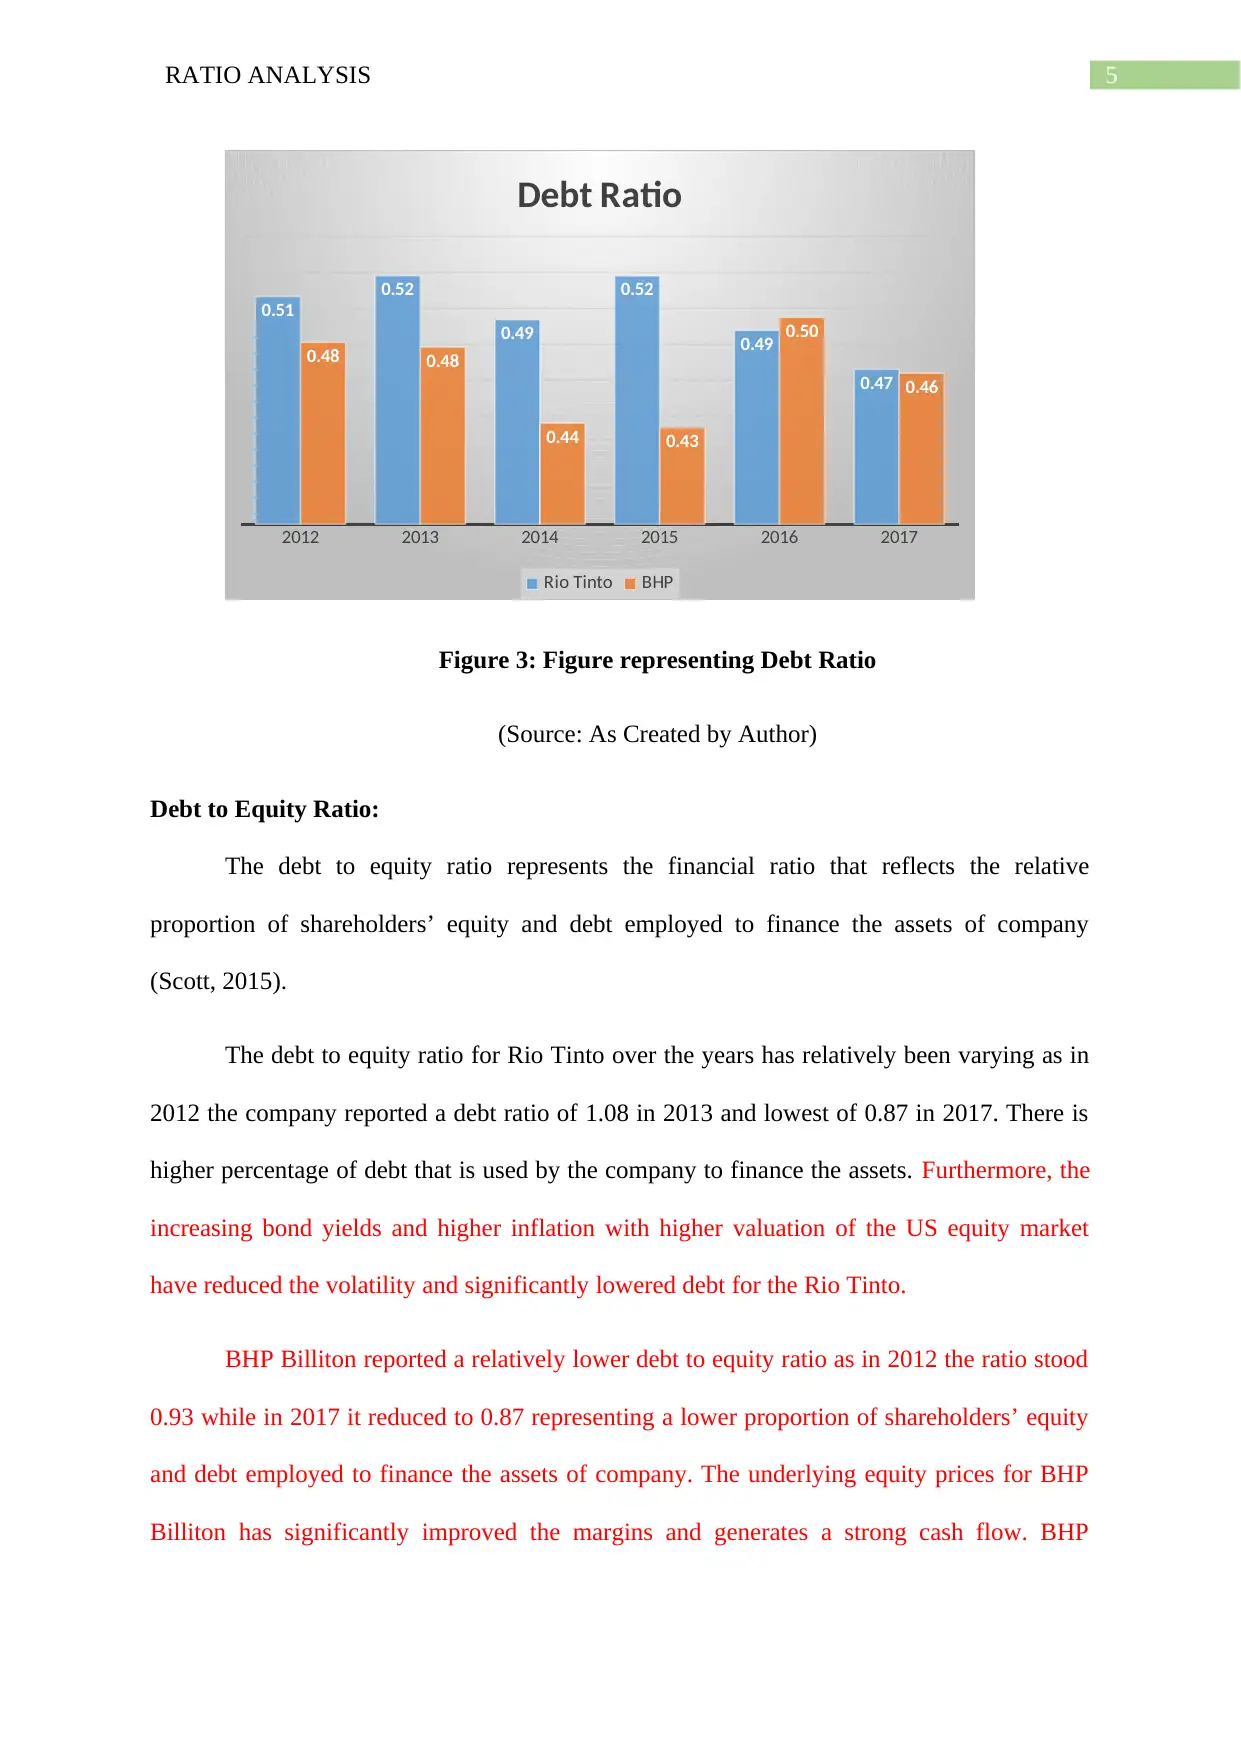
Debt Ratio:
Rio Tinto reported a debt ratio a lower debt ratio of 0.47 in 2017 reflecting that the
company has lower proportion of assets financed by assets. The primary reason for lower
debt ratio is because the company took measures of lowering the debt to US $3.8 billion in
2017.
BHP Billiton stated a debt ratio of relatively stable debt ratio as the company reported
debt ratio of 0.46 in 2017. The debt ratio of BHP Billiton represented a lower percentage of
BHP’s assets that is offered by debt. Reasonably the lower debt ratio is largely because of
reduced net debt to US $9.8 billion from US $16.8 billion.
2012 2013 2014 2015 2016 2017
0.00
0.50
1.00
1.50
2.00
2.50
3.00
3.50
0.96 1.05 1.32 1.21 1.27 1.37
0.91 0.94
1.21 1.24 1.37
1.76
Quick Ratio
Rio Tinto BHP
Figure 2: Figure representing Quick Ratio
(Source: As Created by Author)
Solvency ratio:
Solvency ratio determines an organization ability to meet long term debts
(Schaltegger & Burritt, 2017).
Debt Ratio:
Rio Tinto reported a debt ratio a lower debt ratio of 0.47 in 2017 reflecting that the
company has lower proportion of assets financed by assets. The primary reason for lower
debt ratio is because the company took measures of lowering the debt to US $3.8 billion in
2017.
BHP Billiton stated a debt ratio of relatively stable debt ratio as the company reported
debt ratio of 0.46 in 2017. The debt ratio of BHP Billiton represented a lower percentage of
BHP’s assets that is offered by debt. Reasonably the lower debt ratio is largely because of
reduced net debt to US $9.8 billion from US $16.8 billion.
5RATIO ANALYSIS
2012 2013 2014 2015 2016 2017
0.51
0.52
0.49
0.52
0.49
0.47
0.48 0.48
0.44 0.43
0.50
0.46
Debt Ratio
Rio Tinto BHP
Figure 3: Figure representing Debt Ratio
(Source: As Created by Author)
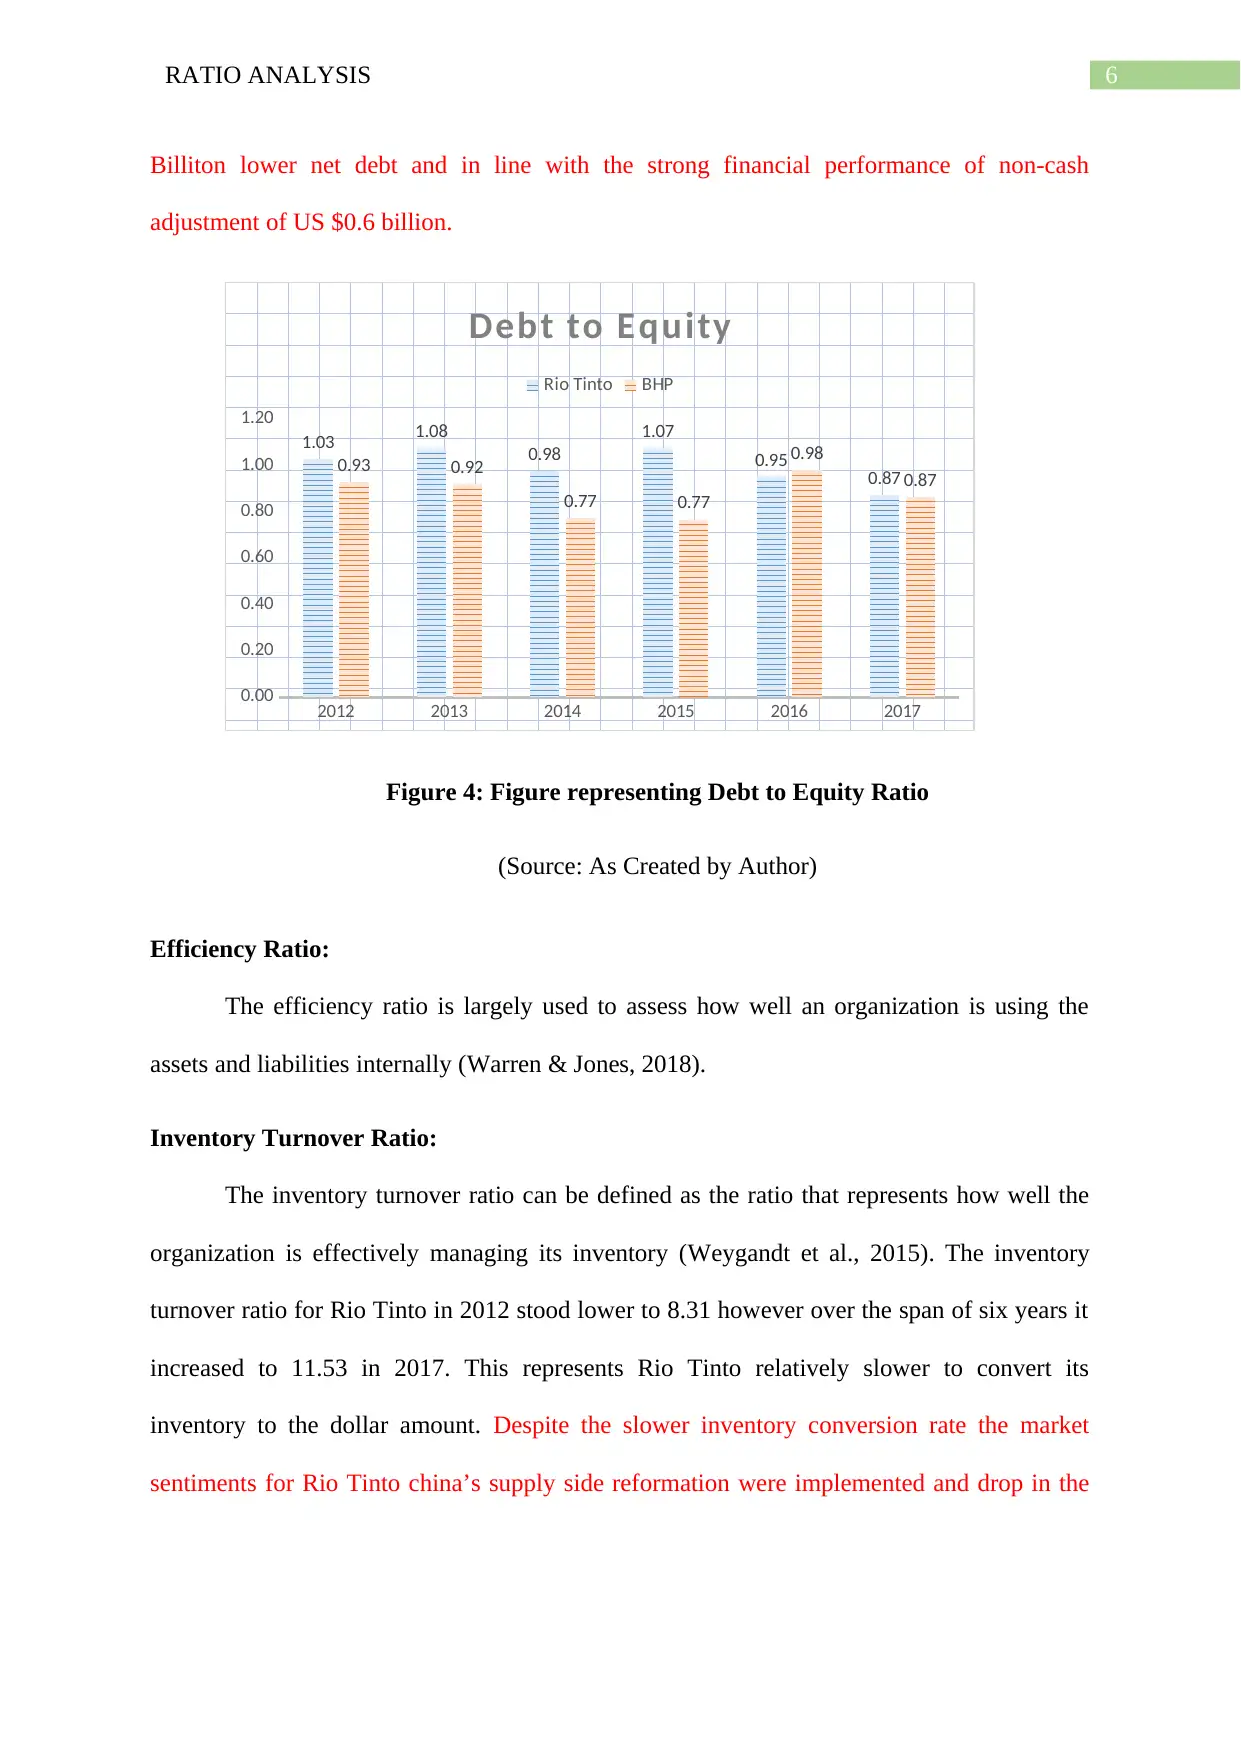
Debt to Equity Ratio:
The debt to equity ratio represents the financial ratio that reflects the relative
proportion of shareholders’ equity and debt employed to finance the assets of company
(Scott, 2015).
The debt to equity ratio for Rio Tinto over the years has relatively been varying as in
2012 the company reported a debt ratio of 1.08 in 2013 and lowest of 0.87 in 2017. There is
higher percentage of debt that is used by the company to finance the assets. Furthermore, the
increasing bond yields and higher inflation with higher valuation of the US equity market
have reduced the volatility and significantly lowered debt for the Rio Tinto.
BHP Billiton reported a relatively lower debt to equity ratio as in 2012 the ratio stood
0.93 while in 2017 it reduced to 0.87 representing a lower proportion of shareholders’ equity
and debt employed to finance the assets of company. The underlying equity prices for BHP
Billiton has significantly improved the margins and generates a strong cash flow. BHP
2012 2013 2014 2015 2016 2017
0.51
0.52
0.49
0.52
0.49
0.47
0.48 0.48
0.44 0.43
0.50
0.46
Debt Ratio
Rio Tinto BHP
Figure 3: Figure representing Debt Ratio
(Source: As Created by Author)
Debt to Equity Ratio:
The debt to equity ratio represents the financial ratio that reflects the relative
proportion of shareholders’ equity and debt employed to finance the assets of company
(Scott, 2015).
The debt to equity ratio for Rio Tinto over the years has relatively been varying as in
2012 the company reported a debt ratio of 1.08 in 2013 and lowest of 0.87 in 2017. There is
higher percentage of debt that is used by the company to finance the assets. Furthermore, the
increasing bond yields and higher inflation with higher valuation of the US equity market
have reduced the volatility and significantly lowered debt for the Rio Tinto.
BHP Billiton reported a relatively lower debt to equity ratio as in 2012 the ratio stood
0.93 while in 2017 it reduced to 0.87 representing a lower proportion of shareholders’ equity
and debt employed to finance the assets of company. The underlying equity prices for BHP
Billiton has significantly improved the margins and generates a strong cash flow. BHP
⊘ This is a preview!⊘
Do you want full access?
Subscribe today to unlock all pages.
Trusted by 1+ million students worldwide
6RATIO ANALYSIS
Billiton lower net debt and in line with the strong financial performance of non-cash
adjustment of US $0.6 billion.
2012 2013 2014 2015 2016 2017
0.00
0.20
0.40
0.60
0.80
1.00
1.20
1.03 1.08
0.98
1.07
0.95 0.87
0.93 0.92
0.77 0.77
0.98
0.87
Debt to Equity
Rio Tinto BHP
Figure 4: Figure representing Debt to Equity Ratio
(Source: As Created by Author)
Efficiency Ratio:
The efficiency ratio is largely used to assess how well an organization is using the
assets and liabilities internally (Warren & Jones, 2018).
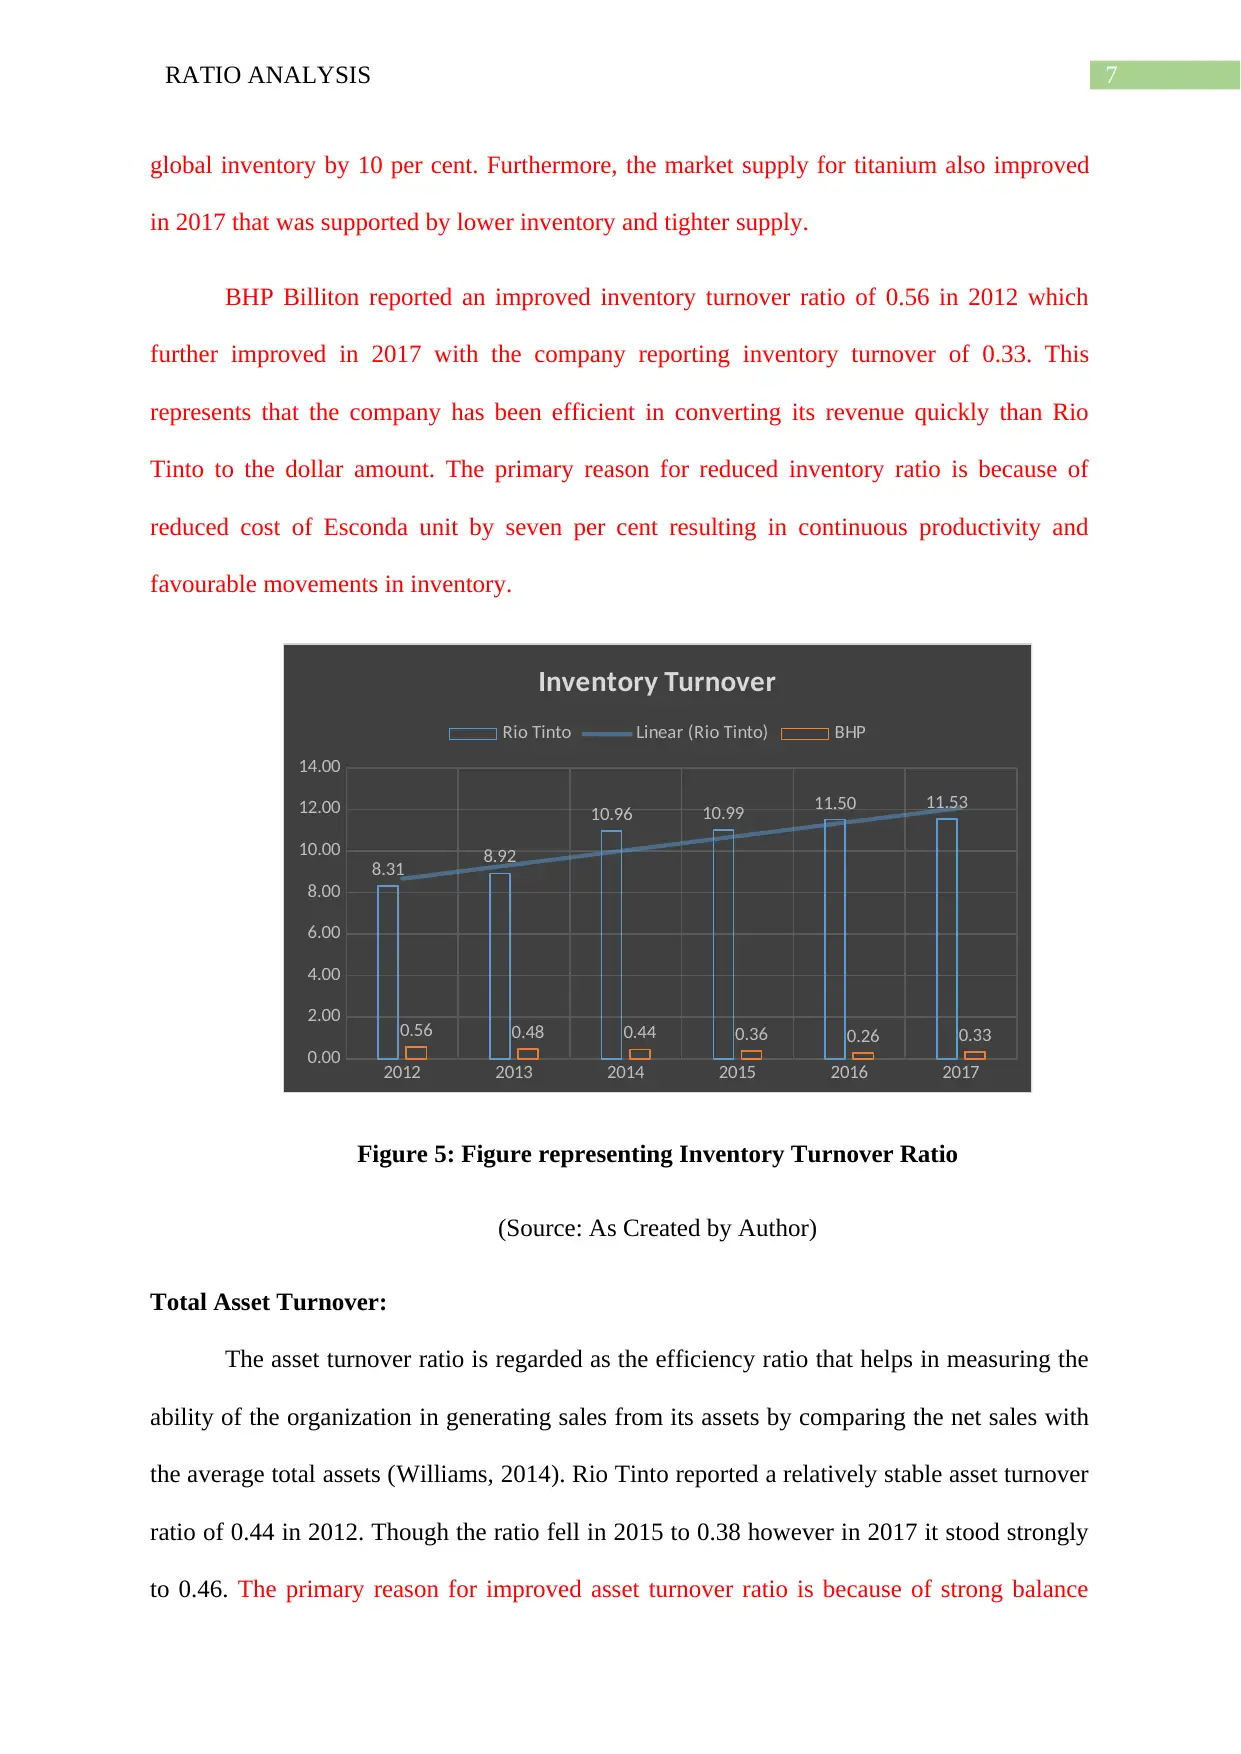
Inventory Turnover Ratio:
The inventory turnover ratio can be defined as the ratio that represents how well the
organization is effectively managing its inventory (Weygandt et al., 2015). The inventory
turnover ratio for Rio Tinto in 2012 stood lower to 8.31 however over the span of six years it
increased to 11.53 in 2017. This represents Rio Tinto relatively slower to convert its
inventory to the dollar amount. Despite the slower inventory conversion rate the market
sentiments for Rio Tinto china’s supply side reformation were implemented and drop in the
Billiton lower net debt and in line with the strong financial performance of non-cash
adjustment of US $0.6 billion.
2012 2013 2014 2015 2016 2017
0.00
0.20
0.40
0.60
0.80
1.00
1.20
1.03 1.08
0.98
1.07
0.95 0.87
0.93 0.92
0.77 0.77
0.98
0.87
Debt to Equity
Rio Tinto BHP
Figure 4: Figure representing Debt to Equity Ratio
(Source: As Created by Author)
Efficiency Ratio:
The efficiency ratio is largely used to assess how well an organization is using the
assets and liabilities internally (Warren & Jones, 2018).
Inventory Turnover Ratio:
The inventory turnover ratio can be defined as the ratio that represents how well the
organization is effectively managing its inventory (Weygandt et al., 2015). The inventory
turnover ratio for Rio Tinto in 2012 stood lower to 8.31 however over the span of six years it
increased to 11.53 in 2017. This represents Rio Tinto relatively slower to convert its
inventory to the dollar amount. Despite the slower inventory conversion rate the market
sentiments for Rio Tinto china’s supply side reformation were implemented and drop in the
Paraphrase This Document
Need a fresh take? Get an instant paraphrase of this document with our AI Paraphraser
7RATIO ANALYSIS
global inventory by 10 per cent. Furthermore, the market supply for titanium also improved
in 2017 that was supported by lower inventory and tighter supply.
BHP Billiton reported an improved inventory turnover ratio of 0.56 in 2012 which
further improved in 2017 with the company reporting inventory turnover of 0.33. This
represents that the company has been efficient in converting its revenue quickly than Rio
Tinto to the dollar amount. The primary reason for reduced inventory ratio is because of
reduced cost of Esconda unit by seven per cent resulting in continuous productivity and
favourable movements in inventory.
2012 2013 2014 2015 2016 2017
0.00
2.00
4.00
6.00
8.00
10.00
12.00
14.00
8.31 8.92
10.96 10.99 11.50 11.53
0.56 0.48 0.44 0.36 0.26 0.33
Inventory Turnover
Rio Tinto Linear (Rio Tinto) BHP
Figure 5: Figure representing Inventory Turnover Ratio
(Source: As Created by Author)
Total Asset Turnover:
The asset turnover ratio is regarded as the efficiency ratio that helps in measuring the
ability of the organization in generating sales from its assets by comparing the net sales with
the average total assets (Williams, 2014). Rio Tinto reported a relatively stable asset turnover
ratio of 0.44 in 2012. Though the ratio fell in 2015 to 0.38 however in 2017 it stood strongly
to 0.46. The primary reason for improved asset turnover ratio is because of strong balance
8RATIO ANALYSIS
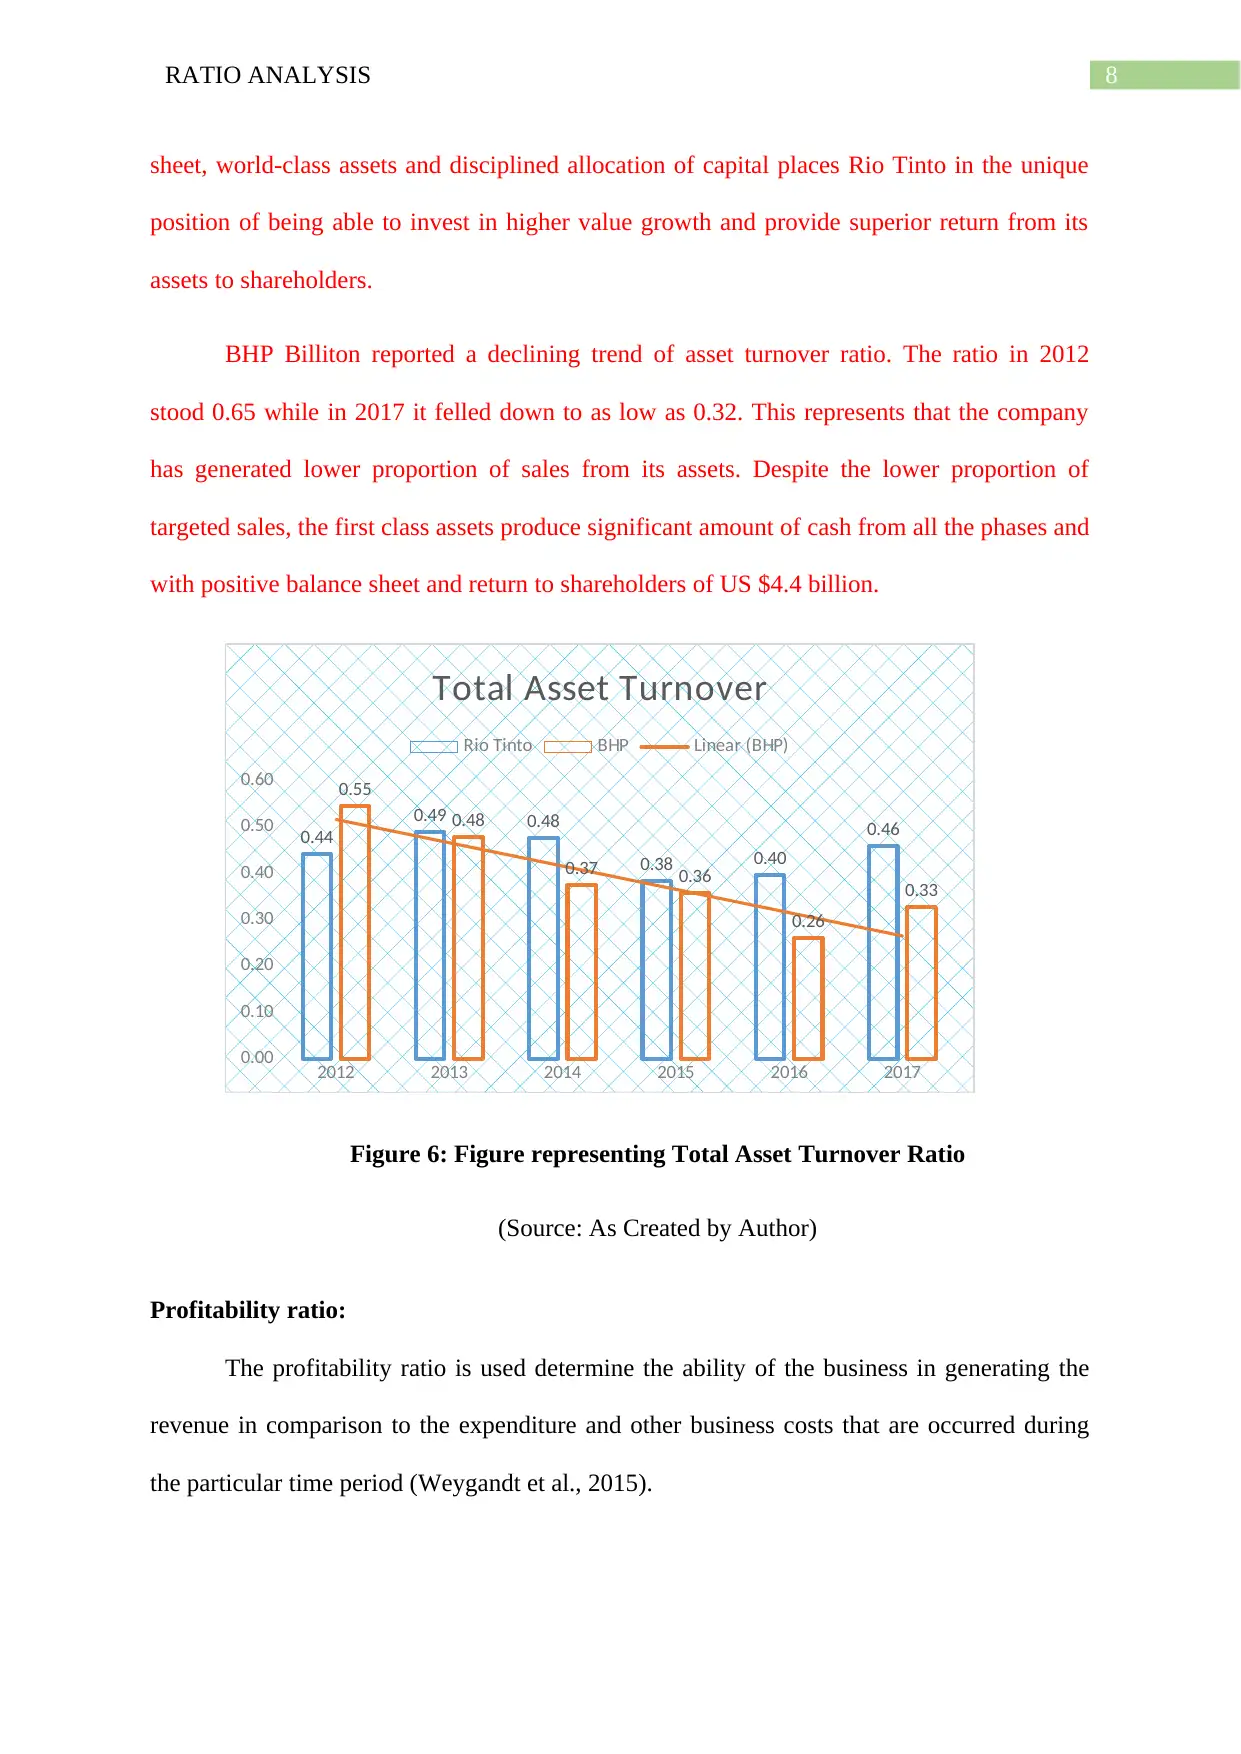
sheet, world-class assets and disciplined allocation of capital places Rio Tinto in the unique
position of being able to invest in higher value growth and provide superior return from its
assets to shareholders.
BHP Billiton reported a declining trend of asset turnover ratio. The ratio in 2012
stood 0.65 while in 2017 it felled down to as low as 0.32. This represents that the company
has generated lower proportion of sales from its assets. Despite the lower proportion of
targeted sales, the first class assets produce significant amount of cash from all the phases and
with positive balance sheet and return to shareholders of US $4.4 billion.
2012 2013 2014 2015 2016 2017
0.00
0.10
0.20
0.30
0.40
0.50
0.60
0.44
0.49 0.48
0.38 0.40
0.46
0.55
0.48
0.37 0.36
0.26
0.33
Total Asset Turnover
Rio Tinto BHP Linear (BHP)
Figure 6: Figure representing Total Asset Turnover Ratio
(Source: As Created by Author)
Profitability ratio:
The profitability ratio is used determine the ability of the business in generating the
revenue in comparison to the expenditure and other business costs that are occurred during
the particular time period (Weygandt et al., 2015).
⊘ This is a preview!⊘
Do you want full access?
Subscribe today to unlock all pages.
Trusted by 1+ million students worldwide
9RATIO ANALYSIS
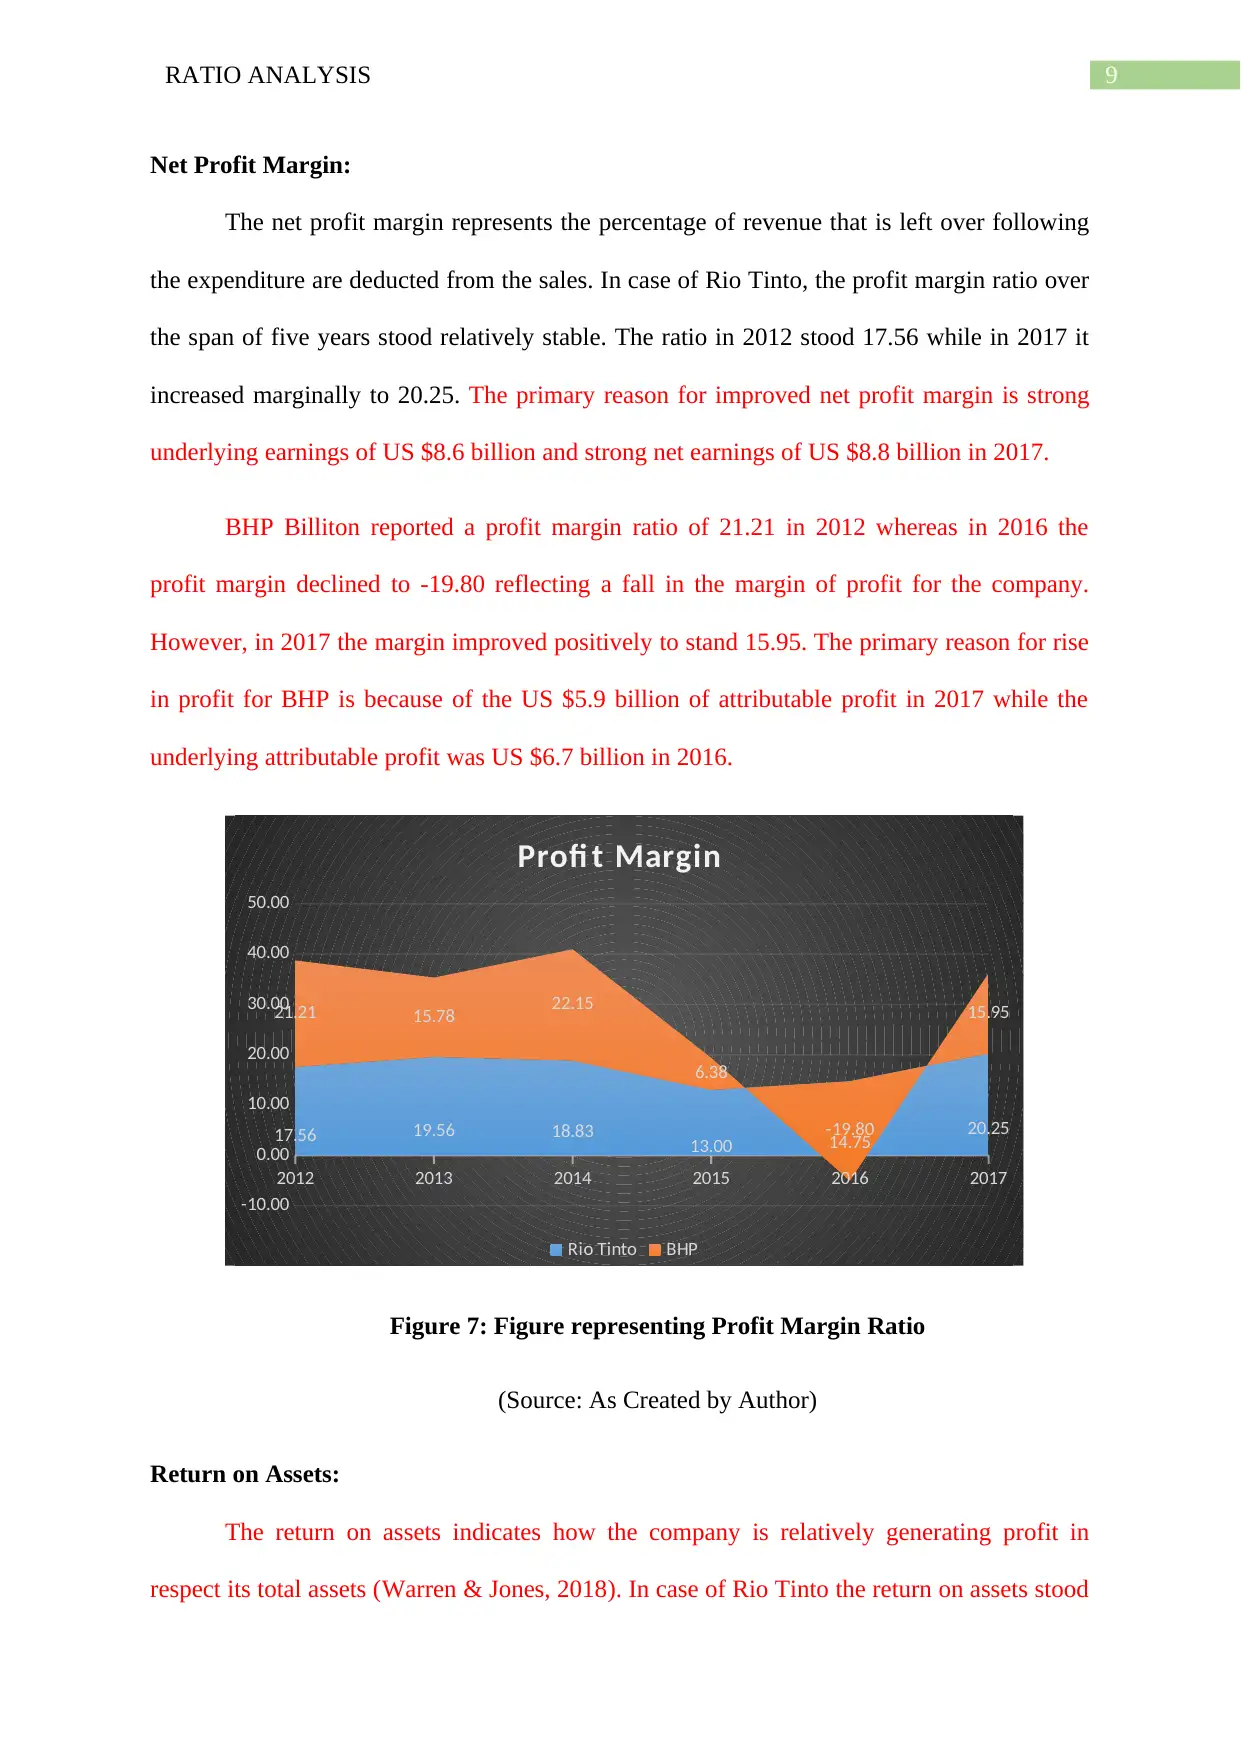
Net Profit Margin:
The net profit margin represents the percentage of revenue that is left over following
the expenditure are deducted from the sales. In case of Rio Tinto, the profit margin ratio over
the span of five years stood relatively stable. The ratio in 2012 stood 17.56 while in 2017 it
increased marginally to 20.25. The primary reason for improved net profit margin is strong
underlying earnings of US $8.6 billion and strong net earnings of US $8.8 billion in 2017.
BHP Billiton reported a profit margin ratio of 21.21 in 2012 whereas in 2016 the
profit margin declined to -19.80 reflecting a fall in the margin of profit for the company.
However, in 2017 the margin improved positively to stand 15.95. The primary reason for rise
in profit for BHP is because of the US $5.9 billion of attributable profit in 2017 while the
underlying attributable profit was US $6.7 billion in 2016.
2012 2013 2014 2015 2016 2017
-10.00
0.00
10.00
20.00
30.00
40.00
50.00
17.56 19.56 18.83 13.00 14.75 20.25
21.21 15.78 22.15
6.38
-19.80
15.95
Profi t Margin
Rio Tinto BHP
Figure 7: Figure representing Profit Margin Ratio
(Source: As Created by Author)
Return on Assets:
The return on assets indicates how the company is relatively generating profit in
respect its total assets (Warren & Jones, 2018). In case of Rio Tinto the return on assets stood
Paraphrase This Document
Need a fresh take? Get an instant paraphrase of this document with our AI Paraphraser
10RATIO ANALYSIS
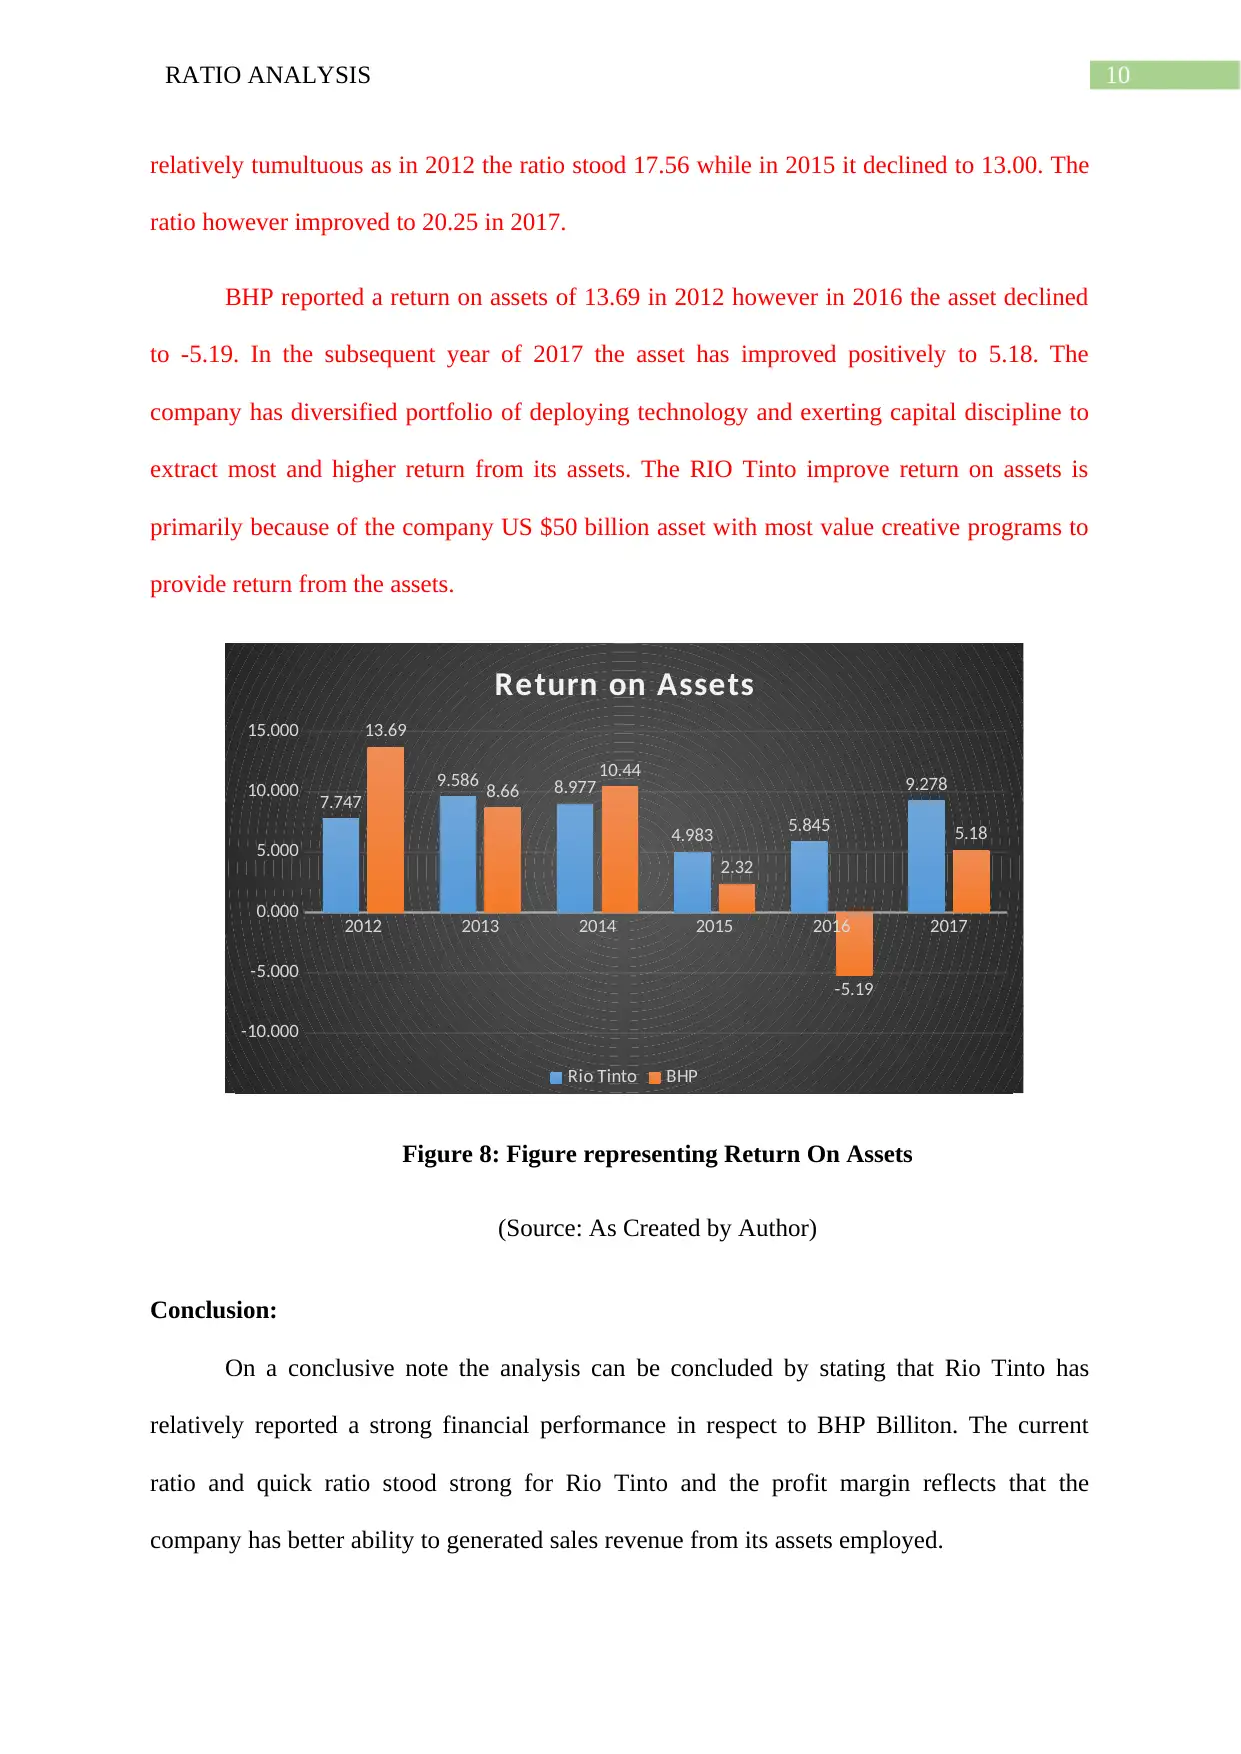
relatively tumultuous as in 2012 the ratio stood 17.56 while in 2015 it declined to 13.00. The
ratio however improved to 20.25 in 2017.
BHP reported a return on assets of 13.69 in 2012 however in 2016 the asset declined
to -5.19. In the subsequent year of 2017 the asset has improved positively to 5.18. The
company has diversified portfolio of deploying technology and exerting capital discipline to
extract most and higher return from its assets. The RIO Tinto improve return on assets is
primarily because of the company US $50 billion asset with most value creative programs to
provide return from the assets.
2012 2013 2014 2015 2016 2017
-10.000
-5.000
0.000
5.000
10.000
15.000
7.747
9.586 8.977
4.983 5.845
9.278
13.69
8.66
10.44
2.32
-5.19
5.18
Return on Assets
Rio Tinto BHP
Figure 8: Figure representing Return On Assets
(Source: As Created by Author)
Conclusion:
On a conclusive note the analysis can be concluded by stating that Rio Tinto has
relatively reported a strong financial performance in respect to BHP Billiton. The current
ratio and quick ratio stood strong for Rio Tinto and the profit margin reflects that the
company has better ability to generated sales revenue from its assets employed.

11RATIO ANALYSIS
⊘ This is a preview!⊘
Do you want full access?
Subscribe today to unlock all pages.
Trusted by 1+ million students worldwide
1 out of 15
Related Documents


Your All-in-One AI-Powered Toolkit for Academic Success.
+13062052269
info@desklib.com
Available 24*7 on WhatsApp / Email
![[object Object]](/_next/static/media/star-bottom.7253800d.svg)
Unlock your academic potential
Copyright © 2020–2025 A2Z Services. All Rights Reserved. Developed and managed by ZUCOL.