Financial Ratio Analysis and Company Performance Evaluation
VerifiedAdded on 2019/09/26
|4
|944
|631
Homework Assignment
AI Summary
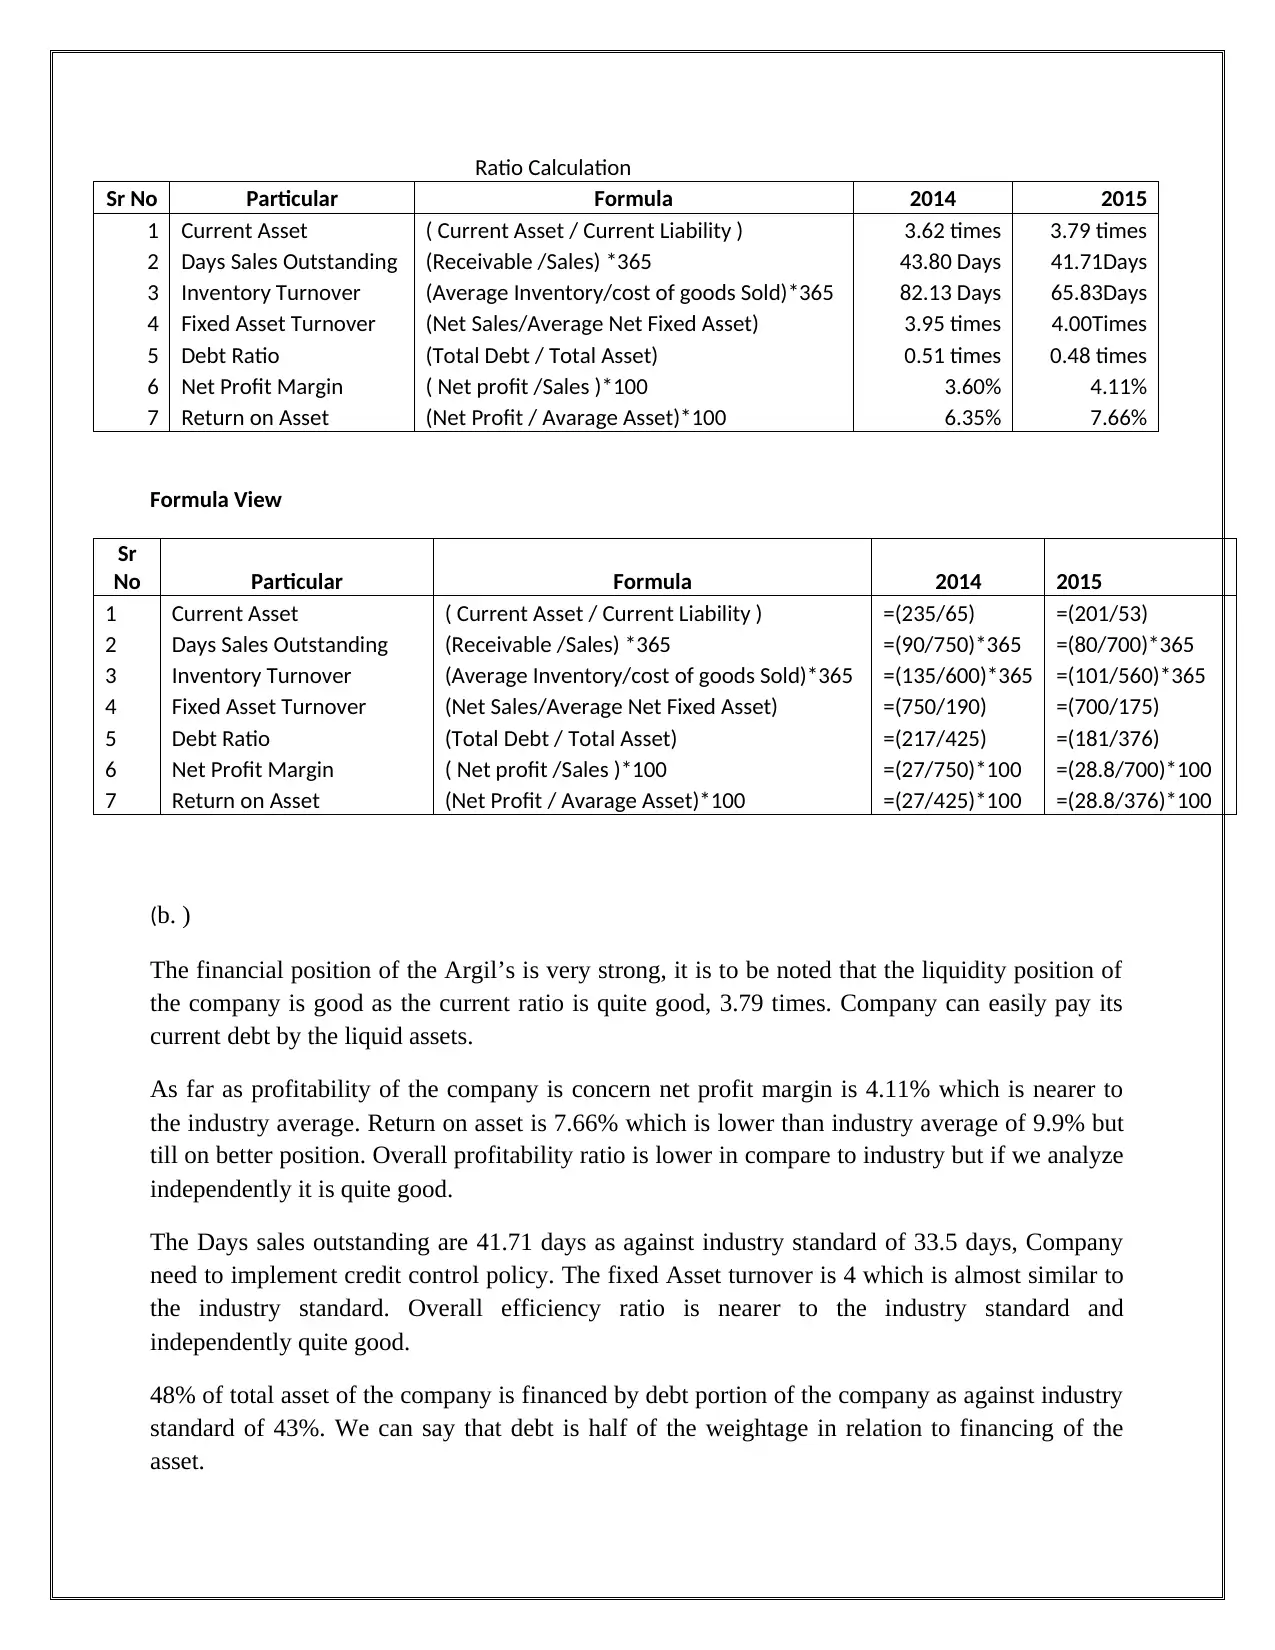
This assignment presents a comprehensive ratio analysis of Argil's financial performance for the years 2014 and 2015. It computes and interprets various financial ratios, including current ratio, days sales outstanding, inventory turnover, fixed asset turnover, debt ratio, net profit margin, and return on assets. The analysis evaluates the company's profitability, efficiency, liquidity, and capital structure, comparing the trends between the two years and against industry standards. Furthermore, the assignment discusses the financial position of the company, highlighting areas of strength and weakness, and provides insights into potential improvements or deterioration in the future. Finally, it suggests additional information, such as government policies, consumer preferences, competitor analysis, and management expertise, that would be valuable for projecting the company's future financial position. This assignment is a great resource for students studying finance and accounting.
1 out of 4
Related Documents


Your All-in-One AI-Powered Toolkit for Academic Success.
+13062052269
info@desklib.com
Available 24*7 on WhatsApp / Email
![[object Object]](/_next/static/media/star-bottom.7253800d.svg)
Copyright © 2020–2026 A2Z Services. All Rights Reserved. Developed and managed by ZUCOL.