Analysis of TESCO's Financial Ratios: A Company Performance Report
VerifiedAdded on 2020/10/22
|5
|754
|264
Report
AI Summary
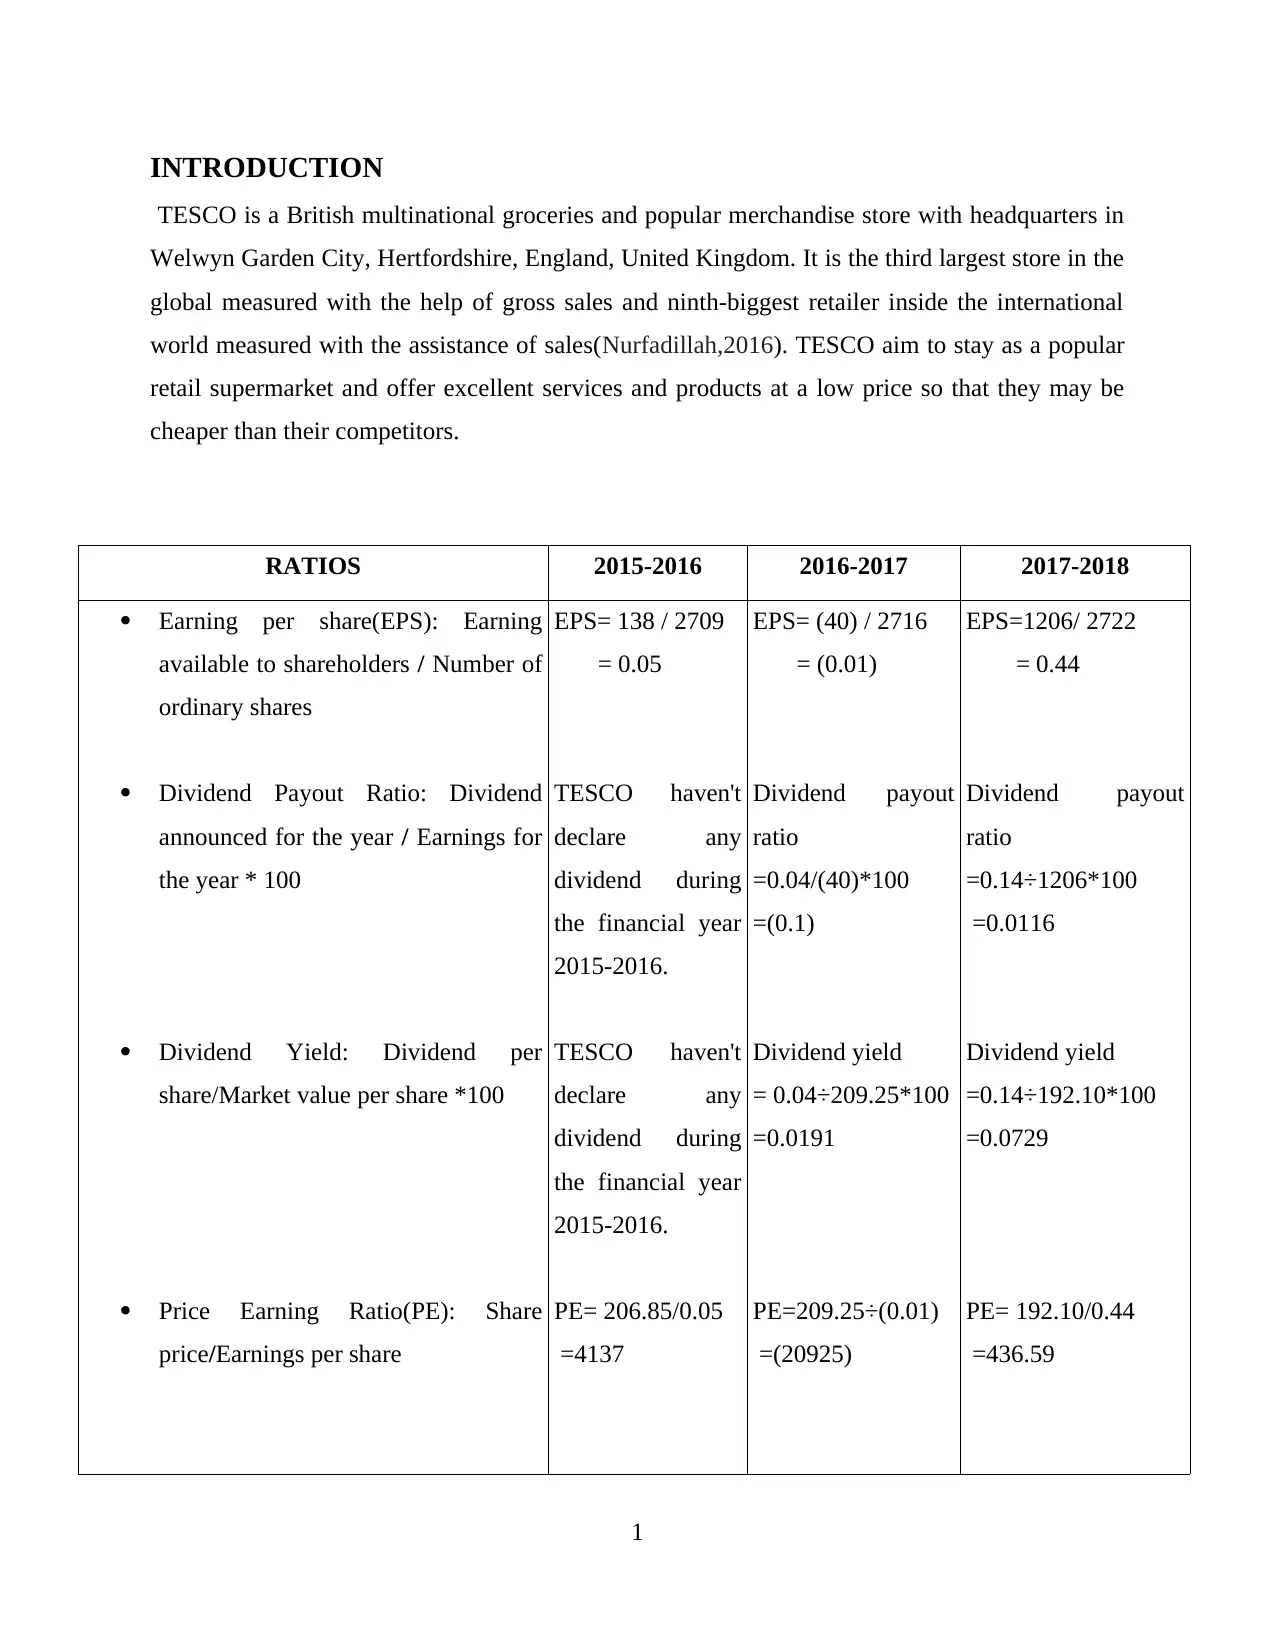
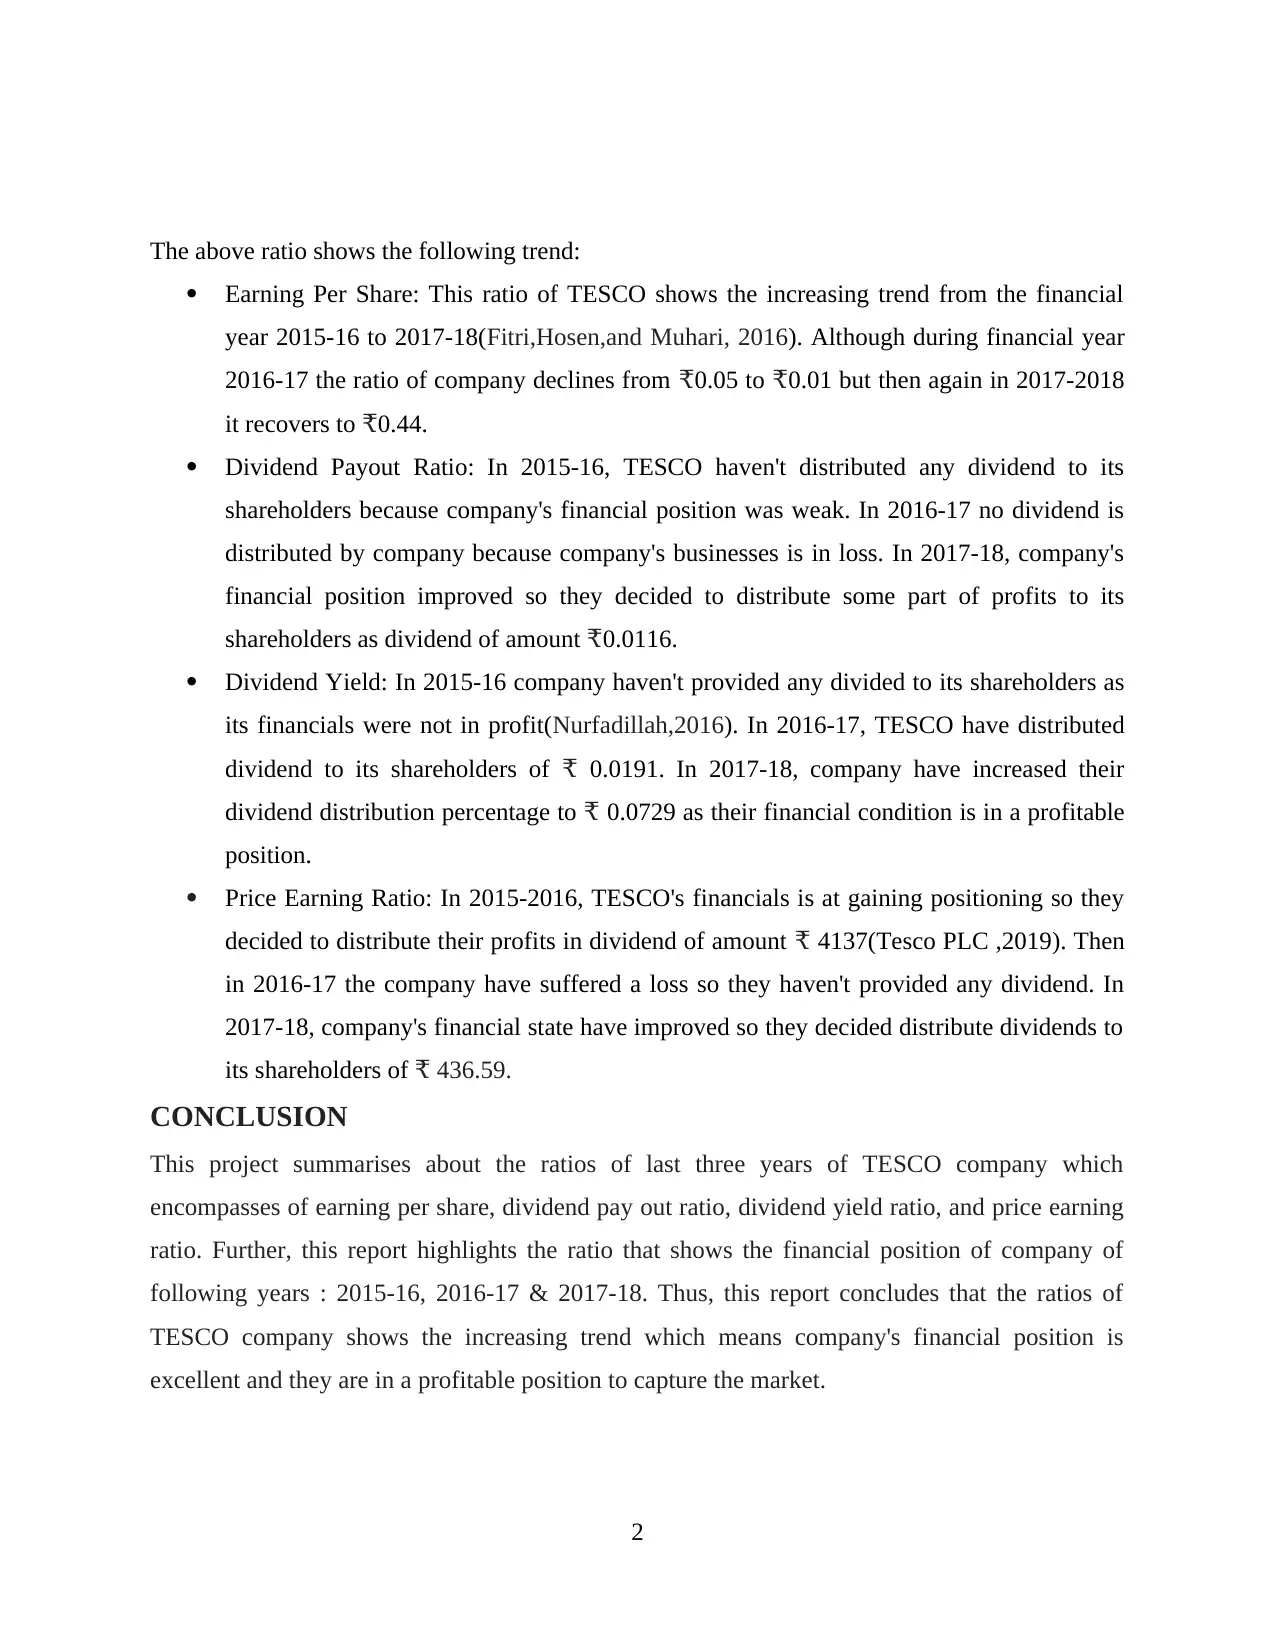
This report provides a financial ratio analysis of TESCO, a British multinational grocery and general merchandise retailer, examining its performance from 2015 to 2018. The analysis focuses on key financial ratios, including Earnings Per Share (EPS), Dividend Payout Ratio, Dividend Yield, and Price-E...

COMPANY
PROJECT(TESCO)
PROJECT(TESCO)
Paraphrase This Document
Need a fresh take? Get an instant paraphrase of this document with our AI Paraphraser

Table of Contents
INTRODUCTION...........................................................................................................................1
CONCLUSION................................................................................................................................2
REFERENCES................................................................................................................................3

INTRODUCTION
TESCO is a British multinational groceries and popular merchandise store with headquarters in
Welwyn Garden City, Hertfordshire, England, United Kingdom. It is the third largest store in the
global measured with the help of gross sales and ninth-biggest retailer inside the international
world measured with the assistance of sales(Nurfadillah,2016). TESCO aim to stay as a popular
retail supermarket and offer excellent services and products at a low price so that they may be
cheaper than their competitors.
RATIOS 2015-2016 2016-2017 2017-2018
Earning per share(EPS): Earning
available to shareholders / Number of
ordinary shares
Dividend Payout Ratio: Dividend
announced for the year / Earnings for
the year * 100
Dividend Yield: Dividend per
share/Market value per share *100
Price Earning Ratio(PE): Share
price/Earnings per share
EPS= 138 / 2709
= 0.05
TESCO haven't
declare any
dividend during
the financial year
2015-2016.
TESCO haven't
declare any
dividend during
the financial year
2015-2016.
PE= 206.85/0.05
=4137
EPS= (40) / 2716
= (0.01)
Dividend payout
ratio
=0.04/(40)*100
=(0.1)
Dividend yield
= 0.04÷209.25*100
=0.0191
PE=209.25÷(0.01)
=(20925)
EPS=1206/ 2722
= 0.44
Dividend payout
ratio
=0.14÷1206*100
=0.0116
Dividend yield
=0.14÷192.10*100
=0.0729
PE= 192.10/0.44
=436.59
1
⊘ This is a preview!⊘
Do you want full access?
Subscribe today to unlock all pages.

Trusted by 1+ million students worldwide

The above ratio shows the following trend:
Earning Per Share: This ratio of TESCO shows the increasing trend from the financial
year 2015-16 to 2017-18(Fitri,Hosen,and Muhari, 2016). Although during financial year
2016-17 the ratio of company declines from ₹0.05 to ₹0.01 but then again in 2017-2018
it recovers to ₹0.44.
Dividend Payout Ratio: In 2015-16, TESCO haven't distributed any dividend to its
shareholders because company's financial position was weak. In 2016-17 no dividend is
distributed by company because company's businesses is in loss. In 2017-18, company's
financial position improved so they decided to distribute some part of profits to its
shareholders as dividend of amount ₹0.0116.
Dividend Yield: In 2015-16 company haven't provided any divided to its shareholders as
its financials were not in profit(Nurfadillah,2016). In 2016-17, TESCO have distributed
dividend to its shareholders of ₹ 0.0191. In 2017-18, company have increased their
dividend distribution percentage to ₹ 0.0729 as their financial condition is in a profitable
position.
Price Earning Ratio: In 2015-2016, TESCO's financials is at gaining positioning so they
decided to distribute their profits in dividend of amount ₹ 4137(Tesco PLC ,2019). Then
in 2016-17 the company have suffered a loss so they haven't provided any dividend. In
2017-18, company's financial state have improved so they decided distribute dividends to
its shareholders of 436.59.₹
CONCLUSION
This project summarises about the ratios of last three years of TESCO company which
encompasses of earning per share, dividend pay out ratio, dividend yield ratio, and price earning
ratio. Further, this report highlights the ratio that shows the financial position of company of
following years : 2015-16, 2016-17 & 2017-18. Thus, this report concludes that the ratios of
TESCO company shows the increasing trend which means company's financial position is
excellent and they are in a profitable position to capture the market.
2
Paraphrase This Document
Need a fresh take? Get an instant paraphrase of this document with our AI Paraphraser

REFERENCES
Books and Journals
Fitri, R.R., Hosen, M.N. and Muhari, S., 2016. Analysis of factors that impact dividend payout
ratio on listed companies at Jakarta islamic index. International Journal of Academic Research
in Accounting, Finance and Management Sciences.6(2).pp.87-97.
Nurfadillah, M., 2016. ANALISIS PENGARUH EARNING PER SHARE, DEBT TO EQUITY
RATIO DAN RETURN ON EQUITY TERHADAP HARGA SAHAM PT UNILEVER
INDONESIA Tbk. Jurnal Manajemen dan Akuntansi.12(1).
Online
Tesco PLC 2019.[Online].Available
through:<https://www.morningstar.com/stocks/xlon/tsco/quote.html>
3
1 out of 5
Related Documents

Your All-in-One AI-Powered Toolkit for Academic Success.
+13062052269
info@desklib.com
Available 24*7 on WhatsApp / Email
Unlock your academic potential
© 2024 | Zucol Services PVT LTD | All rights reserved.