Business Statistics: Regression Analysis of R&D Expenses and Assets
VerifiedAdded on 2023/06/03
|17
|2546
|373
Homework Assignment
AI Summary
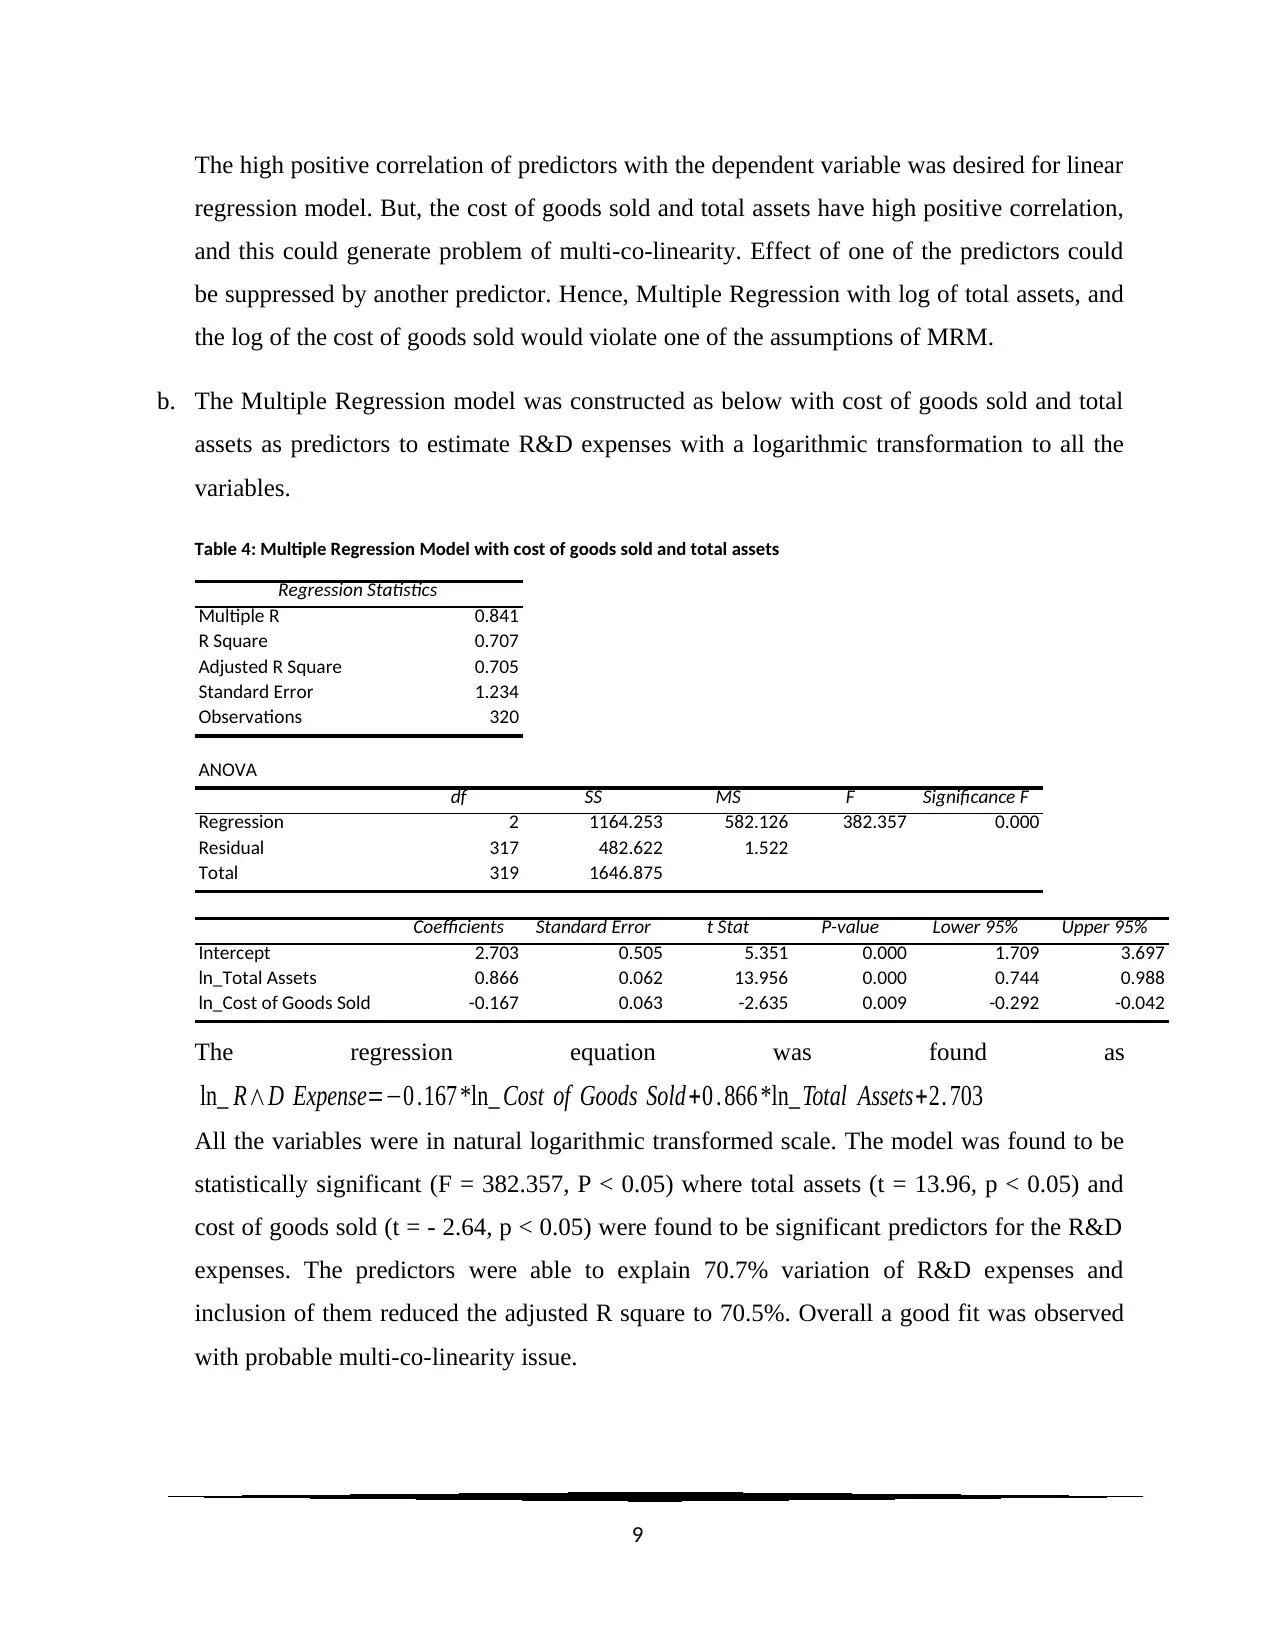
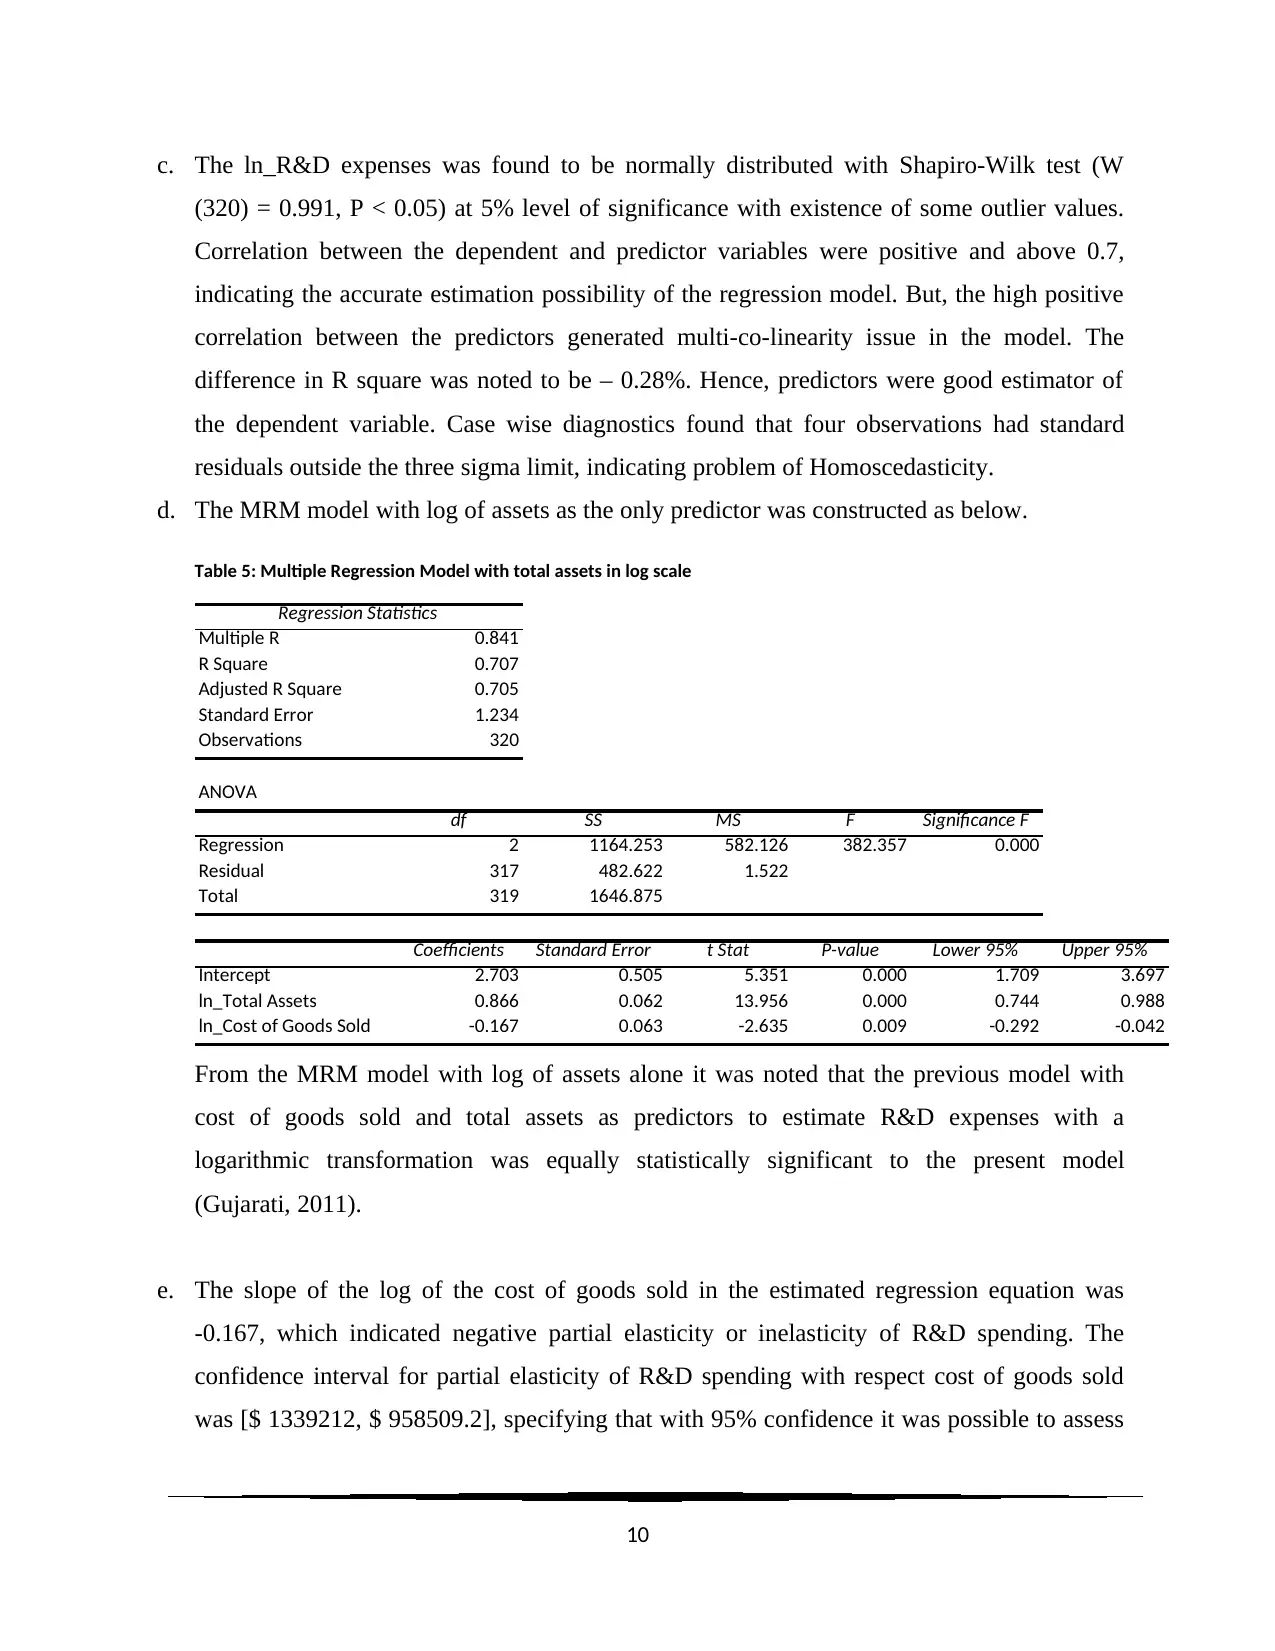
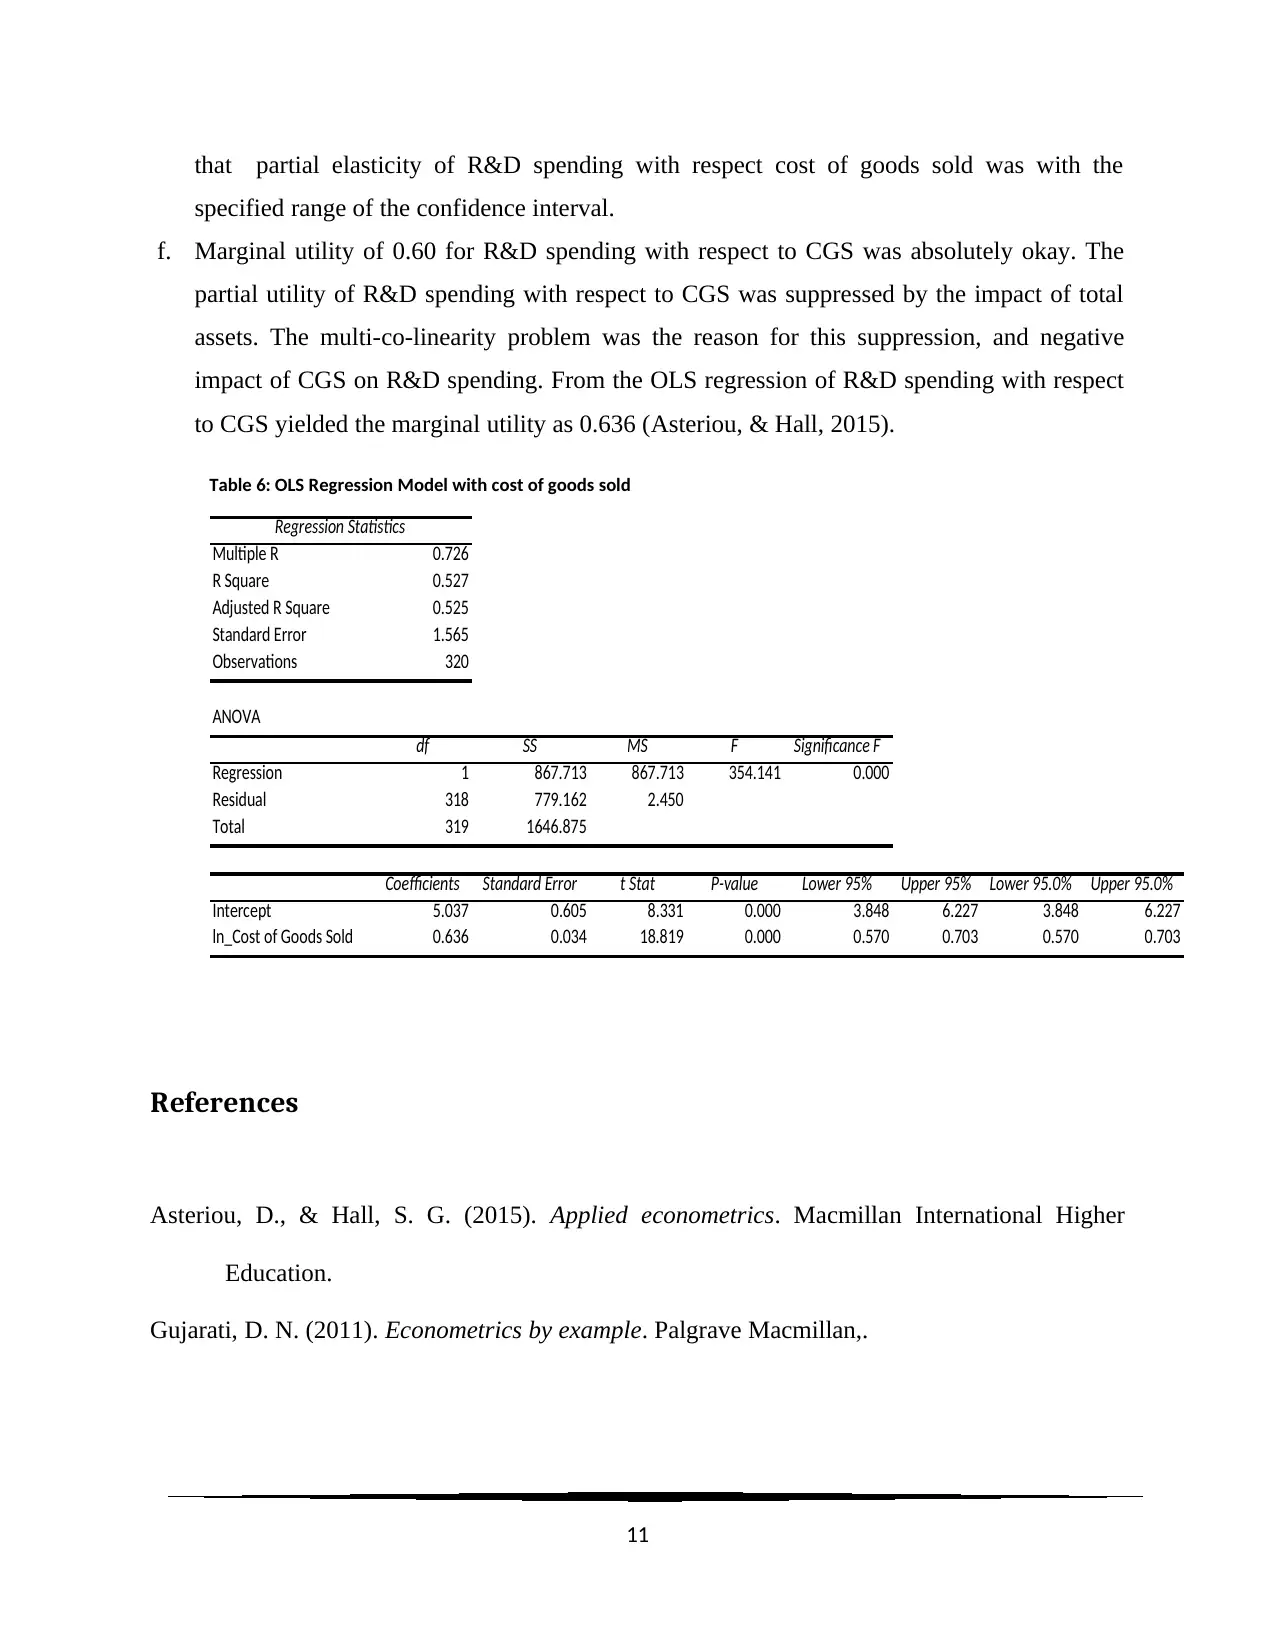
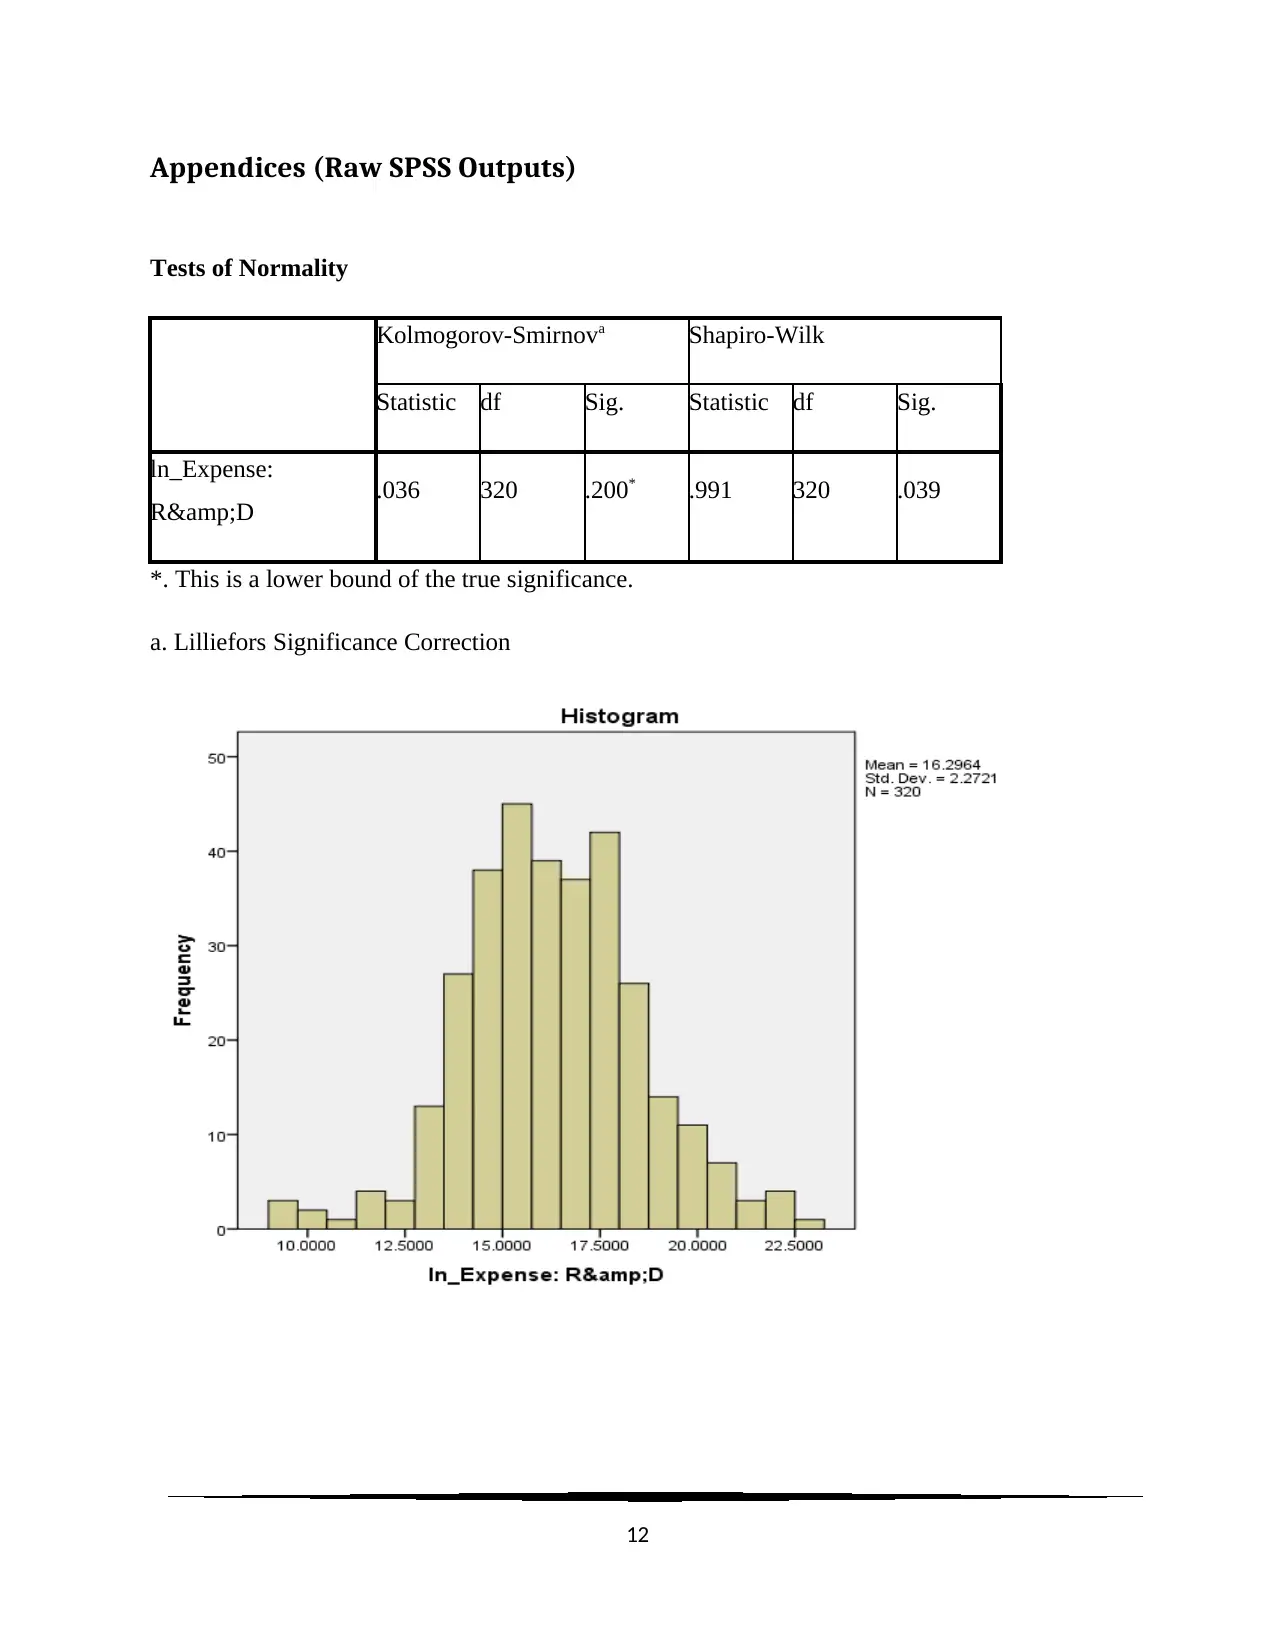
This assignment analyzes the relationship between Research and Development (R&D) expenses and total assets of technology companies. The analysis begins with a scatter plot revealing a positive linear correlation, with the coefficient of determination indicating the proportion of variance in R&D expenses explained by total assets. Outliers are identified and their impact on the model assessed. The least squares regression line is estimated, and the intercept and slope are interpreted, including their statistical significance. Histograms of both variables are examined, and residual plots are analyzed for outliers and the accuracy of the model. Further, the analysis explores the relationship between R&D spending and assets using log transformations, comparing different regression models and interpreting the coefficients. The assignment also investigates the use of multiple regression models with cost of goods sold and total assets as predictors, addressing potential multicollinearity issues. The interpretation of coefficients and the statistical significance of the models are discussed, alongside prediction and confidence intervals. Finally, marginal utility and elasticity of R&D spending are examined in relation to the cost of goods sold.
1 out of 17
Related Documents


Your All-in-One AI-Powered Toolkit for Academic Success.
+13062052269
info@desklib.com
Available 24*7 on WhatsApp / Email
![[object Object]](/_next/static/media/star-bottom.7253800d.svg)
Copyright © 2020–2026 A2Z Services. All Rights Reserved. Developed and managed by ZUCOL.