Impact of Research and Development on the Sales: A case study of Automobile industry
VerifiedAdded on 2023/06/06
|16
|5369
|226
AI Summary
This research investigates the relationship between R&D investment and sales in the automobile industry. Secondary data from five selected firms for the period 2013-2017 was analyzed using correlation and regression analysis. Results indicate a positive and strong relationship between R&D investment and sales.
Contribute Materials
Your contribution can guide someone’s learning journey. Share your
documents today.
Impact of Research and Development on the Sales: A case study of Automobile industry
Executive summary
The current research is aimed to investigate the relationship between the investment in the
research and development and the sales. For this research only the companies in the automobile
industry has been taken into consideration as the researcher is a mechanical engineer by
profession and would like to contribute in that area. The secondary data for the analysis has been
collected from the annual report of the five selected firms for the time period 2013 to 2017. The
findings from the correlation and the regression analysis indicates positive and strong
relationship between the R&D investment and sales.
Contents
Introduction.................................................................................................................................................2
Significance of the study..........................................................................................................................2
Aims and Objective of the research.........................................................................................................3
Research Question...................................................................................................................................3
Literature Review........................................................................................................................................3
Research methodology................................................................................................................................4
Research method and research strategy.................................................................................................5
Data Source.............................................................................................................................................5
Data analysis techniques.........................................................................................................................6
Results and Discussion.................................................................................................................................6
Correlation analysis.................................................................................................................................9
Regression analysis................................................................................................................................11
Hypothesis testing.................................................................................................................................12
Conclusion and Recommendation.............................................................................................................12
Limitation of the research.........................................................................................................................12
1
Secure Best Marks with AI Grader
Need help grading? Try our AI Grader for instant feedback on your assignments.
Introduction
Automobile industry is one of the most significant and the fastest growing industry all around the
world. As per the recent report by (Motor Trade Association) the Australian auto industry is
worth $37 billion which is more than 2 % of the Australian economy. With increase in the
purchasing power of the people and the declining prices of the automobiles has make it more
affordable, due to which there is significant increase in the demand(Jha & Kulkarni, 2015; Lee,
2012). However from the company’s point of view, with increase in demand there has been
increase in the number of companies entering into the industry, which has made the automobile
industry more competitive as compared to earlier. Some of the companies are struggling to
increase the sales with various models introduced almost every month by some
companies(Bollen, Skully, Tripe, & Wei, 2014; Brown & Davis, 2011). Recently the car
manufacturer company Holden Auto stopped it manufacturing in Australia, which was
manufacturing the cars for more than a century. This shows that the automobile industry have
become more competitive and to sustain in the market and to increase the sales the automobile
industry have to invest heavily on their research and development. So, the current research is
aimed to examine the impact of the R&D investment by the firms on their sale(Ernst, Hoyer, &
Rübsaamen, 2010; The World Bank, 2015).
Significance of the study
The researcher is mechanical engineering by profession, which makes the research more
interesting for the researcher as he has the practical knowledge of the automobile industry and
pursuing the course in Business administration allows the researcher to mix the R&D investment
and the sales. The current research is expected to be useful not only for the managerial purpose
but also from the academic perspective also. The findings from the current study can be used by
the managers in the automobile industry to review their R&D investment and compare the
findings from their actual scenario. Even though the results may not be applicable for all types of
firms, the managers will be able to get some idea about the relationship between the two factors.
On the basis of the personal experience and the previous literature, it has been found that the
linkage between the R&D and the sales has not been established. The R&D and the sales are
taken as two different department with no linkage at all, in most of the firms. So, the current
study will work as a bridge between the two. On the other hand, the current research can also be
2
used by other academic researchers who want to explore the similar area in future. The data and
the methodology used in the current research can be used for further study also(DIPP, 2012;
Kangogo & Gakure, 2013; Krishnaven & Vidya, 2015).
Aims and Objective of the research
The current research is aimed to examine the impact of R&D on the sales taking into
consideration the automobile industry. Apart from this following, the research has following
objectives:
To examine the automobile industry
To investigate the sales trend in the automobile industry
To investigate the relationship between the R&D and sales
Research Question
The current research is expected to answer the following research question:
What is the impact of R&D on the sales in the Auto mobile industry?
Hypothesis:
Following hypothesis will be tested on the basis of the secondary data:
Null hypothesis (H0): There is no significant impact of R&D on the sales in the automobile
industry.
Alternative hypothesis(H1): There is significant impact of R&D on the sales in the automobile
industry.
Literature Review
This section of the research has been dedicated to the review of the previous literature in the
similar areas. Impact of the R&D on the financial performance of the firms have been one of the
most researched topic especially in the manufacturing firms. This is because in the current
competitive world, the only way to sustain in the market is to introduce products which are
different from its competitors. The product differentiation can only be achieved by investing in
the Research and Development.
According to the (Ernst et al., 2010) examined the impact of R&D and other cross functional
operations on the sales. Scholars used the multiple-informant 424 sales data and also conducted
the interview with the R&D managers. Findings from the study shows that there is no unique
conclusion as the different process shows different impact. However authors concluded that the
relationship between the sales and R&D is one of the most critical especially in the development
3
stage. Furthermore a study by (VanderPal, 2015) analyzed the relationship between the R&D on
the financial performance of the firms. The data of the 103 companies was used for the time
period 1979 to 2013. For the financial performance the total revenue, ROA and ROE was used.
The time series regression analysis was used for the analysis purpose and the results shows that
the R&D is significantly related to the financial performance of the firms. Another study by
(Başgoze & Sayin, 2013) investigated the relationship between the investment in the R&D and
the value of the firm. Authors argued that most of the research in similar area have shown that
two variables are positively related. Using both the multiple and the simple regression models
authors investigated the impact of R&D on the financial performance of the firms and the results
from the study shows that there is strong and positive relationship between the R&D investment
and the firm’s performance. Similarly another study by (Pandit, Wasley, & Zach, 2011) examine
the impact of the innovative outputs and R&D on the performance of the firm. In this research
authors have also taken into consideration the patents files by the firms as one of the proxy for
the research and development. Findings from the study show that firms which have productive
R&D output have less volatile performance in the future. (Usman, Shaique, Khan, & Baig, 2017)
examined the relationship between the R&D investment and the performance of the firms located
in the developed countries. The previous research have shown that there the R&D investment in
the developed countries is higher as compared to the developing countries. Authors used both the
firm level and the country level data to examine the relationship. The regression analysis was
used to analyze the collected data. Authors found that the R&D investment in the year t, have
negative impact on the firm’s performance however it has positive effect on the value of the
firm. The reason behind such findings may be because the investment in the firm lead to higher
cost in the initial year. The output of the R&D investments are not instant, so the returns are
realized only after some time lag. Another study by (Jaisinghani, 2016) focused on the effect of
the R&D investment in the profitability of the firms in the pharma sector. The data for the same
was collected from the pharmaceuticals firms in India for the time period between 2005 and
2014. The generalized methods of moments have been used to analyze the collected data and the
results from the analysis show that there exists positive relationship between the R&D
investment and the financial performance of the firms. Since pharmaceutical industry is the R&D
intensive sector, so the results are as per the expectations. Some of the other authors have also
conducted studies on similar areas (Imran, Nisar, & Ashraf, 2014; Kula & Guler2, 2014; Shihab,
Soufan, & Abdul-Khaliq, 2014; Stock & McFadden, 2007).
Research methodology
In this section the methodology used in the current research has been discussed. The research
methodology is considered to be one of most important section of any research. All the results
and the conclusion are based on the analysis techniques used by the researcher to analyze the
data. If the appropriate techniques are not used for the analysis, then the findings from the
research are not robust and such results cannot be generalized to other areas. The research
methodology followed in the current section are based on the similar research conducted before
4
Secure Best Marks with AI Grader
Need help grading? Try our AI Grader for instant feedback on your assignments.
in the similar area, so the techniques used in this research are considered to be suitable for this
type of research.
Research method and research strategy
There are different types of the research methodologies which can be used by the researcher to
analyze the data and answer the research question. However, all the existing research methods
can be categorized in three different types. The first research method is the qualitative research
method which are mostly used in those researches where the author want to explore the research
area more deeply. The qualitative research method helps to have in-depth analysis about some
particular area or topic. The data for the qualitative research is mostly is in the forms of text,
image, video, audio etc. For most of the qualitative research the primary data is collected and to
collect the data open ended questionnaire is used. In such type of the questions there is no pre-
defined answers to the questions. The questions are same, however the answers for the question
can be different from each individuals. The popular method for such data collection is
conducting the personal interview or conducting the focused group discussions. Recently the
theme based qualitative analysis has become more popular where the entire research is analyzed
on the basis of the some themes. The themes for the analysis either be defined prior to the data
collection or it can be defined after the data collection based on the responses from the
respondents. One of the drawback of the qualitative study is that it does not have any number
backed findings so the results can be interpreted in different way. Also it is very difficult to
generalize the results(Creswell, 2003; R. Kumar, 2014; Mukaka, 2012).
Another research method is the quantitative method which is another popular method. Unlike the
qualitative research, where the data is in non-numerical form, in quantitative research all the data
are in numerical form and the researchers the main aim is to use the data and statistical
techniques so that the data can be interpreted in meaningful way. There are various statistical
techniques which can be used to analyze the quantitative data with the help of different statistical
tools. The data for the quantitative analysis can collected through the close ended
questionnaire(V. Kumar, Kumar, & Singh, 2013; Teddlie & Yu, 2007; Urrutia, 1995).
Since the current research is aimed to investigate the impact of the R&D investment in the sales
of the automobile industry, the quantitative research method has been used. This is because the
data collected are in the numerical form and the quantitative research method more appropriate
when the impact has to be evaluated.
Data Source
There are mainly two types of data sources. The first is the primary data source where the
researcher collect the data themselves on the basis of the requirement of the research.
Conducting primary survey or personal interview are the major techniques used to collect the
primary data. The second type of data is the secondary data, which is already collected by
someone else. Therefore it is sometimes called the second hand data. The major source of
secondary data included the books and journals, government data base, annual reports of the
company etc.
5
For the current research the secondary data has been used for the analysis. The data has been
collected among the five automobile companies for the time period 2013- 2017. All the data has
been collected from the annual report of the respective companies.
Data analysis techniques
To analyze the data various statistical techniques have been used. The first technique is the
descriptive statistics which is the basic representation of the collected data. Apart from that the
graphical representation of the collected data has also been shown. For the inferential analysis,
the correlation and the regression analysis have been performed(Armstrong, 2012; Cerrito, 2010;
George, Seals, & Aban, 2014; Monem A Mohammed, 2014; Skrivanek, 2009).
Results and Discussion
In the first section the findings from the descriptive statistics has been presented and the results
are shown in the table below.
R&
D
----------------------------------------------------------
---
Percentiles Smallest
1% 67.5 67.5
5% 74.6 74.6
10% 78.7 78.7 Obs
25
25% 495.8 89 Sum of Wgt.
25
50% 754.19 Mean
837.8308
Largest Std. Dev.
604.5917
75% 1037.5 1796.96
90% 1849.06 1849.06 Variance
365531.2
95% 1932.94 1932.94
Skewness .5980173
6
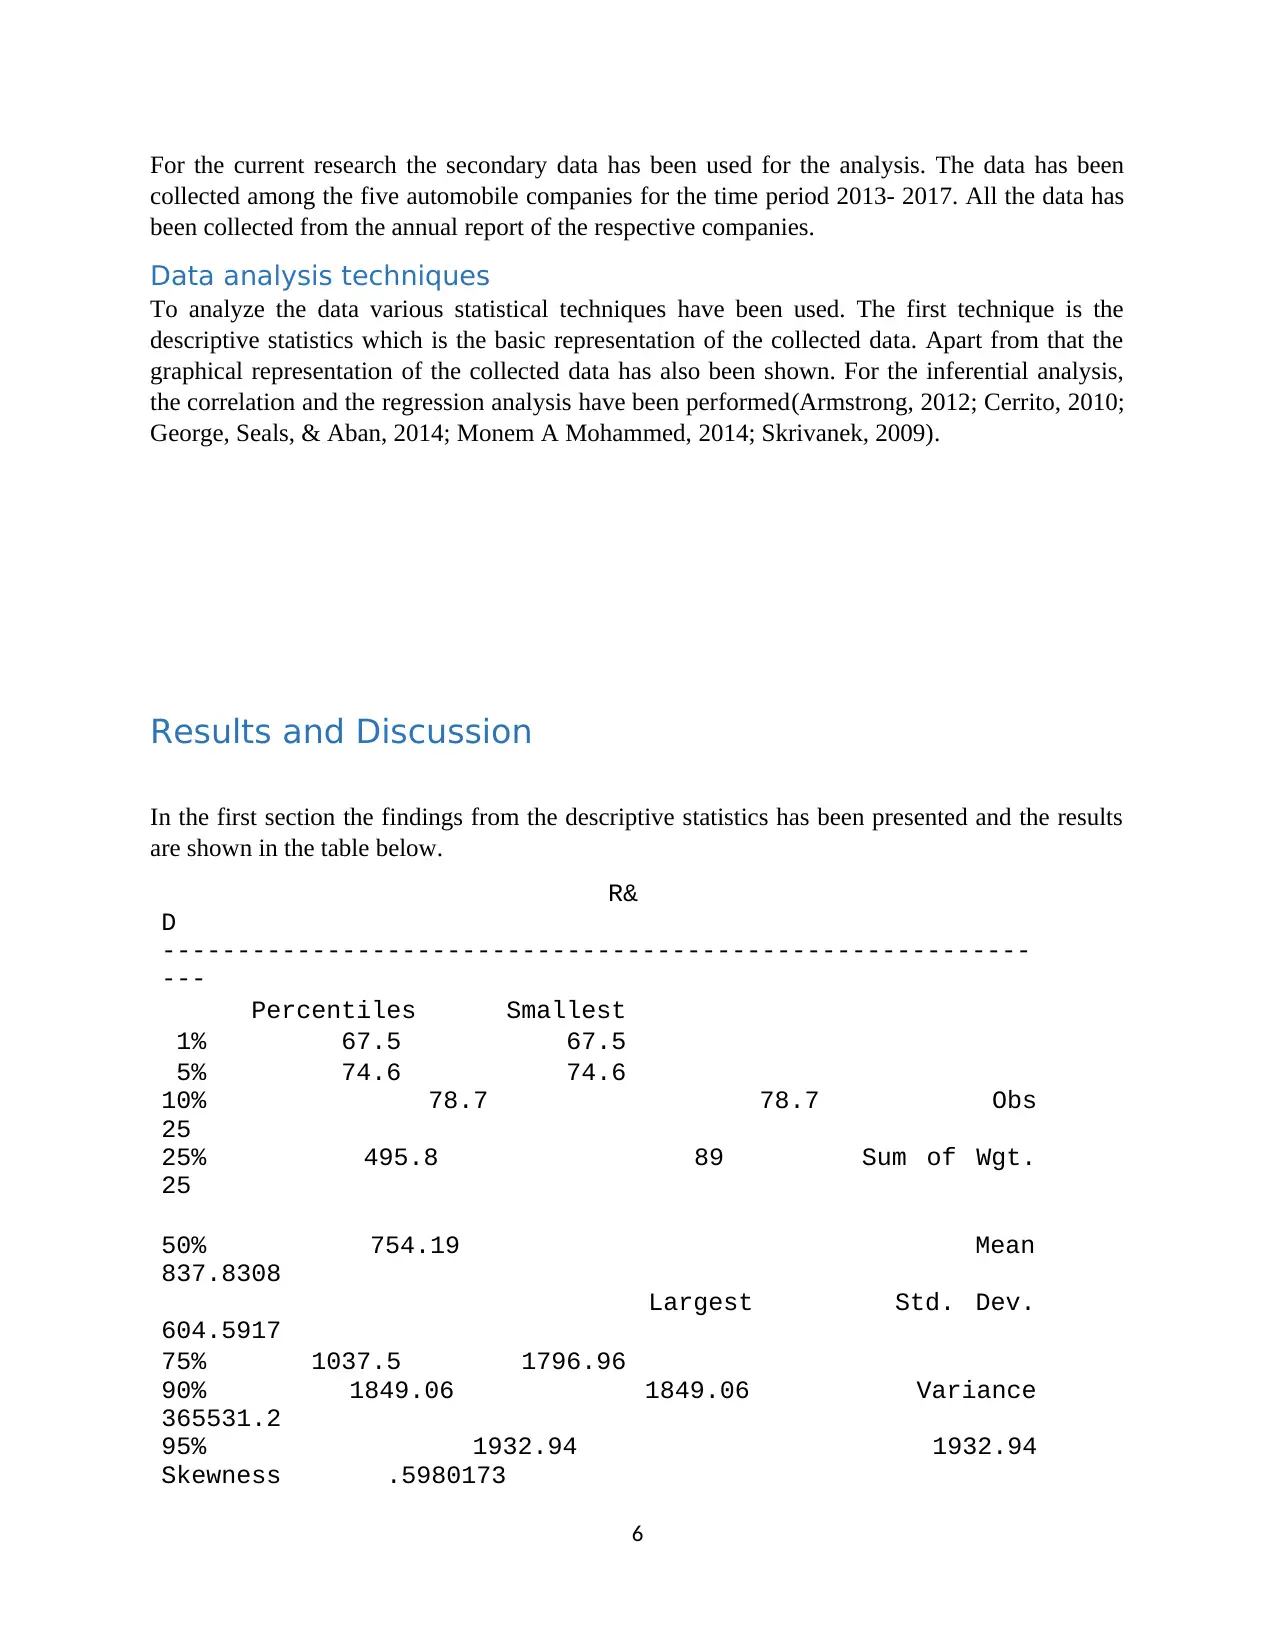
99% 2011.96 2011.96 Kurtosis
2.403464
Table 1 Descriptive statistics of R&&D investment of the automobile industry
As the table shows the mean investment in the R&D by the automobile firms is 837.83 billion
Yen per year. Since the data for each companies was different and most of them have shown the
figures on Yen, so the results have been shown in the Yen to keep the unit constant. The standard
deviation in this case is 604.59 which indicates higher variation among the automobile
companies in terms of R&D investment. The minimum investment is 67.5 billion whereas the
largest investment is 2011.96 billion(Pinto & Slevin, 1989; Wang & Ahmed, 2004).
Sales
----------------------------------------------------------
---
Percentiles Smallest
1% 936 936
5% 1029 1029
10% 1047 1047 Obs
25
25% 5318 1048 Sum of Wgt.
25
50% 6607 Mean
9462
Largest Std. Dev.
16188.08
75% 8972 10217
90% 10297 10297 Variance
2.62e+08
95% 10741 10741 Skewness
4.399437
99% 85654 85654 Kurtosis
21.31674
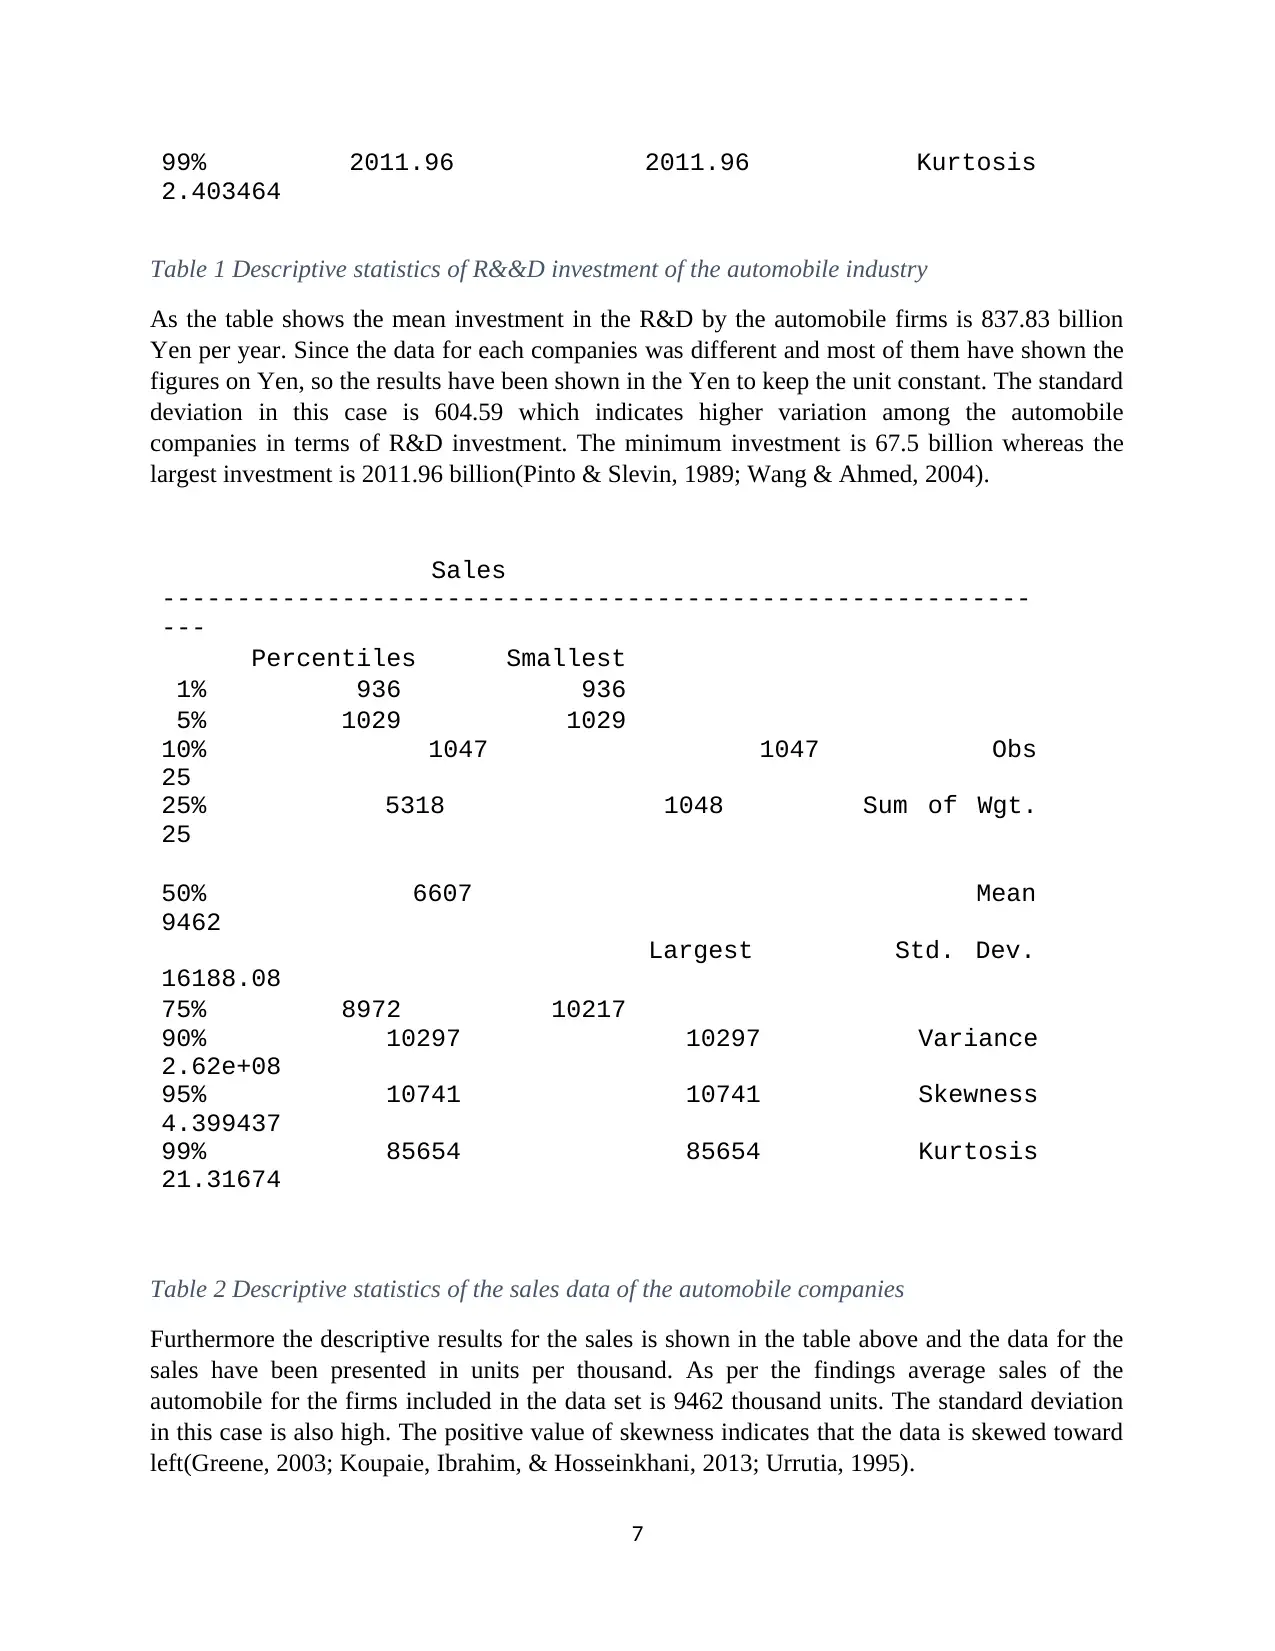
Table 2 Descriptive statistics of the sales data of the automobile companies
Furthermore the descriptive results for the sales is shown in the table above and the data for the
sales have been presented in units per thousand. As per the findings average sales of the
automobile for the firms included in the data set is 9462 thousand units. The standard deviation
in this case is also high. The positive value of skewness indicates that the data is skewed toward
left(Greene, 2003; Koupaie, Ibrahim, & Hosseinkhani, 2013; Urrutia, 1995).
7
2.403464
Table 1 Descriptive statistics of R&&D investment of the automobile industry
As the table shows the mean investment in the R&D by the automobile firms is 837.83 billion
Yen per year. Since the data for each companies was different and most of them have shown the
figures on Yen, so the results have been shown in the Yen to keep the unit constant. The standard
deviation in this case is 604.59 which indicates higher variation among the automobile
companies in terms of R&D investment. The minimum investment is 67.5 billion whereas the
largest investment is 2011.96 billion(Pinto & Slevin, 1989; Wang & Ahmed, 2004).
Sales
----------------------------------------------------------
---
Percentiles Smallest
1% 936 936
5% 1029 1029
10% 1047 1047 Obs
25
25% 5318 1048 Sum of Wgt.
25
50% 6607 Mean
9462
Largest Std. Dev.
16188.08
75% 8972 10217
90% 10297 10297 Variance
2.62e+08
95% 10741 10741 Skewness
4.399437
99% 85654 85654 Kurtosis
21.31674
Table 2 Descriptive statistics of the sales data of the automobile companies
Furthermore the descriptive results for the sales is shown in the table above and the data for the
sales have been presented in units per thousand. As per the findings average sales of the
automobile for the firms included in the data set is 9462 thousand units. The standard deviation
in this case is also high. The positive value of skewness indicates that the data is skewed toward
left(Greene, 2003; Koupaie, Ibrahim, & Hosseinkhani, 2013; Urrutia, 1995).
7
Paraphrase This Document
Need a fresh take? Get an instant paraphrase of this document with our AI Paraphraser
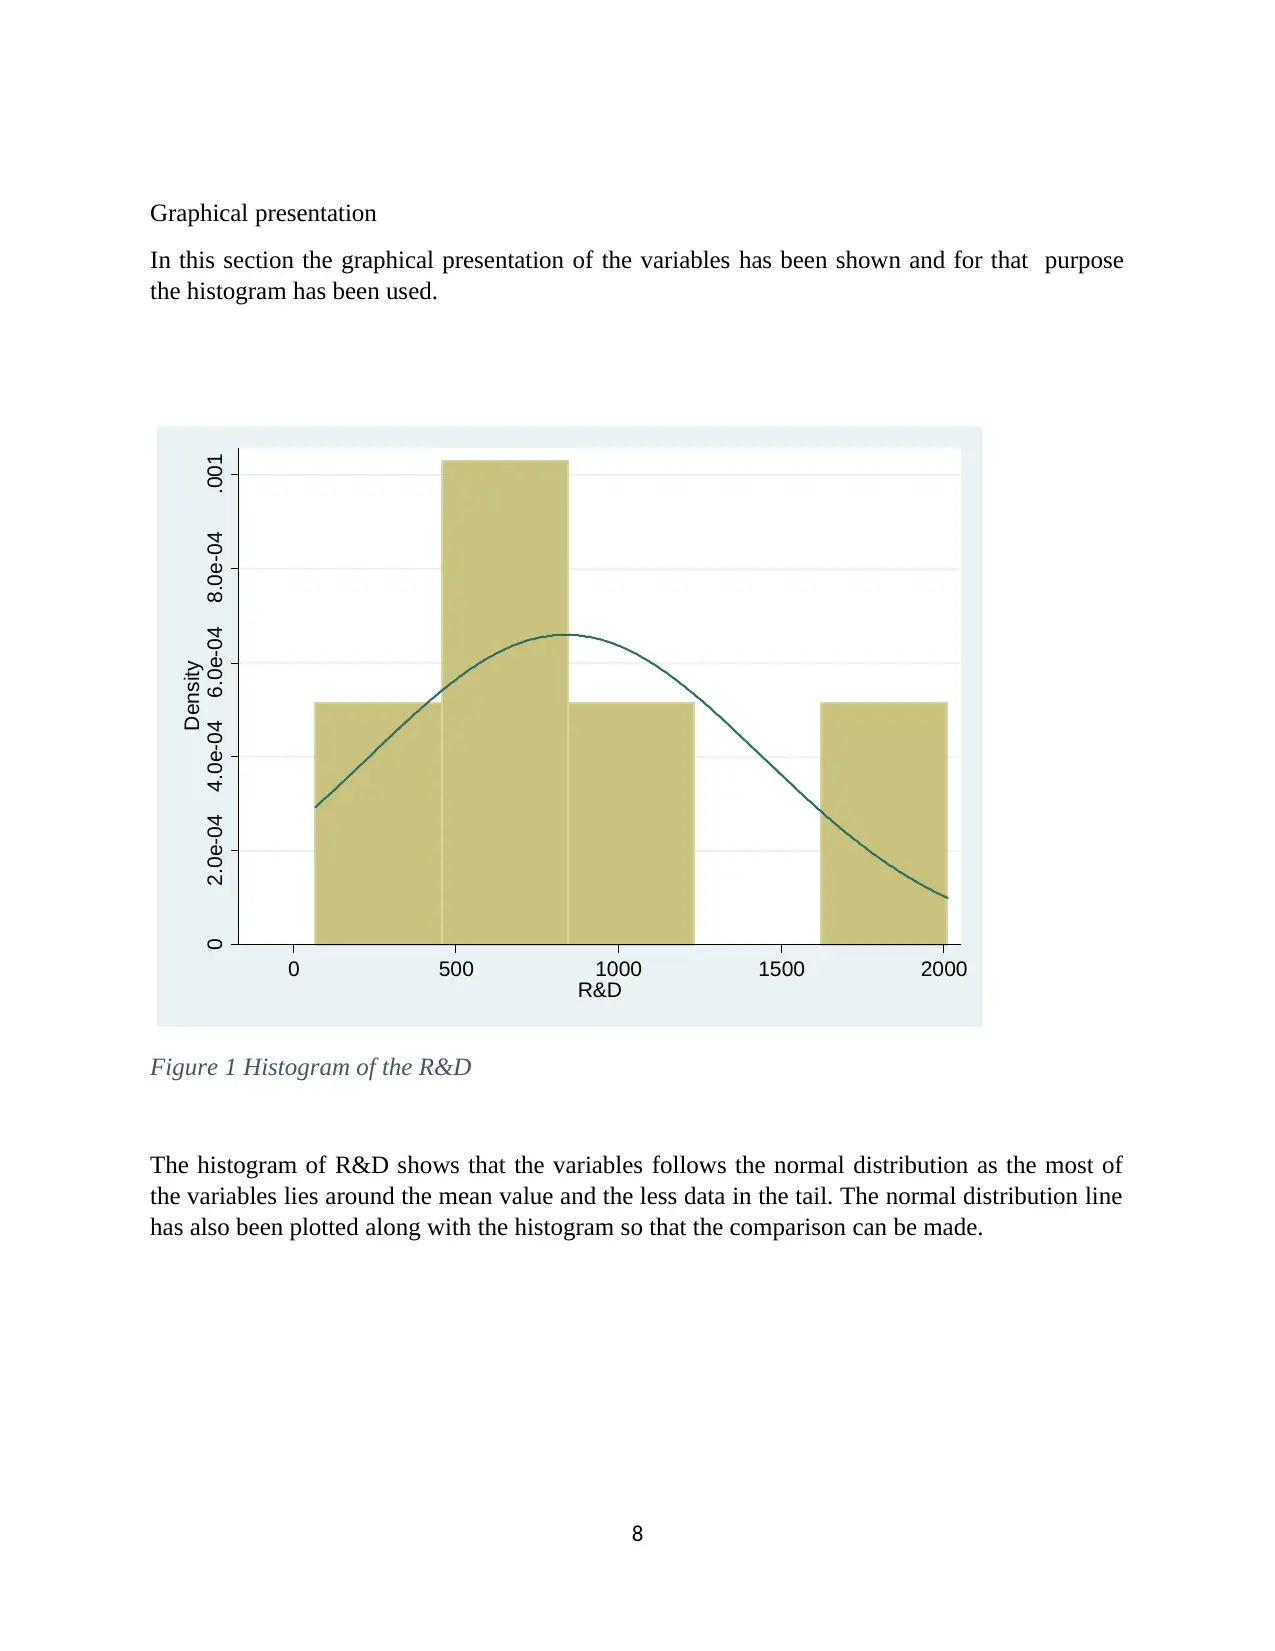
Graphical presentation
In this section the graphical presentation of the variables has been shown and for that purpose
the histogram has been used.
0 2.0e-04 4.0e-04 6.0e-04 8.0e-04 .001
Density
0 500 1000 1500 2000
R&D
Figure 1 Histogram of the R&D
The histogram of R&D shows that the variables follows the normal distribution as the most of
the variables lies around the mean value and the less data in the tail. The normal distribution line
has also been plotted along with the histogram so that the comparison can be made.
8
0 2.0e-05 4.0e-05 6.0e-05
Density
0 20000 40000 60000 80000
Sales
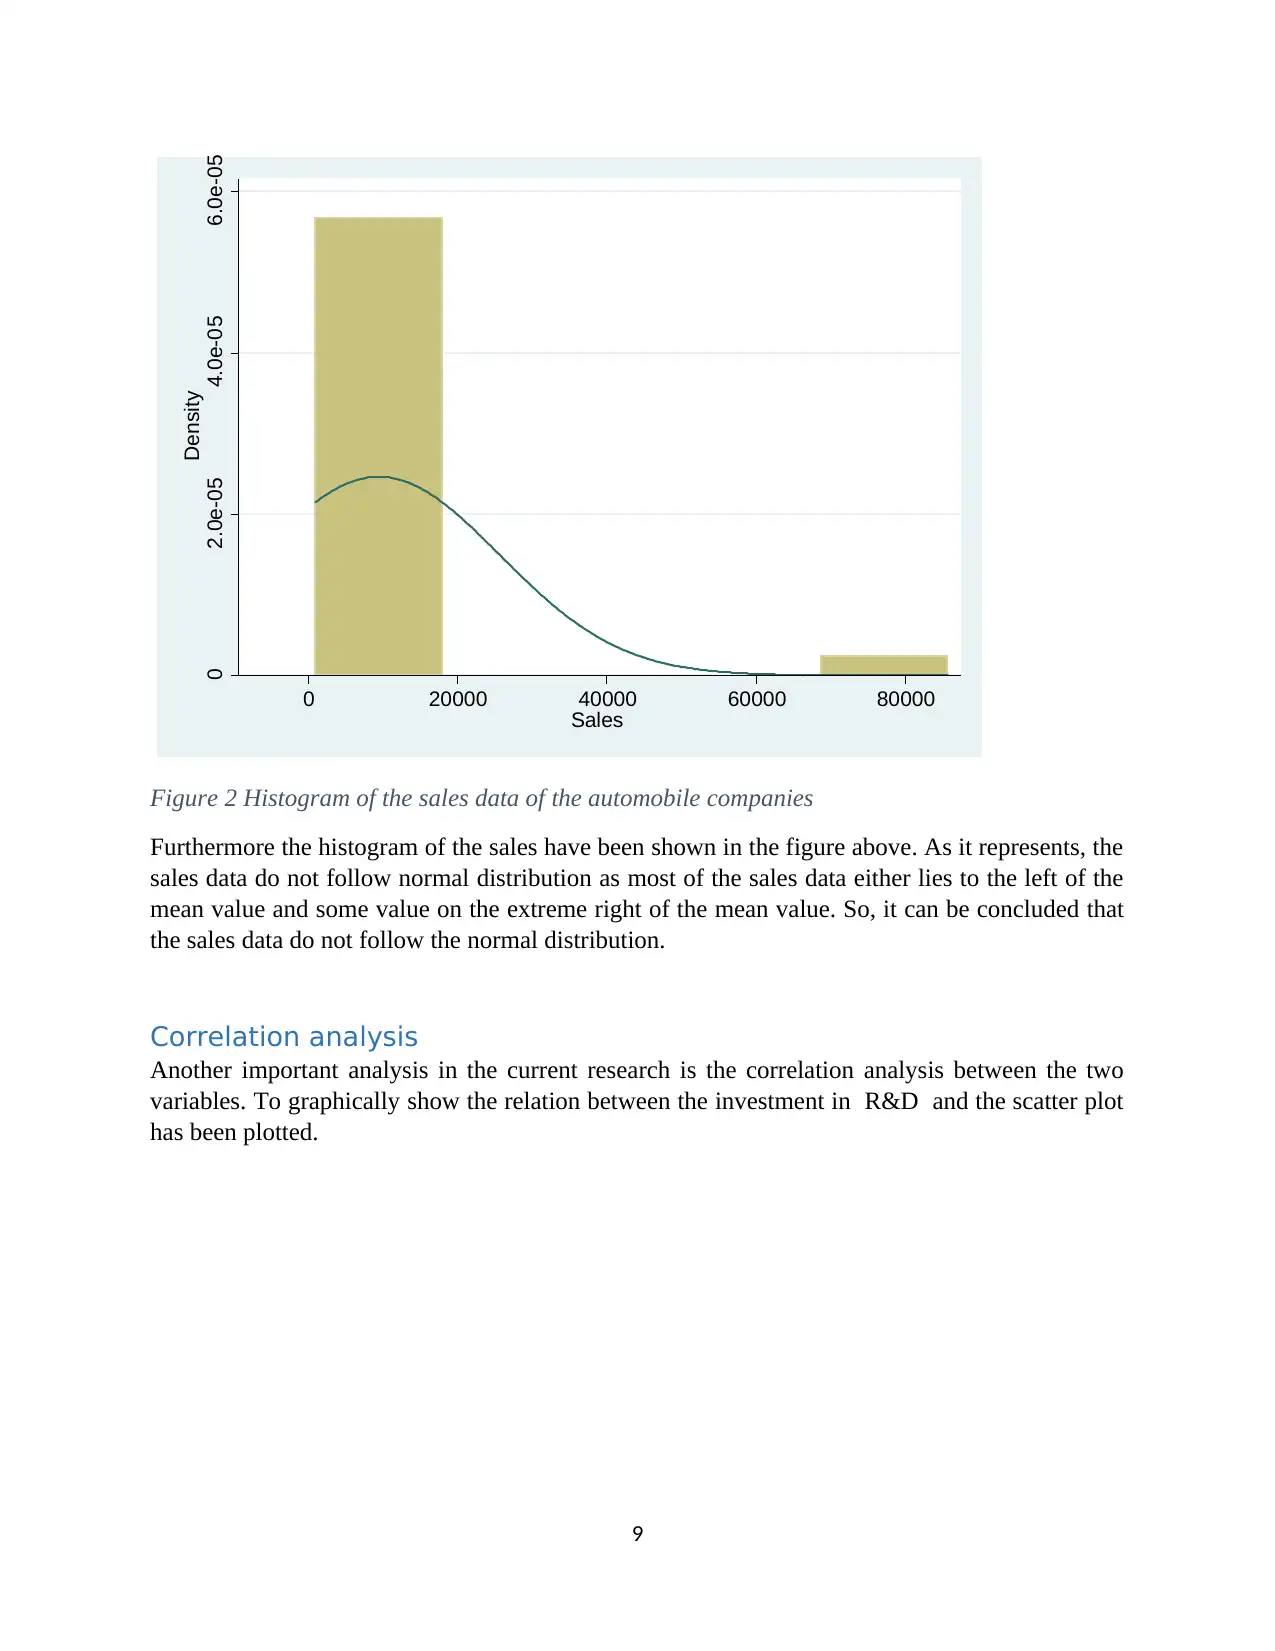
Figure 2 Histogram of the sales data of the automobile companies
Furthermore the histogram of the sales have been shown in the figure above. As it represents, the
sales data do not follow normal distribution as most of the sales data either lies to the left of the
mean value and some value on the extreme right of the mean value. So, it can be concluded that
the sales data do not follow the normal distribution.
Correlation analysis
Another important analysis in the current research is the correlation analysis between the two
variables. To graphically show the relation between the investment in R&D and the scatter plot
has been plotted.
9
Density
0 20000 40000 60000 80000
Sales
Figure 2 Histogram of the sales data of the automobile companies
Furthermore the histogram of the sales have been shown in the figure above. As it represents, the
sales data do not follow normal distribution as most of the sales data either lies to the left of the
mean value and some value on the extreme right of the mean value. So, it can be concluded that
the sales data do not follow the normal distribution.
Correlation analysis
Another important analysis in the current research is the correlation analysis between the two
variables. To graphically show the relation between the investment in R&D and the scatter plot
has been plotted.
9
0 500 1000 1500 2000
R&D
0 20000 40000 60000 80000
Sales
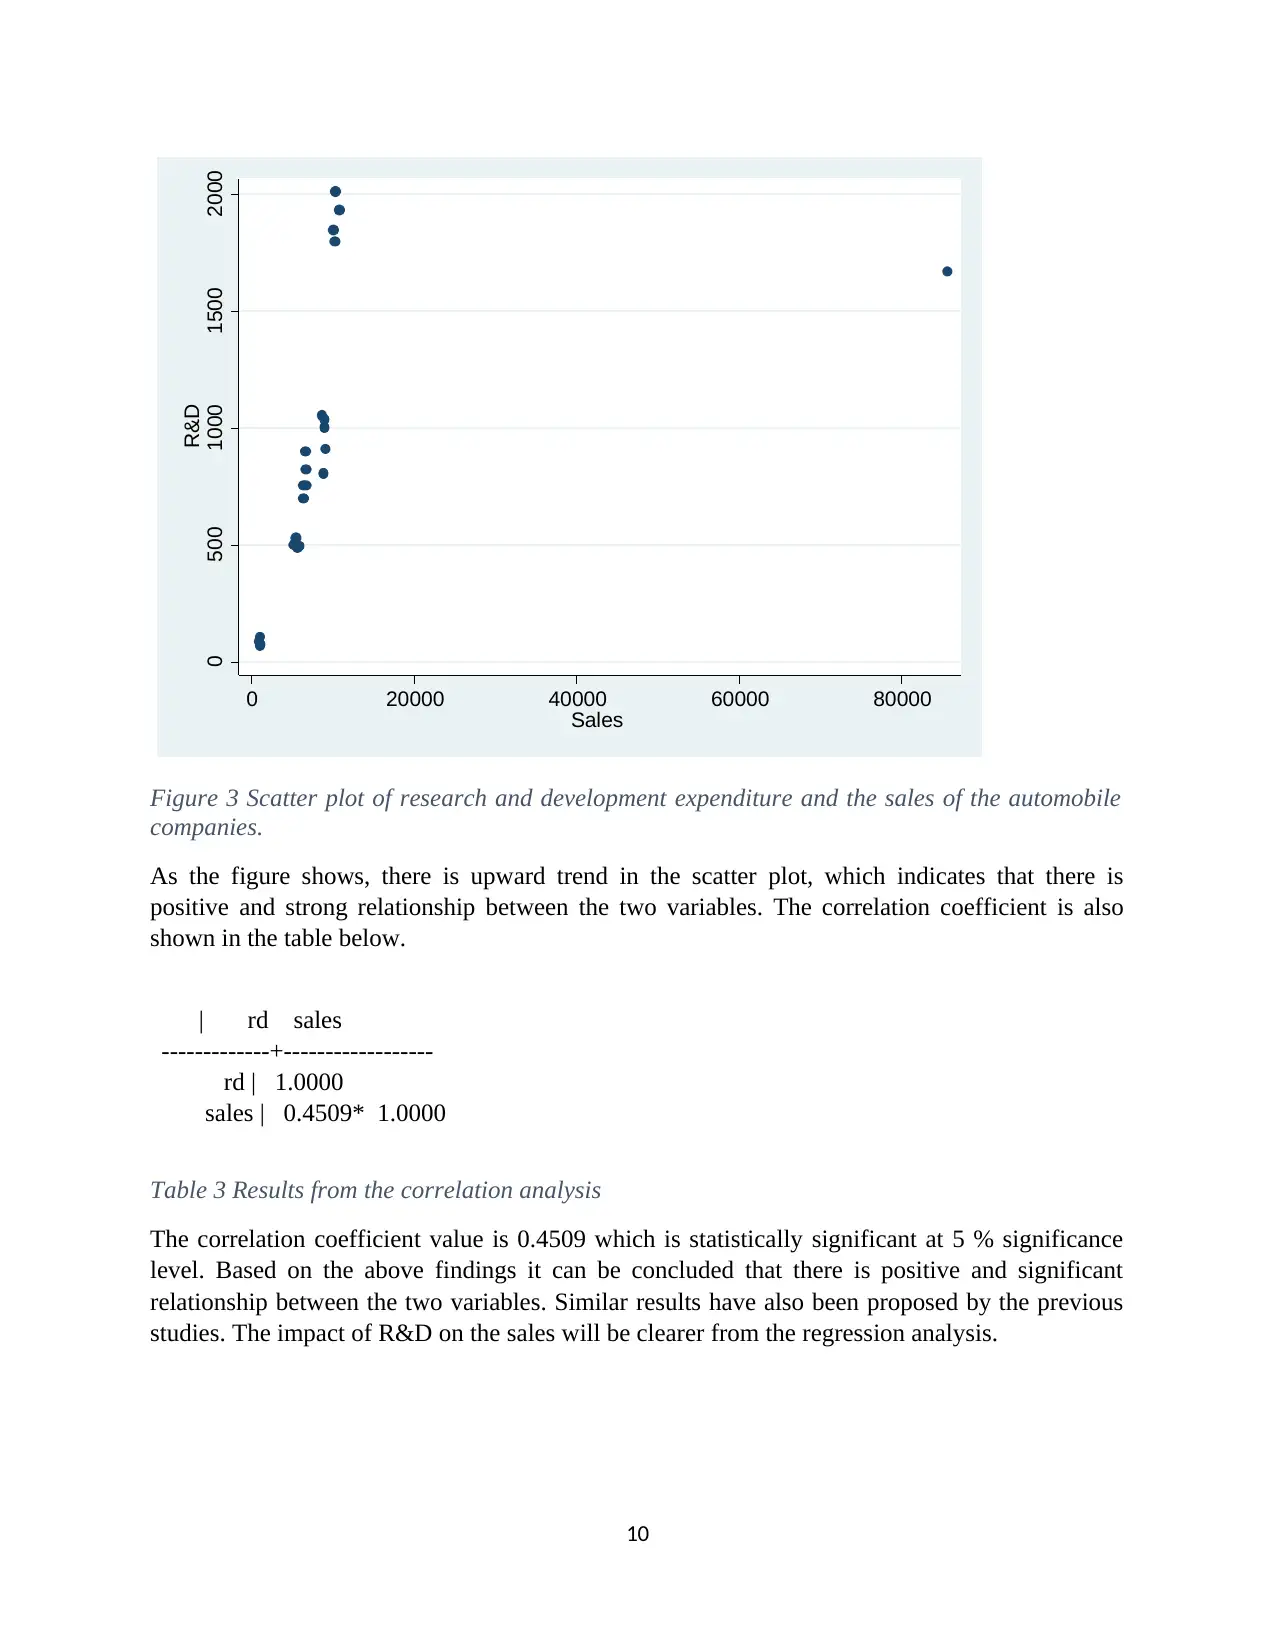
Figure 3 Scatter plot of research and development expenditure and the sales of the automobile
companies.
As the figure shows, there is upward trend in the scatter plot, which indicates that there is
positive and strong relationship between the two variables. The correlation coefficient is also
shown in the table below.
| rd sales
-------------+------------------
rd | 1.0000
sales | 0.4509* 1.0000
Table 3 Results from the correlation analysis
The correlation coefficient value is 0.4509 which is statistically significant at 5 % significance
level. Based on the above findings it can be concluded that there is positive and significant
relationship between the two variables. Similar results have also been proposed by the previous
studies. The impact of R&D on the sales will be clearer from the regression analysis.
10
R&D
0 20000 40000 60000 80000
Sales
Figure 3 Scatter plot of research and development expenditure and the sales of the automobile
companies.
As the figure shows, there is upward trend in the scatter plot, which indicates that there is
positive and strong relationship between the two variables. The correlation coefficient is also
shown in the table below.
| rd sales
-------------+------------------
rd | 1.0000
sales | 0.4509* 1.0000
Table 3 Results from the correlation analysis
The correlation coefficient value is 0.4509 which is statistically significant at 5 % significance
level. Based on the above findings it can be concluded that there is positive and significant
relationship between the two variables. Similar results have also been proposed by the previous
studies. The impact of R&D on the sales will be clearer from the regression analysis.
10
Secure Best Marks with AI Grader
Need help grading? Try our AI Grader for instant feedback on your assignments.
Regression analysis
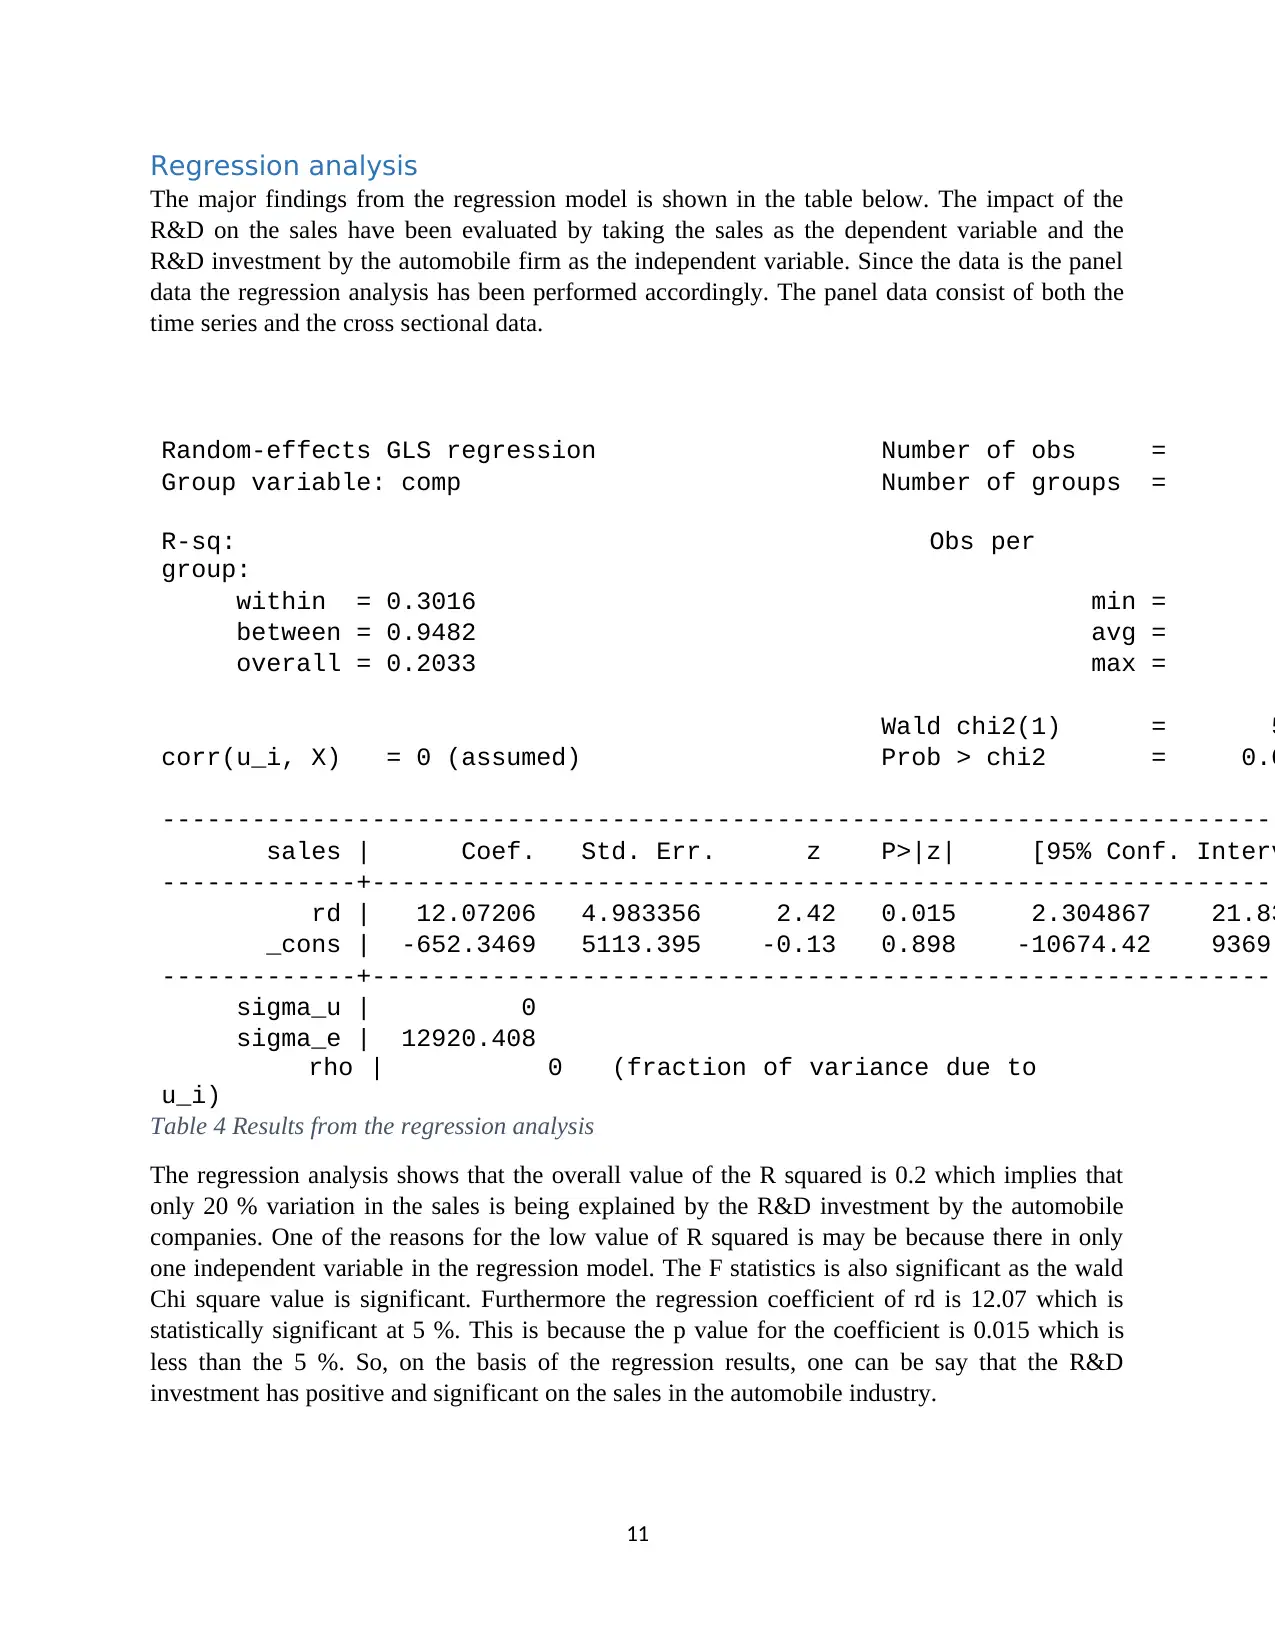
The major findings from the regression model is shown in the table below. The impact of the
R&D on the sales have been evaluated by taking the sales as the dependent variable and the
R&D investment by the automobile firm as the independent variable. Since the data is the panel
data the regression analysis has been performed accordingly. The panel data consist of both the
time series and the cross sectional data.
Random-effects GLS regression Number of obs =
Group variable: comp Number of groups =
R-sq: Obs per
group:
within = 0.3016 min =
between = 0.9482 avg =
overall = 0.2033 max =
Wald chi2(1) = 5
corr(u_i, X) = 0 (assumed) Prob > chi2 = 0.0
---------------------------------------------------------------------------
sales | Coef. Std. Err. z P>|z| [95% Conf. Interv
-------------+-------------------------------------------------------------
rd | 12.07206 4.983356 2.42 0.015 2.304867 21.83
_cons | -652.3469 5113.395 -0.13 0.898 -10674.42 9369.
-------------+-------------------------------------------------------------
sigma_u | 0
sigma_e | 12920.408
rho | 0 (fraction of variance due to
u_i)
Table 4 Results from the regression analysis
The regression analysis shows that the overall value of the R squared is 0.2 which implies that
only 20 % variation in the sales is being explained by the R&D investment by the automobile
companies. One of the reasons for the low value of R squared is may be because there in only
one independent variable in the regression model. The F statistics is also significant as the wald
Chi square value is significant. Furthermore the regression coefficient of rd is 12.07 which is
statistically significant at 5 %. This is because the p value for the coefficient is 0.015 which is
less than the 5 %. So, on the basis of the regression results, one can be say that the R&D
investment has positive and significant on the sales in the automobile industry.
11
Hypothesis testing
Null hypothesis: There is no significant impact of R&D on the sales in the automobile industry.
Alternative hypothesis: There is significant impact of R&D on the sales in the automobile
industry
As the regression coefficient of R&D is significant and also positive, we can reject the proposed
null hypothesis. This implies that we can accept the alternative hypothesis.
Conclusion and Recommendation
The current research was aimed to examine the impact of the R&D investment on the sales in the
automobile industry. To analyze the impact the secondary data was collected from the annual
report of 5 automobile firms. The time period taken into consideration is from 2013 to 2017.
Results from the analysis show that there is positive and strong relationship between the R&D
investment and the sales. So, to increase the sales of the automobile products the firms have to
invest in the research and development. However it should be noted that the return from the
R&D are not immediate in most of the cases.
On the basis of the results following recommendations can be made:
The automobile companies should invest more in the research and development and there
should be continuous investment not only a one time investment
Since there is a debate going on about the clean energy fuel, these companies should
invest more on R&D of environment friendly vehicles.
The sales of the vehicles may not increase immediately after the investment in R&D so
the companies should take into account the gap and the cost of investment
Limitation of the research
Every research papers have some limitations and the current research is no exception. One of the
major limitation of this research is that there is no qualitative analysis conducted which would
have provide more detail analysis about the relationship between R&D and the sales.
Furthermore the data is only collected among 5 firms which can be increased. In terms of
analysis only the regression and correlation analysis has been conducted whereas other analysis
such as co-integration could have been tested. Apart from this the monetary and time limitation
were there while conducting the research.
12
References
Armstrong, J. S. (2012). Illusions in regression analysis. International Journal of Forecasting, 6,
689–694.
Başgoze, P., & Sayin, H. C. (2013). The Effect Of R&D Expenditure (Investments) On Firm
Value: Case Of Istanbul Stock Exchange. Journal of Business, Economics & Finance, 2(3),
5–12.
Bollen, B., Skully, M., Tripe, D., & Wei, X. (2014). The Global Financial Crisis and Its Impact
on Australian Bank Risk. International Review of Finance, 15(1), 89–111.
Brown, C., & Davis, K. (2011). Australia’s Experience in the Global Financial Crisis.
Melbourne.
Cerrito, P. B. (2010). The Difference Between Predictive Modeling and Regression. Louisville.
Creswell, J. W. (2003). Research design Qualitative quantitative and mixed methods approaches.
Research Design Qualitative Quantitative and Mixed Methods Approaches, 3–26.
https://doi.org/10.3109/08941939.2012.723954
DIPP. (2012). FDI IN AUTOMOBILE INDUSTRY. New Delhi.
13
Paraphrase This Document
Need a fresh take? Get an instant paraphrase of this document with our AI Paraphraser
Ernst, H., Hoyer, W. D., & Rübsaamen, C. (2010). Sales, Marketing, and Research-
andDevelopment Cooperation Across New Product Development Stages: Implications for
Success. Journal of Marketing, 74, 80–92.
George, B., Seals, S., & Aban, I. (2014). Survival analysis and regression models. NCBI, 21(4),
686–694.
Greene, W. H. (2003). Econometric Analysis. (P. Education, Ed.), Journal of the American
Statistical Association (Vol. 97). Prentice Hall. https://doi.org/10.1198/jasa.2002.s458
Imran, A., Nisar, Q. A., & Ashraf, S. (2014). Exploring Relationship among Organizational
Learning Practices, Innovativeness and non-financial performance: A descriptive study on
NGOs Sector. International Journal of Academic Research in Business and Social Sciences,
4(10), 193–209.
Jaisinghani, D. (2016). Impact of R&D on profitability in the pharma sector: an empirical study
from India. Journal of Asia Business Studies, 10(2), 194–210.
Jha, R., & Kulkarni, V. S. (2015). Inflation, its volatility and the inflation-growth tradeoff in
India. International Journal of Emerging Markets, 1–15. https://doi.org/10.1108/IJoEM-09-
2013-0145
Kangogo, J., & Gakure, R. (2013). Factors Affecting Electronic Procurement Implementation in
Automobile Industry of Kenya. International Journal of Management Sciences, 1(6), 193–
203.
Koupaie, H. M., Ibrahim, S., & Hosseinkhani, J. (2013). Outlier Detection in Stream Data by
Clustering Method. International Journal of Advanced Computer Science and Information
Technology, 2(3), 101–110.
Krishnaven, M., & Vidya, R. (2015). Growth of Indian Automobile Industry. International
Journal of Current Research and Academic Review, 3(2), 110–118.
Kula, S., & Guler2, A. (2014). Influence of Supervisor Support on Job Satisfaction Levels: An
Evaluation of Turkish National Police (TNP) Officers in the Istanbul Police Department.
International Journal of Criminal Justice Sciences, 9, 2009–2224.
Kumar, R. (2014). Research Methodology: A Step-by-Step Guide for Beginners. SAGE
Publications.
Kumar, V., Kumar, S., & Singh, A. K. (2013). Outlier Detection: A Clustering-Based Approach.
International Journal of Science and Modern Engineering (IJISME), 1(7).
Lee, D. R. (2012). The Keynesian Path to Fiscal Irresponsibility. Cato Journal, 32.
14
Monem A Mohammed. (2014). Survival Analysis By Using Cox Regression Model with
Application. International Journal of Scientific & Technology, 3(11).
Mukaka, M. M. (2012). Statistics corner: A guide to appropriate use of correlation coefficient in
medical research. Malawi Medical Journal : The Journal of Medical Association of Malawi,
24(3), 69–71.
Pandit, S., Wasley, C. E., & Zach, T. (2011). The Effect of Research and Development (R&D)
Inputs and Outputs on the Relation between the Uncertainty of Future Operating
Performance and R&D Expenditures. Journal of Accounting, Auditing & Finance, 26(1),
121–144.
Pinto, J. K., & Slevin, D. P. (1989). Critical sucess factors in R&D Projects. Research Journal of
Technol Management, 4, 31–35.
Shihab, R. A., Soufan, T., & Abdul-Khaliq, S. (2014). The Causal Relationship between Exports
and Economic Growth in Jordan. International Journal of Business and Social Science,
5(3).
Skrivanek, S. (2009). The Use of Dummy Variables in Regression Analysis. Morestream, LLC.
Stock, G. N., & McFadden, K. (2007). Organizational culture, critical success factors, and the
reduction of hospital errors. International Journal of Production Economics, 106(2), 368–
392\.
Teddlie, C., & Yu, F. (2007). Mixed Methods Sampling: A Typology With Examples. Journal of
Mixed Methods Research, 1(1), 77–100. https://doi.org/10.1177/2345678906292430
The World Bank. (2015). Research and development expenditure (% of GDP). Retrieved
October 29, 2017, from https://data.worldbank.org/indicator/GB.XPD.RSDV.GD.ZS
Urrutia, J. L. (1995). Tests of random walk and market efficiency. Journal of Financial
Research, 18, 299–309.
Usman, M., Shaique, M., Khan, S., & Baig, N. (2017). Impact Of R&D Investment On Firm
Performance And Firm Value: Evidence From Developed Nations (G-7). Wuhan.
VanderPal, G. A. (2015). Impact of R&D Expenses and Corporate Financial Performance.
Journal of Accounting and Finance, 15(7), 135–149.
Wang, C. L., & Ahmed, P. K. (2004). The development and validation of the organisational
innovativeness construct using confirmatory factor analysis. European Journal of
Innovation Management, 7(4), 303–313. https://doi.org/10.1108/14601060410565056
15
Appendix
Sources of the data:
https://shareholder.ford.com/investors/financials/annual-reports/default.aspx
https://www.mitsubishi-motors.com/en/investors/library/anual.html?intcid2=investors-library-annual
https://www.nissan-global.com/EN/IR/LIBRARY/AR/2018/
https://www.toyota-global.com/investors/ir_library/annual/
https://www.volkswagenag.com/en/InvestorRelations/news-and-publications/Annual_Reports.html
https://www.statista.com/statistics/279648/research-and-development-spending-at-toyota/
16
1 out of 16
Related Documents


Your All-in-One AI-Powered Toolkit for Academic Success.
+13062052269
info@desklib.com
Available 24*7 on WhatsApp / Email
![[object Object]](/_next/static/media/star-bottom.7253800d.svg)
Unlock your academic potential
© 2024 | Zucol Services PVT LTD | All rights reserved.