Financial Analysis: Comparative Ratio Report on Stockland & Mirvac
VerifiedAdded on 2023/06/05

Paraphrase This Document
The preparation and presentation of financial statements form a crucial task of the management,
analyzing such financial statements with the best possible tools is a crucial task for the investors
and all such users intending to use these statements. Ratio analysis is one such comparative tool
used to understand the financial position of the company, its performance over the last years, it's
trend analysis, comparison with other companies in the same industry, etc. Ratio analysis
however considers only financial information and neglects every non-financial information
which might be important to understand the actions of the company better than the numbers
itself.
INTRODUCTION...........................................................................................................................4
RATIO ANALYSIS........................................................................................................................5
COMPARISON OF OVERALL PERFORMANCE.....................................................................25
RECOMMENDATION.................................................................................................................26
CONCLUSION..............................................................................................................................27
Bibliography..................................................................................................................................28
⊘ This is a preview!⊘
Do you want full access?
Subscribe today to unlock all pages.
Trusted by 1+ million students worldwide
As a business management consultant, being appointed by Mr. Benson Evans who is the Chief
Operations Officer of Hotel Properties Limited (HPL), the companies to be compared are
Stockland Group and Mirvac Group. Both of these companies are involved in real estate business
and have approached HPL for potential partnership in residential and resort development
(Atkinson, 2012). As part of the consultancy agreement, the overall performance of both the
companies have been analyzed individually using ratio analysis as stated below (Alvarez, 2013):
Paraphrase This Document
[all figures are in $]
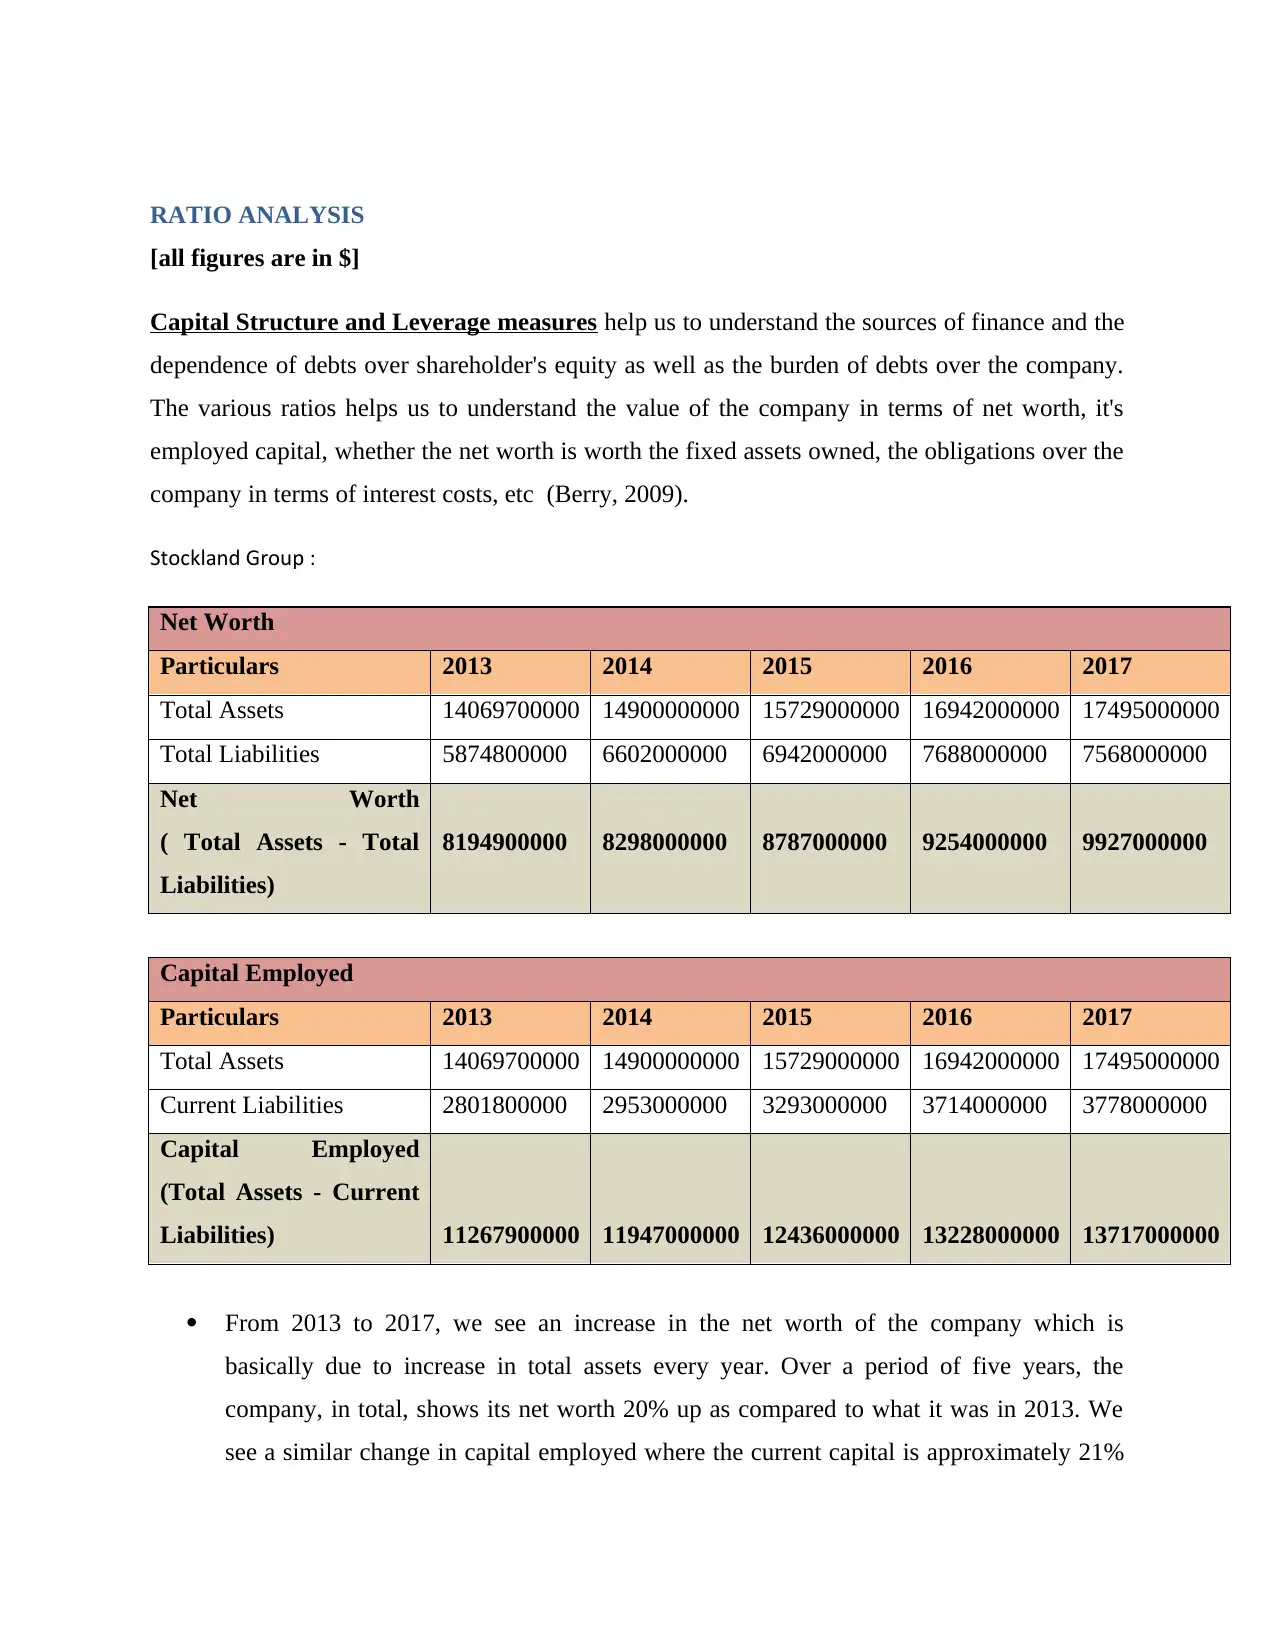
Capital Structure and Leverage measures help us to understand the sources of finance and the
dependence of debts over shareholder's equity as well as the burden of debts over the company.
The various ratios helps us to understand the value of the company in terms of net worth, it's
employed capital, whether the net worth is worth the fixed assets owned, the obligations over the
company in terms of interest costs, etc (Berry, 2009).
Stockland Group :
Net Worth
Particulars 2013 2014 2015 2016 2017
Total Assets 14069700000 14900000000 15729000000 16942000000 17495000000
Total Liabilities 5874800000 6602000000 6942000000 7688000000 7568000000
Net Worth
( Total Assets - Total
Liabilities)
8194900000 8298000000 8787000000 9254000000 9927000000
Capital Employed
Particulars 2013 2014 2015 2016 2017
Total Assets 14069700000 14900000000 15729000000 16942000000 17495000000
Current Liabilities 2801800000 2953000000 3293000000 3714000000 3778000000
Capital Employed
(Total Assets - Current
Liabilities) 11267900000 11947000000 12436000000 13228000000 13717000000
From 2013 to 2017, we see an increase in the net worth of the company which is
basically due to increase in total assets every year. Over a period of five years, the
company, in total, shows its net worth 20% up as compared to what it was in 2013. We
see a similar change in capital employed where the current capital is approximately 21%
employed.
Fixed Assets To Net Worth Ratio
Particulars 2013 2014 2015 2016 2017
Fixed Assets 12862800000 13294000000 14575000000 15531000000 16172000000
Net Worth 8194900000 8298000000 8787000000 9254000000 9927000000
Fixed Assets to Net
Worth Ratio (Fixed
Assets / Net Worth) 1.57 1.60 1.66 1.68 1.63
Current Liablities To Net Worth
Particulars 2013 2014 2015 2016 2017
Current Liabilities 2801800000 2953000000 3293000000 3714000000 3778000000
Net Worth 8194900000 8298000000 8787000000 9254000000 9927000000
Current Liabilities to
Net Worth (Current
Liabilities / Net Worth)
0.34 0.36 0.37 0.40 0.38
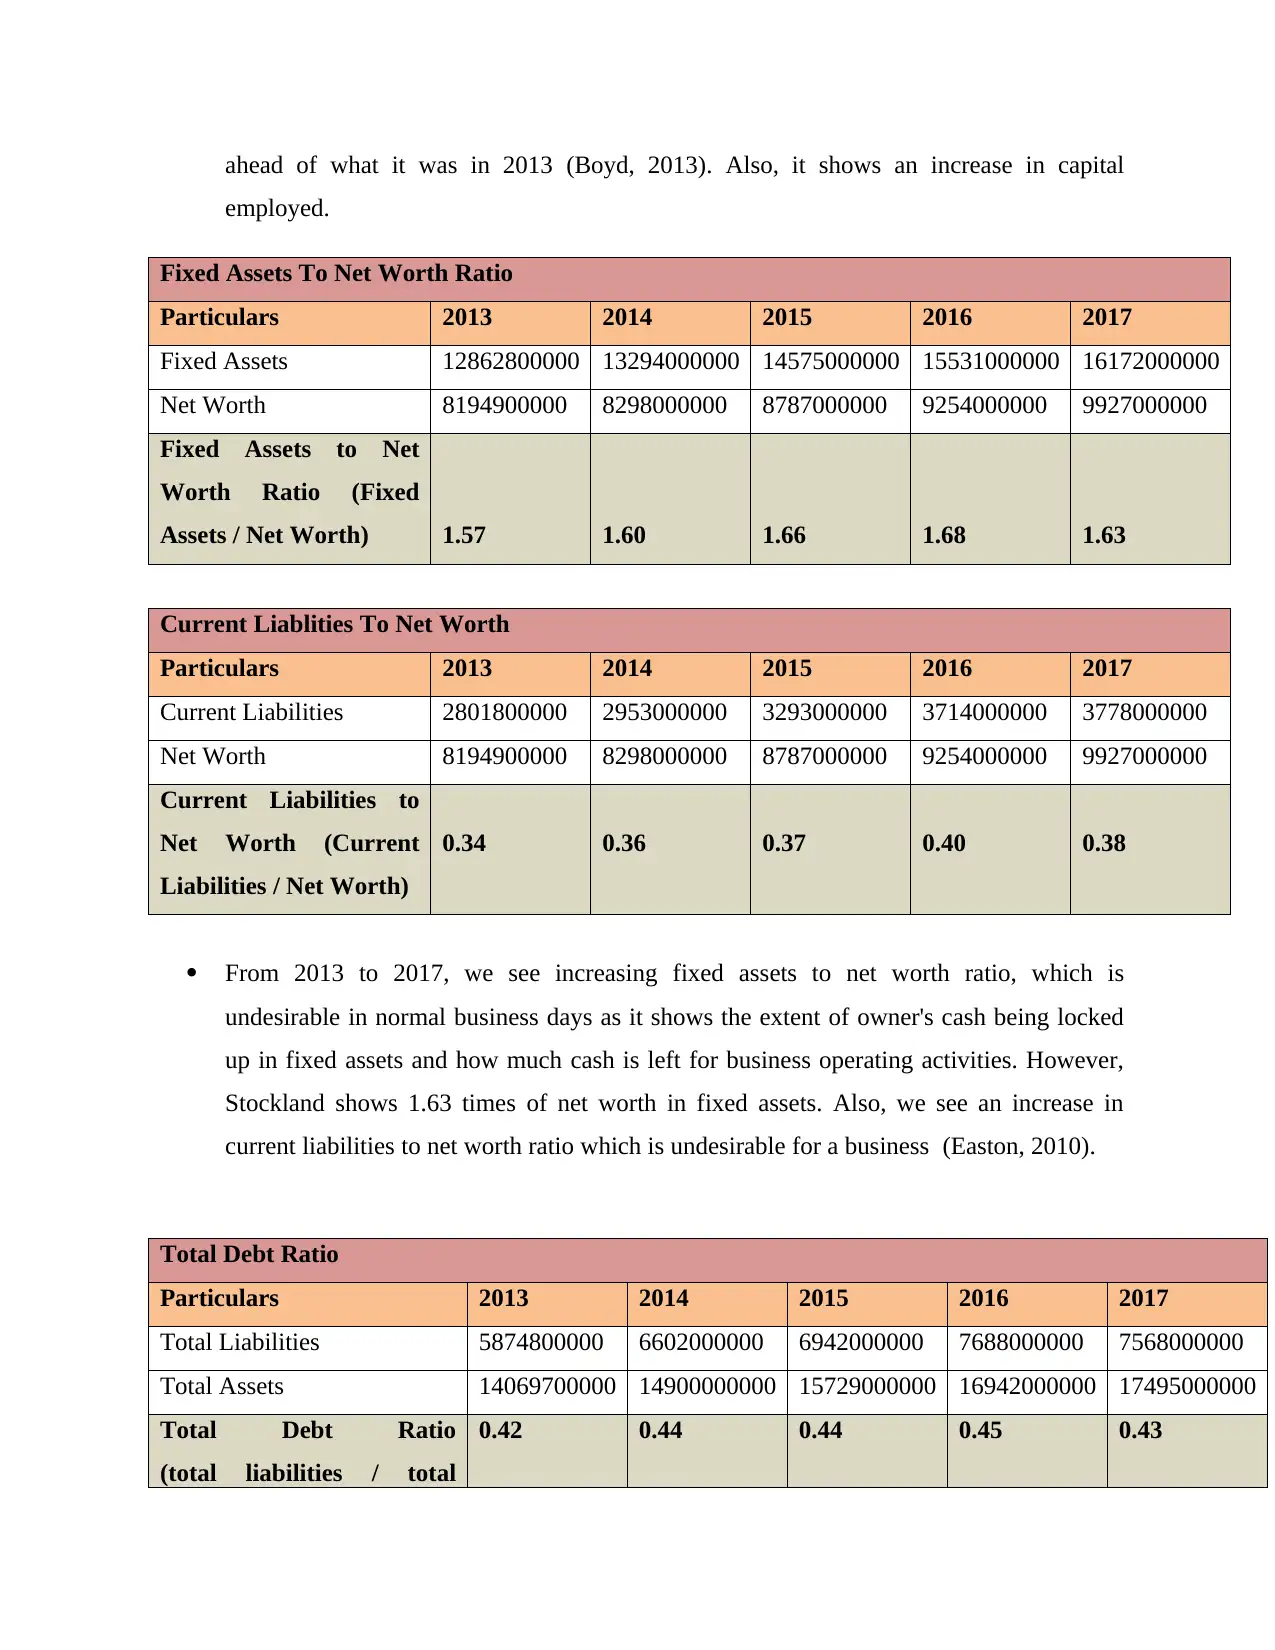
From 2013 to 2017, we see increasing fixed assets to net worth ratio, which is
undesirable in normal business days as it shows the extent of owner's cash being locked
up in fixed assets and how much cash is left for business operating activities. However,
Stockland shows 1.63 times of net worth in fixed assets. Also, we see an increase in
current liabilities to net worth ratio which is undesirable for a business (Easton, 2010).
Total Debt Ratio
Particulars 2013 2014 2015 2016 2017
Total Liabilities 5874800000 6602000000 6942000000 7688000000 7568000000
Total Assets 14069700000 14900000000 15729000000 16942000000 17495000000
Total Debt Ratio
(total liabilities / total
0.42 0.44 0.44 0.45 0.43
⊘ This is a preview!⊘
Do you want full access?
Subscribe today to unlock all pages.
Trusted by 1+ million students worldwide
Debt Equity Ratio
Particulars 2013 2014 2015 2016 2017
Total Debts 2352400000 2815000000 3030000000 3319000000 3272000000
Equity/Shareholder's funds 8194900000 8298000000 8787000000 9254000000 9927000000
Debt-Equity Ratio
(debt / equity) 0.29 0.34 0.34 0.36 0.33
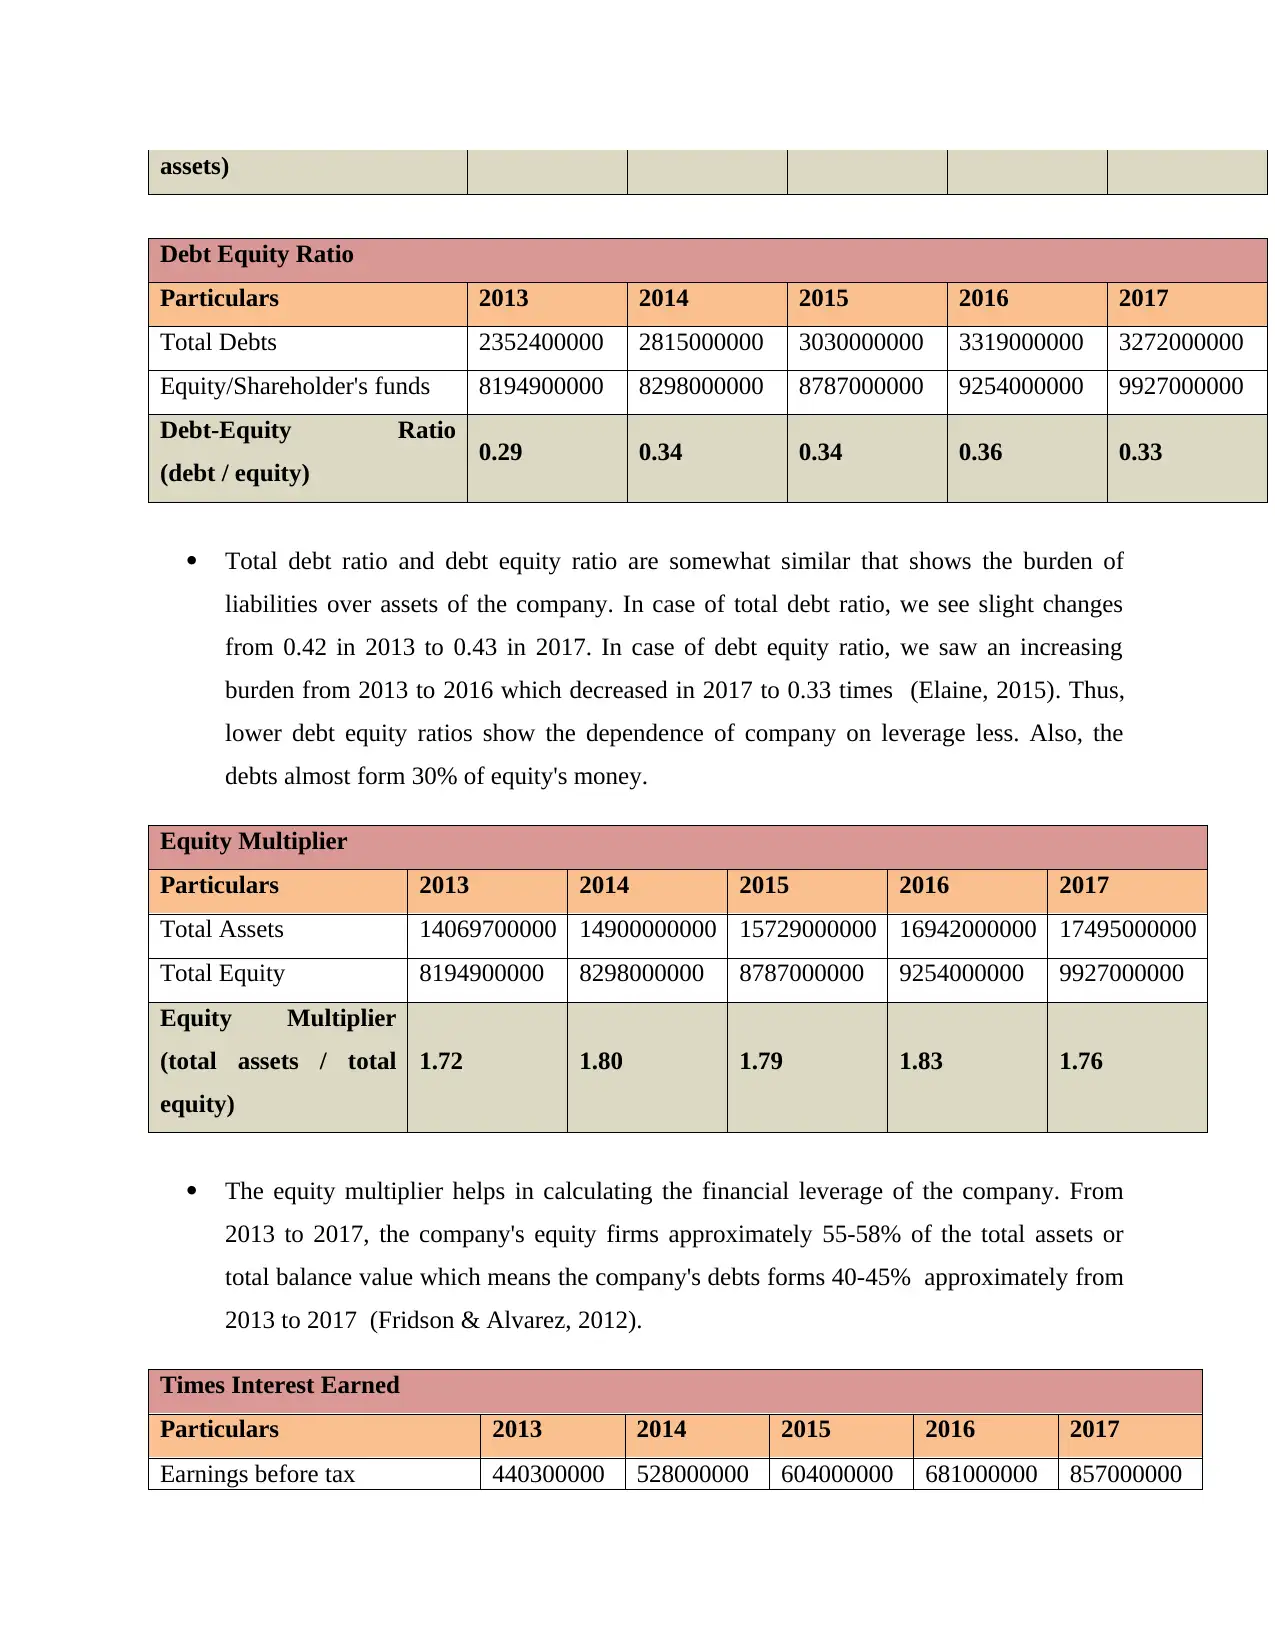
Total debt ratio and debt equity ratio are somewhat similar that shows the burden of
liabilities over assets of the company. In case of total debt ratio, we see slight changes
from 0.42 in 2013 to 0.43 in 2017. In case of debt equity ratio, we saw an increasing
burden from 2013 to 2016 which decreased in 2017 to 0.33 times (Elaine, 2015). Thus,
lower debt equity ratios show the dependence of company on leverage less. Also, the
debts almost form 30% of equity's money.
Equity Multiplier
Particulars 2013 2014 2015 2016 2017
Total Assets 14069700000 14900000000 15729000000 16942000000 17495000000
Total Equity 8194900000 8298000000 8787000000 9254000000 9927000000
Equity Multiplier
(total assets / total
equity)
1.72 1.80 1.79 1.83 1.76
The equity multiplier helps in calculating the financial leverage of the company. From
2013 to 2017, the company's equity firms approximately 55-58% of the total assets or
total balance value which means the company's debts forms 40-45% approximately from
2013 to 2017 (Fridson & Alvarez, 2012).
Times Interest Earned
Particulars 2013 2014 2015 2016 2017
Earnings before tax 440300000 528000000 604000000 681000000 857000000
Paraphrase This Document
Times Interest Earned
(earnings before taxes and
interest / interest payment)
5.57 6.68 8.75 9.20 10.85
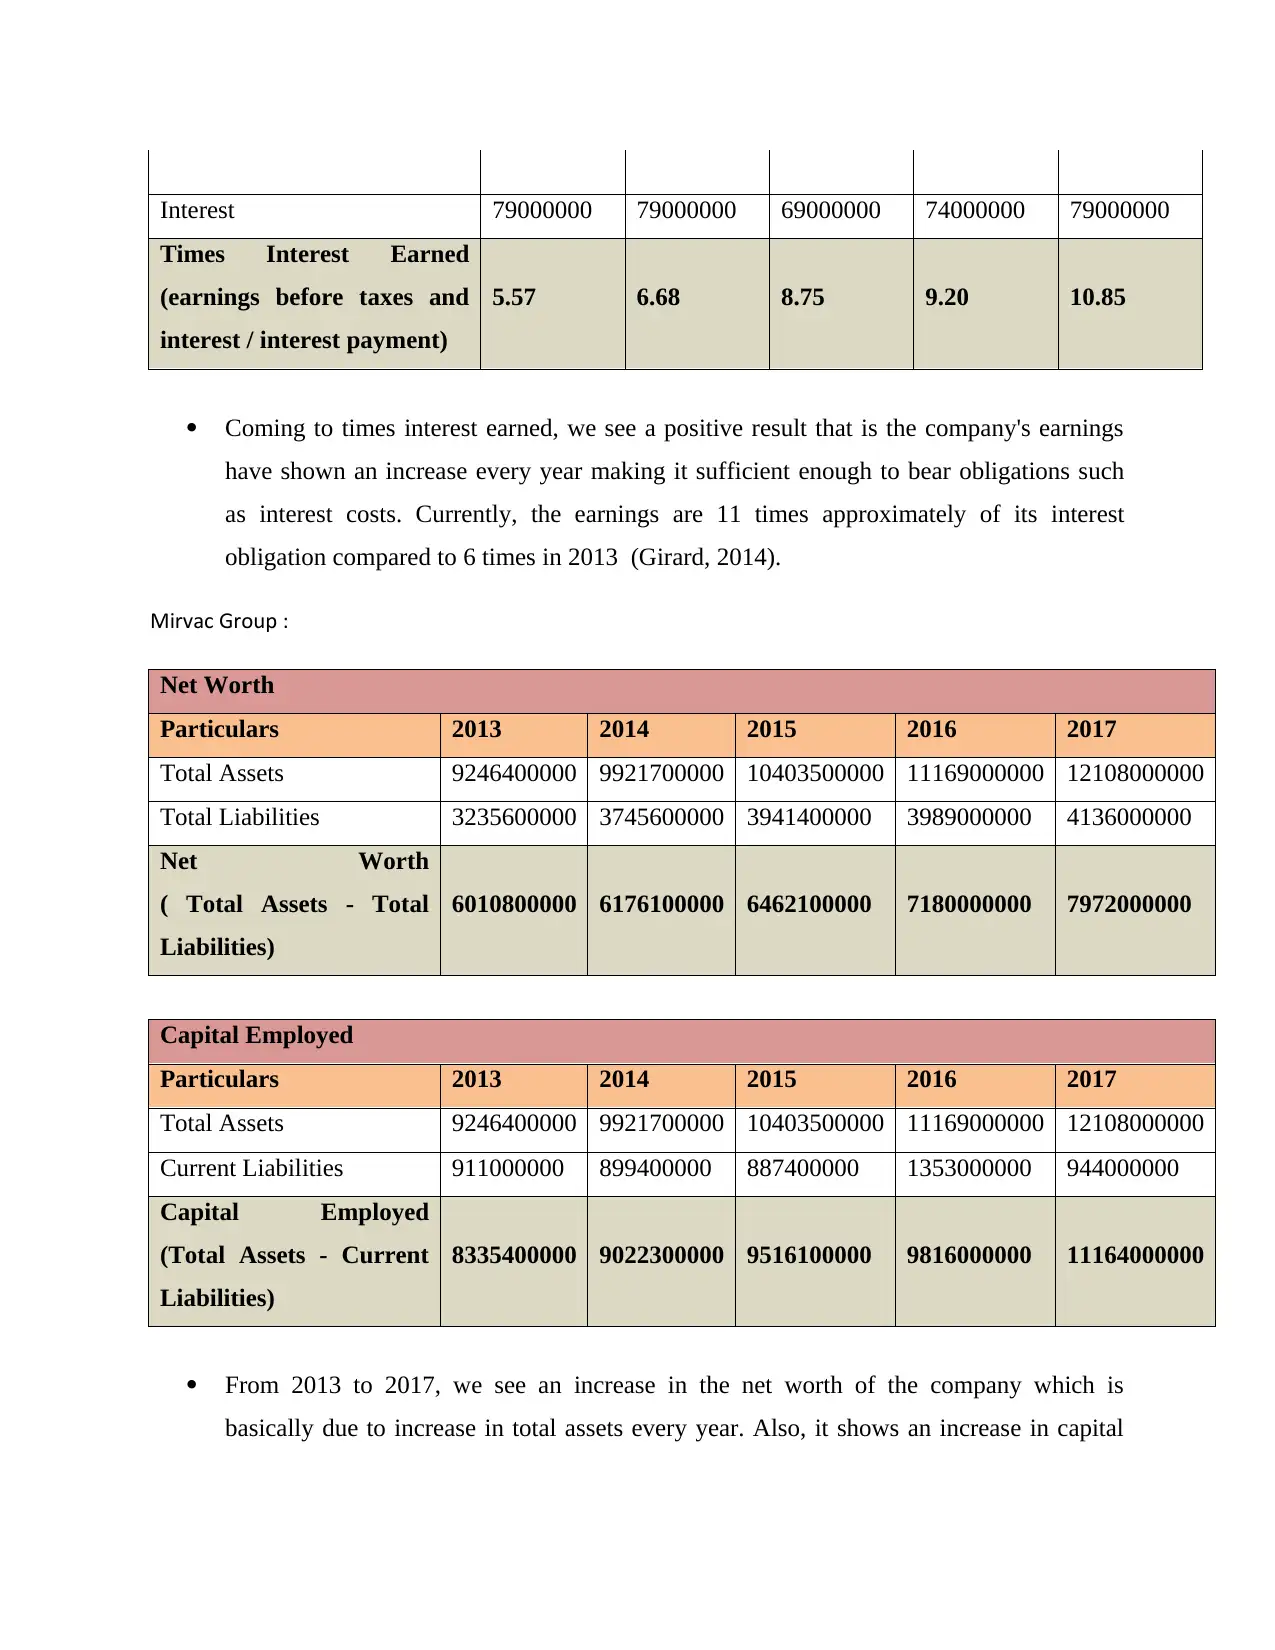
Coming to times interest earned, we see a positive result that is the company's earnings
have shown an increase every year making it sufficient enough to bear obligations such
as interest costs. Currently, the earnings are 11 times approximately of its interest
obligation compared to 6 times in 2013 (Girard, 2014).
Mirvac Group :
Net Worth
Particulars 2013 2014 2015 2016 2017
Total Assets 9246400000 9921700000 10403500000 11169000000 12108000000
Total Liabilities 3235600000 3745600000 3941400000 3989000000 4136000000
Net Worth
( Total Assets - Total
Liabilities)
6010800000 6176100000 6462100000 7180000000 7972000000
Capital Employed
Particulars 2013 2014 2015 2016 2017
Total Assets 9246400000 9921700000 10403500000 11169000000 12108000000
Current Liabilities 911000000 899400000 887400000 1353000000 944000000
Capital Employed
(Total Assets - Current
Liabilities)
8335400000 9022300000 9516100000 9816000000 11164000000
From 2013 to 2017, we see an increase in the net worth of the company which is
basically due to increase in total assets every year. Also, it shows an increase in capital
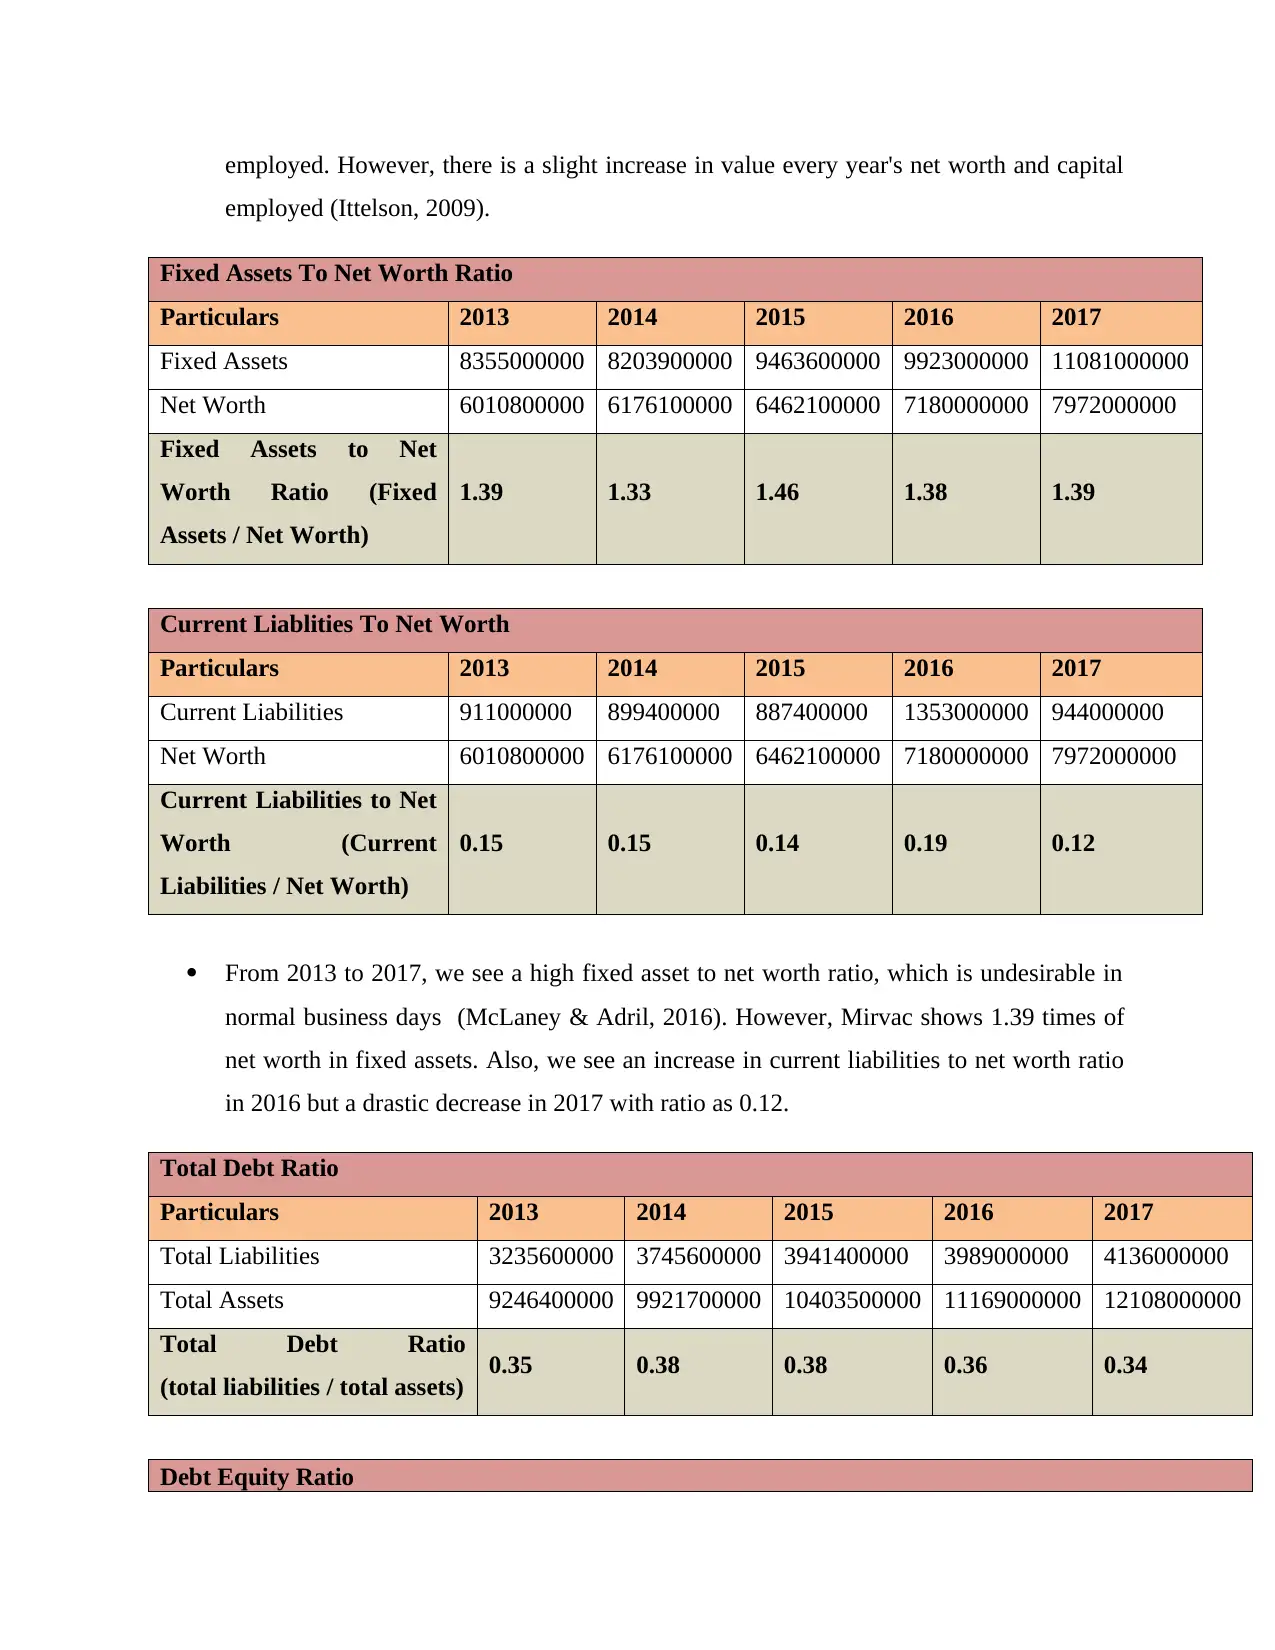
employed (Ittelson, 2009).
Fixed Assets To Net Worth Ratio
Particulars 2013 2014 2015 2016 2017
Fixed Assets 8355000000 8203900000 9463600000 9923000000 11081000000
Net Worth 6010800000 6176100000 6462100000 7180000000 7972000000
Fixed Assets to Net
Worth Ratio (Fixed
Assets / Net Worth)
1.39 1.33 1.46 1.38 1.39
Current Liablities To Net Worth
Particulars 2013 2014 2015 2016 2017
Current Liabilities 911000000 899400000 887400000 1353000000 944000000
Net Worth 6010800000 6176100000 6462100000 7180000000 7972000000
Current Liabilities to Net
Worth (Current
Liabilities / Net Worth)
0.15 0.15 0.14 0.19 0.12
From 2013 to 2017, we see a high fixed asset to net worth ratio, which is undesirable in
normal business days (McLaney & Adril, 2016). However, Mirvac shows 1.39 times of
net worth in fixed assets. Also, we see an increase in current liabilities to net worth ratio
in 2016 but a drastic decrease in 2017 with ratio as 0.12.
Total Debt Ratio
Particulars 2013 2014 2015 2016 2017
Total Liabilities 3235600000 3745600000 3941400000 3989000000 4136000000
Total Assets 9246400000 9921700000 10403500000 11169000000 12108000000
Total Debt Ratio
(total liabilities / total assets) 0.35 0.38 0.38 0.36 0.34
Debt Equity Ratio
⊘ This is a preview!⊘
Do you want full access?
Subscribe today to unlock all pages.
Trusted by 1+ million students worldwide
Total Debts 2088600000 2599700000 2747200000 2293000000 2872000000
Equity/Shareholder's funds 6010800000 6176100000 6462100000 7180000000 7972000000
Debt-Equity Ratio
(debt / equity) 0.35 0.42 0.43 0.32 0.36
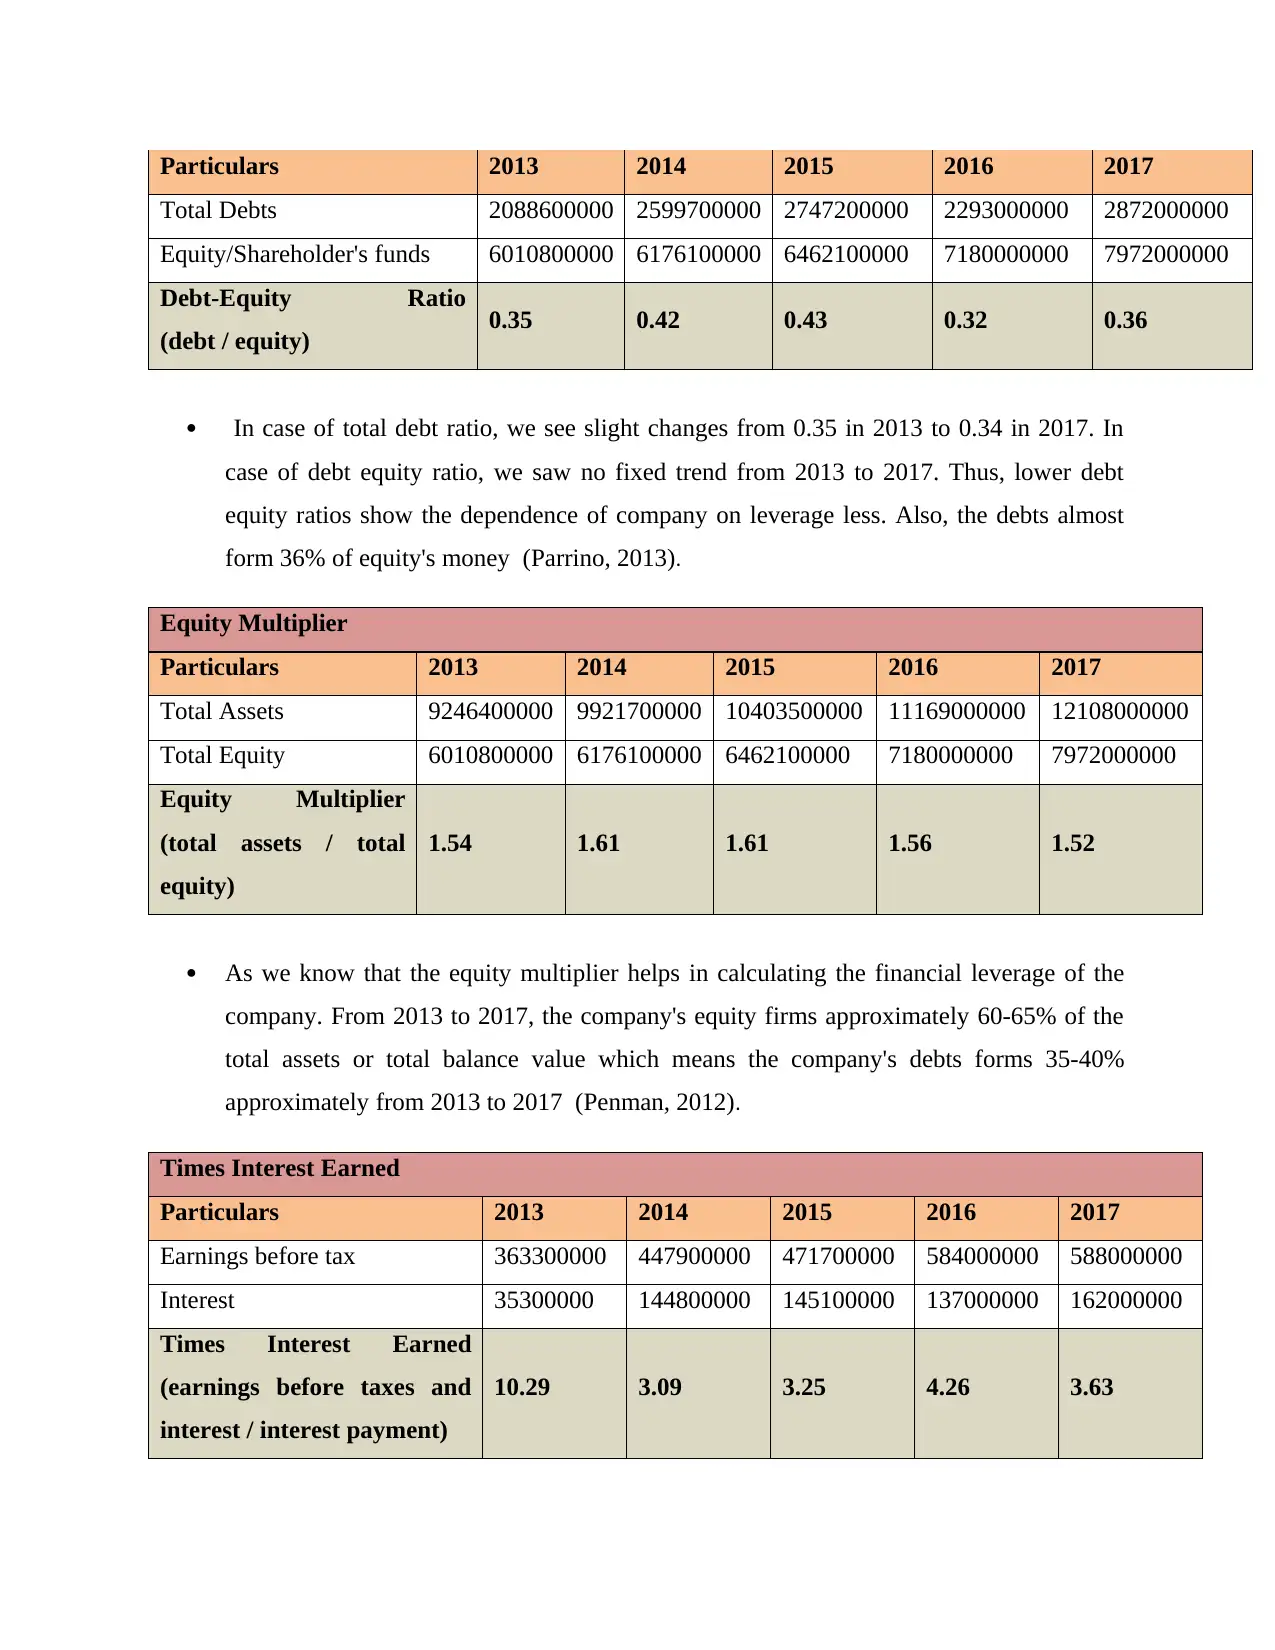
In case of total debt ratio, we see slight changes from 0.35 in 2013 to 0.34 in 2017. In
case of debt equity ratio, we saw no fixed trend from 2013 to 2017. Thus, lower debt
equity ratios show the dependence of company on leverage less. Also, the debts almost
form 36% of equity's money (Parrino, 2013).
Equity Multiplier
Particulars 2013 2014 2015 2016 2017
Total Assets 9246400000 9921700000 10403500000 11169000000 12108000000
Total Equity 6010800000 6176100000 6462100000 7180000000 7972000000
Equity Multiplier
(total assets / total
equity)
1.54 1.61 1.61 1.56 1.52
As we know that the equity multiplier helps in calculating the financial leverage of the
company. From 2013 to 2017, the company's equity firms approximately 60-65% of the
total assets or total balance value which means the company's debts forms 35-40%
approximately from 2013 to 2017 (Penman, 2012).
Times Interest Earned
Particulars 2013 2014 2015 2016 2017
Earnings before tax 363300000 447900000 471700000 584000000 588000000
Interest 35300000 144800000 145100000 137000000 162000000
Times Interest Earned
(earnings before taxes and
interest / interest payment)
10.29 3.09 3.25 4.26 3.63
Paraphrase This Document
have shown an increase every year, it is insufficient to bear obligations such as interest
costs. Currently, the earnings are 4 times approximately of its interest obligation
compared to 10 times in 2013 (Ramírez, 2018).
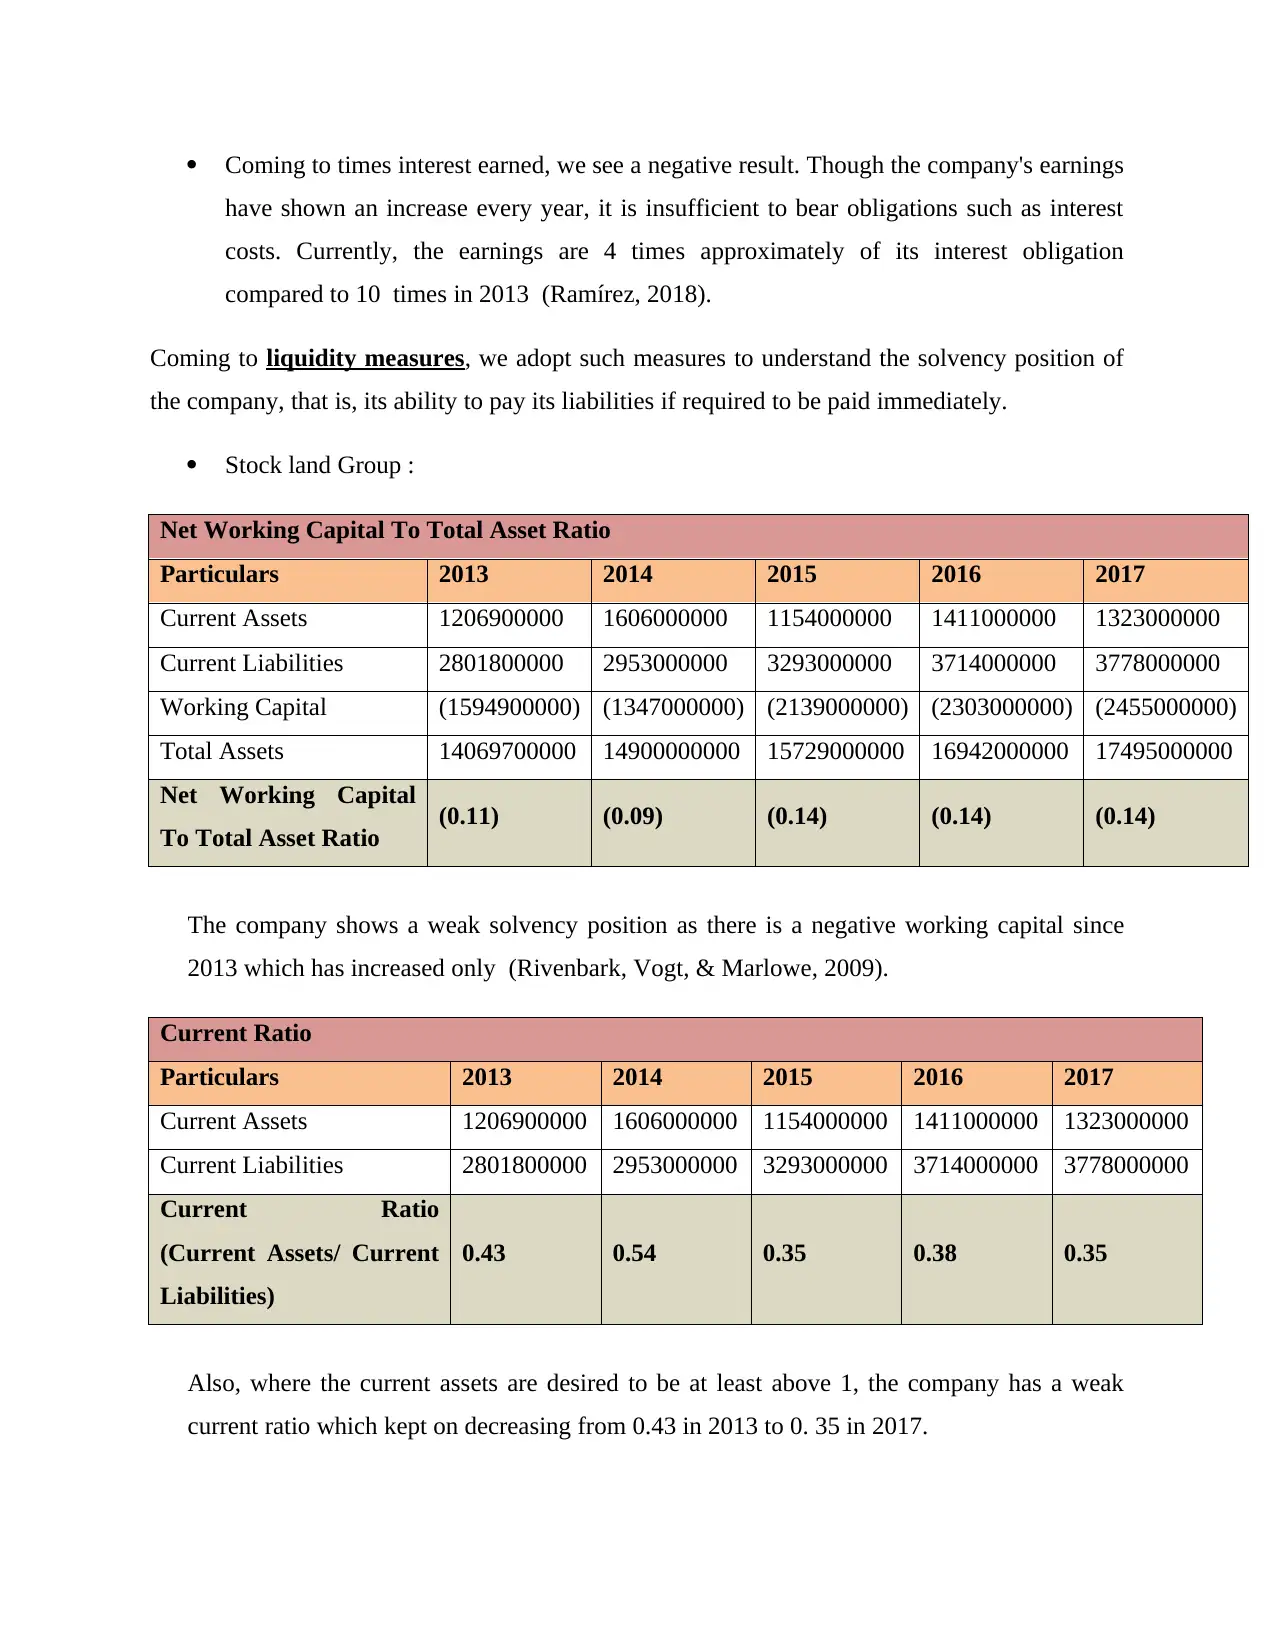
Coming to liquidity measures, we adopt such measures to understand the solvency position of
the company, that is, its ability to pay its liabilities if required to be paid immediately.
Stock land Group :
Net Working Capital To Total Asset Ratio
Particulars 2013 2014 2015 2016 2017
Current Assets 1206900000 1606000000 1154000000 1411000000 1323000000
Current Liabilities 2801800000 2953000000 3293000000 3714000000 3778000000
Working Capital (1594900000) (1347000000) (2139000000) (2303000000) (2455000000)
Total Assets 14069700000 14900000000 15729000000 16942000000 17495000000
Net Working Capital
To Total Asset Ratio (0.11) (0.09) (0.14) (0.14) (0.14)
The company shows a weak solvency position as there is a negative working capital since
2013 which has increased only (Rivenbark, Vogt, & Marlowe, 2009).
Current Ratio
Particulars 2013 2014 2015 2016 2017
Current Assets 1206900000 1606000000 1154000000 1411000000 1323000000
Current Liabilities 2801800000 2953000000 3293000000 3714000000 3778000000
Current Ratio
(Current Assets/ Current
Liabilities)
0.43 0.54 0.35 0.38 0.35
Also, where the current assets are desired to be at least above 1, the company has a weak
current ratio which kept on decreasing from 0.43 in 2013 to 0. 35 in 2017.
Particulars 2013 2014 2015 2016 2017
Current Assets 1206900000 1606000000 1154000000 1411000000 1323000000
less : CA Other 810700000 753000000 881000000 1069000000 923000000
Quick Assets 396200000 853000000 273000000 342000000 400000000
Quick Liabilities 2801800000 2953000000 3293000000 3714000000 3778000000
Quick Ratio
( Quick Assets/Quick
Liabilities)
0.14 0.29 0.08 0.09 0.11
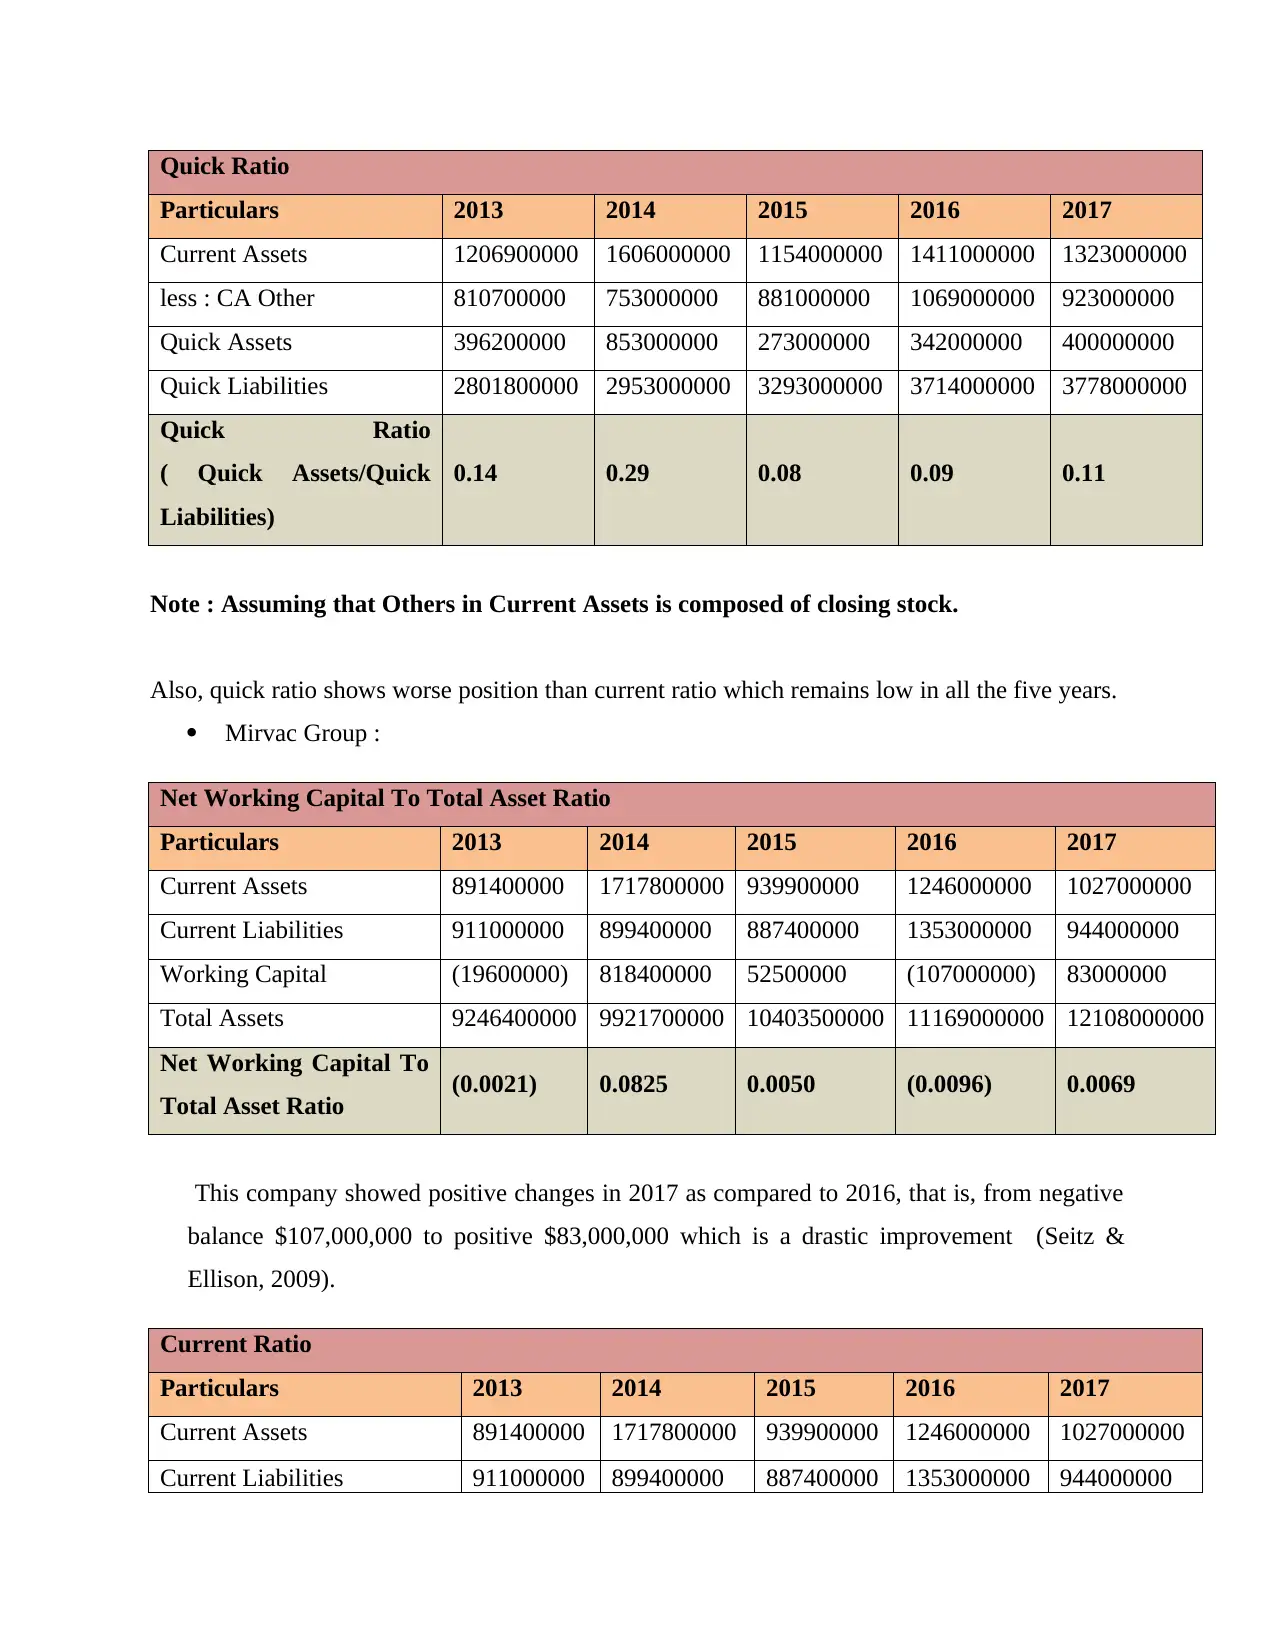
Note : Assuming that Others in Current Assets is composed of closing stock.
Also, quick ratio shows worse position than current ratio which remains low in all the five years.
Mirvac Group :
Net Working Capital To Total Asset Ratio
Particulars 2013 2014 2015 2016 2017
Current Assets 891400000 1717800000 939900000 1246000000 1027000000
Current Liabilities 911000000 899400000 887400000 1353000000 944000000
Working Capital (19600000) 818400000 52500000 (107000000) 83000000
Total Assets 9246400000 9921700000 10403500000 11169000000 12108000000
Net Working Capital To
Total Asset Ratio (0.0021) 0.0825 0.0050 (0.0096) 0.0069
This company showed positive changes in 2017 as compared to 2016, that is, from negative
balance $107,000,000 to positive $83,000,000 which is a drastic improvement (Seitz &
Ellison, 2009).
Current Ratio
Particulars 2013 2014 2015 2016 2017
Current Assets 891400000 1717800000 939900000 1246000000 1027000000
Current Liabilities 911000000 899400000 887400000 1353000000 944000000
⊘ This is a preview!⊘
Do you want full access?
Subscribe today to unlock all pages.
Trusted by 1+ million students worldwide
(Current Assets/ Current
Liabilities)
0.98 1.91 1.06 0.92 1.09
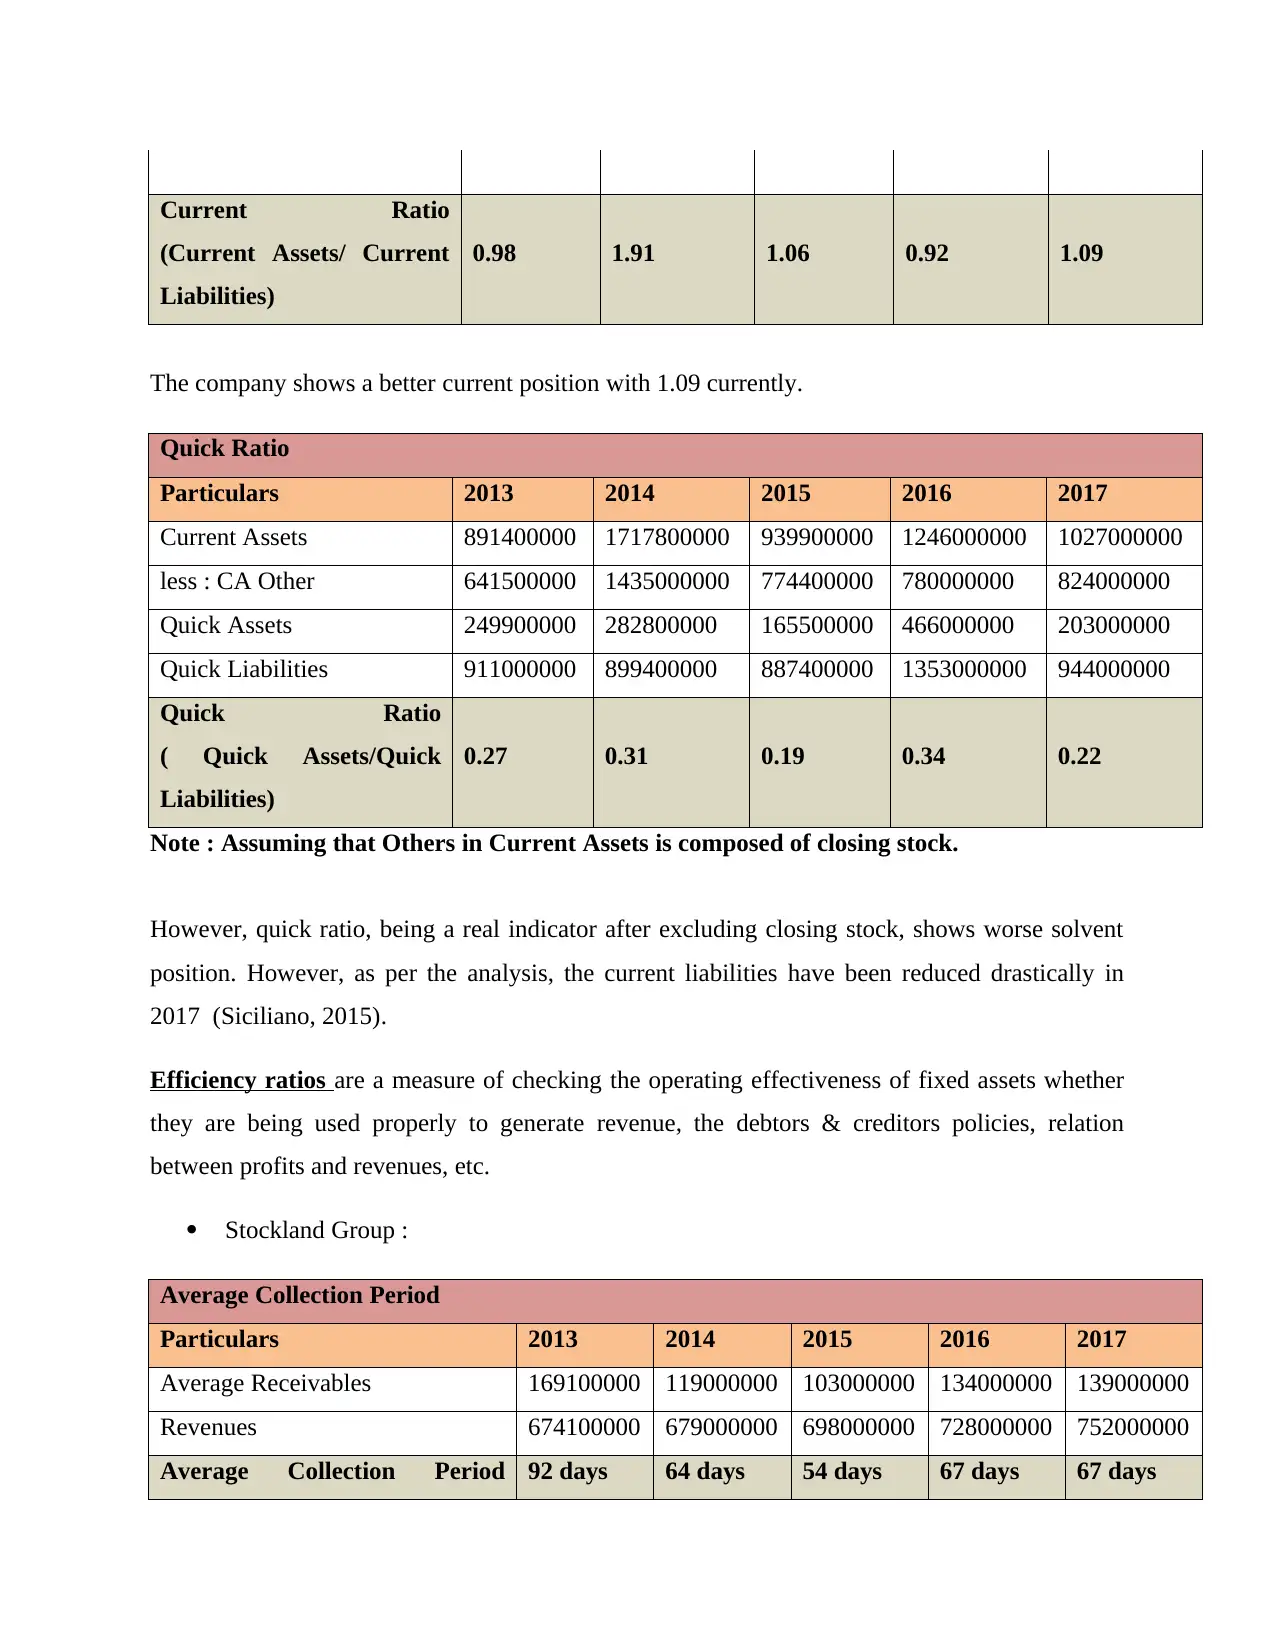
The company shows a better current position with 1.09 currently.
Quick Ratio
Particulars 2013 2014 2015 2016 2017
Current Assets 891400000 1717800000 939900000 1246000000 1027000000
less : CA Other 641500000 1435000000 774400000 780000000 824000000
Quick Assets 249900000 282800000 165500000 466000000 203000000
Quick Liabilities 911000000 899400000 887400000 1353000000 944000000
Quick Ratio
( Quick Assets/Quick
Liabilities)
0.27 0.31 0.19 0.34 0.22
Note : Assuming that Others in Current Assets is composed of closing stock.
However, quick ratio, being a real indicator after excluding closing stock, shows worse solvent
position. However, as per the analysis, the current liabilities have been reduced drastically in
2017 (Siciliano, 2015).
Efficiency ratios are a measure of checking the operating effectiveness of fixed assets whether
they are being used properly to generate revenue, the debtors & creditors policies, relation
between profits and revenues, etc.
Stockland Group :
Average Collection Period
Particulars 2013 2014 2015 2016 2017
Average Receivables 169100000 119000000 103000000 134000000 139000000
Revenues 674100000 679000000 698000000 728000000 752000000
Average Collection Period 92 days 64 days 54 days 67 days 67 days
Paraphrase This Document
Receivables*365/revenues)
[in days]
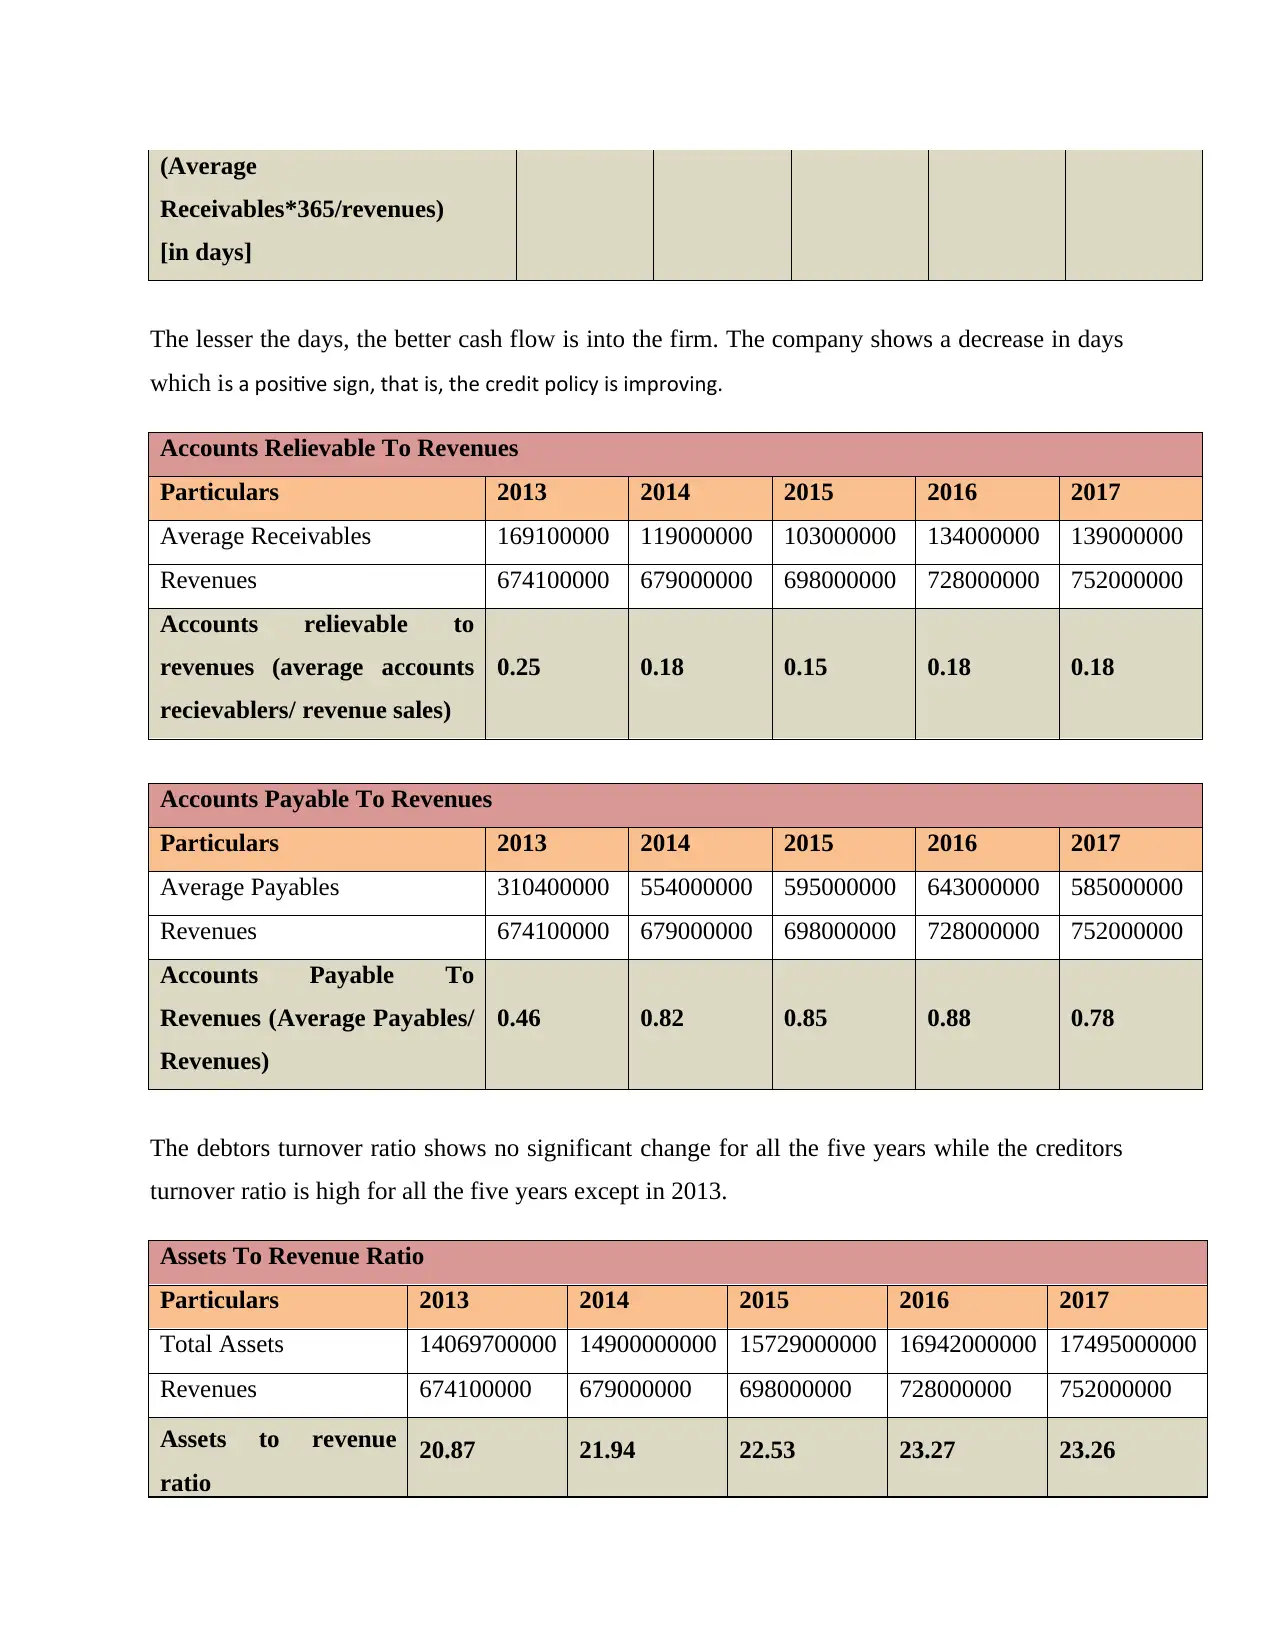
The lesser the days, the better cash flow is into the firm. The company shows a decrease in days
which is a positive sign, that is, the credit policy is improving.
Accounts Relievable To Revenues
Particulars 2013 2014 2015 2016 2017
Average Receivables 169100000 119000000 103000000 134000000 139000000
Revenues 674100000 679000000 698000000 728000000 752000000
Accounts relievable to
revenues (average accounts
recievablers/ revenue sales)
0.25 0.18 0.15 0.18 0.18
Accounts Payable To Revenues
Particulars 2013 2014 2015 2016 2017
Average Payables 310400000 554000000 595000000 643000000 585000000
Revenues 674100000 679000000 698000000 728000000 752000000
Accounts Payable To
Revenues (Average Payables/
Revenues)
0.46 0.82 0.85 0.88 0.78
The debtors turnover ratio shows no significant change for all the five years while the creditors
turnover ratio is high for all the five years except in 2013.
Assets To Revenue Ratio
Particulars 2013 2014 2015 2016 2017
Total Assets 14069700000 14900000000 15729000000 16942000000 17495000000
Revenues 674100000 679000000 698000000 728000000 752000000
Assets to revenue
ratio
20.87 21.94 22.53 23.27 23.26
Revenues)
Total Assets Ratio
Particulars 2013 2014 2015 2016 2017
Revenues 674100000 679000000 698000000 728000000 752000000
Total Assets 14069700000 14900000000 15729000000 16942000000 17495000000
Total Assets Ratio
( Revenues/ Total
Sales)
0.05 0.05 0.04 0.04 0.04
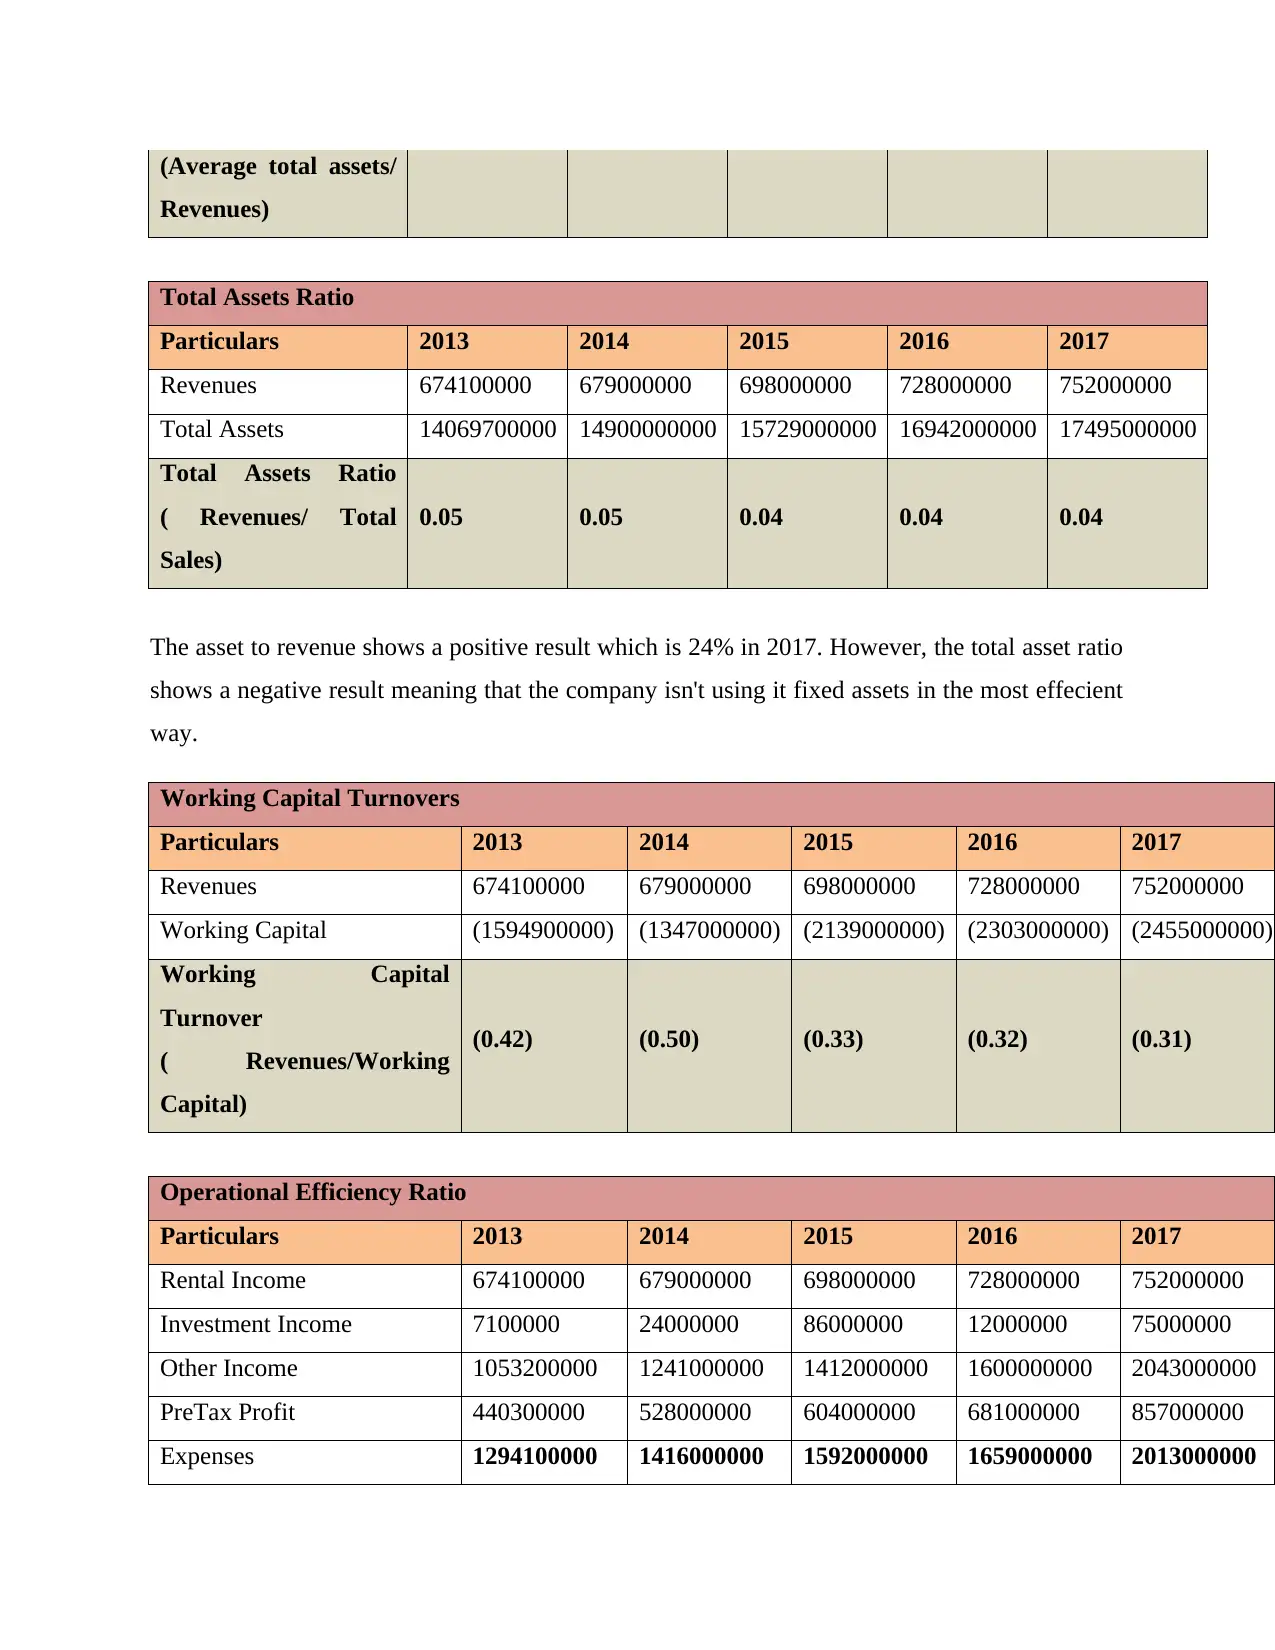
The asset to revenue shows a positive result which is 24% in 2017. However, the total asset ratio
shows a negative result meaning that the company isn't using it fixed assets in the most effecient
way.
Working Capital Turnovers
Particulars 2013 2014 2015 2016 2017
Revenues 674100000 679000000 698000000 728000000 752000000
Working Capital (1594900000) (1347000000) (2139000000) (2303000000) (2455000000)
Working Capital
Turnover
( Revenues/Working
Capital)
(0.42) (0.50) (0.33) (0.32) (0.31)
Operational Efficiency Ratio
Particulars 2013 2014 2015 2016 2017
Rental Income 674100000 679000000 698000000 728000000 752000000
Investment Income 7100000 24000000 86000000 12000000 75000000
Other Income 1053200000 1241000000 1412000000 1600000000 2043000000
PreTax Profit 440300000 528000000 604000000 681000000 857000000
Expenses 1294100000 1416000000 1592000000 1659000000 2013000000
⊘ This is a preview!⊘
Do you want full access?
Subscribe today to unlock all pages.
Trusted by 1+ million students worldwide
Operational Efficiency
Ratio (Expenses/Revenue
Sales)
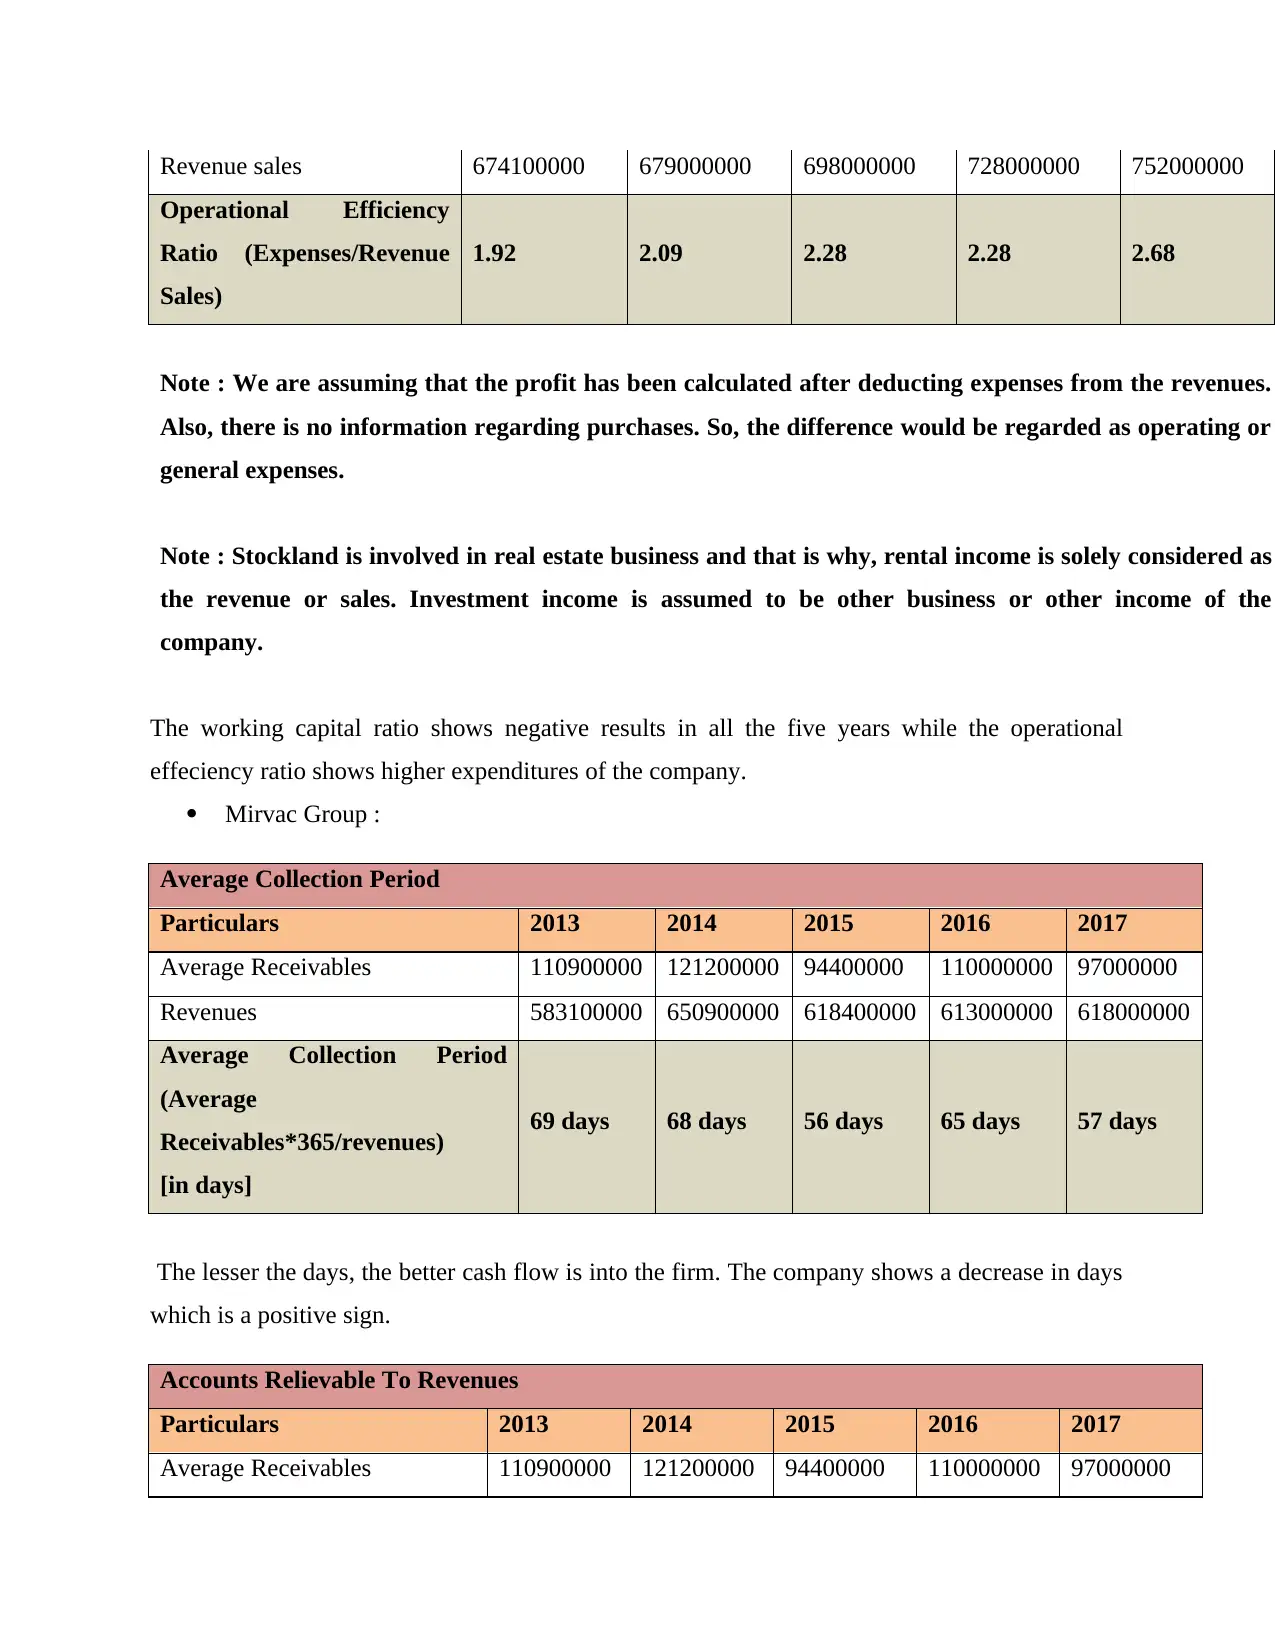
1.92 2.09 2.28 2.28 2.68
Note : We are assuming that the profit has been calculated after deducting expenses from the revenues.
Also, there is no information regarding purchases. So, the difference would be regarded as operating or
general expenses.
Note : Stockland is involved in real estate business and that is why, rental income is solely considered as
the revenue or sales. Investment income is assumed to be other business or other income of the
company.
The working capital ratio shows negative results in all the five years while the operational
effeciency ratio shows higher expenditures of the company.
Mirvac Group :
Average Collection Period
Particulars 2013 2014 2015 2016 2017
Average Receivables 110900000 121200000 94400000 110000000 97000000
Revenues 583100000 650900000 618400000 613000000 618000000
Average Collection Period
(Average
Receivables*365/revenues)
[in days]
69 days 68 days 56 days 65 days 57 days
The lesser the days, the better cash flow is into the firm. The company shows a decrease in days
which is a positive sign.
Accounts Relievable To Revenues
Particulars 2013 2014 2015 2016 2017
Average Receivables 110900000 121200000 94400000 110000000 97000000
Paraphrase This Document
Accounts relievable to
revenues (average accounts
recievablers/ revenue sales)
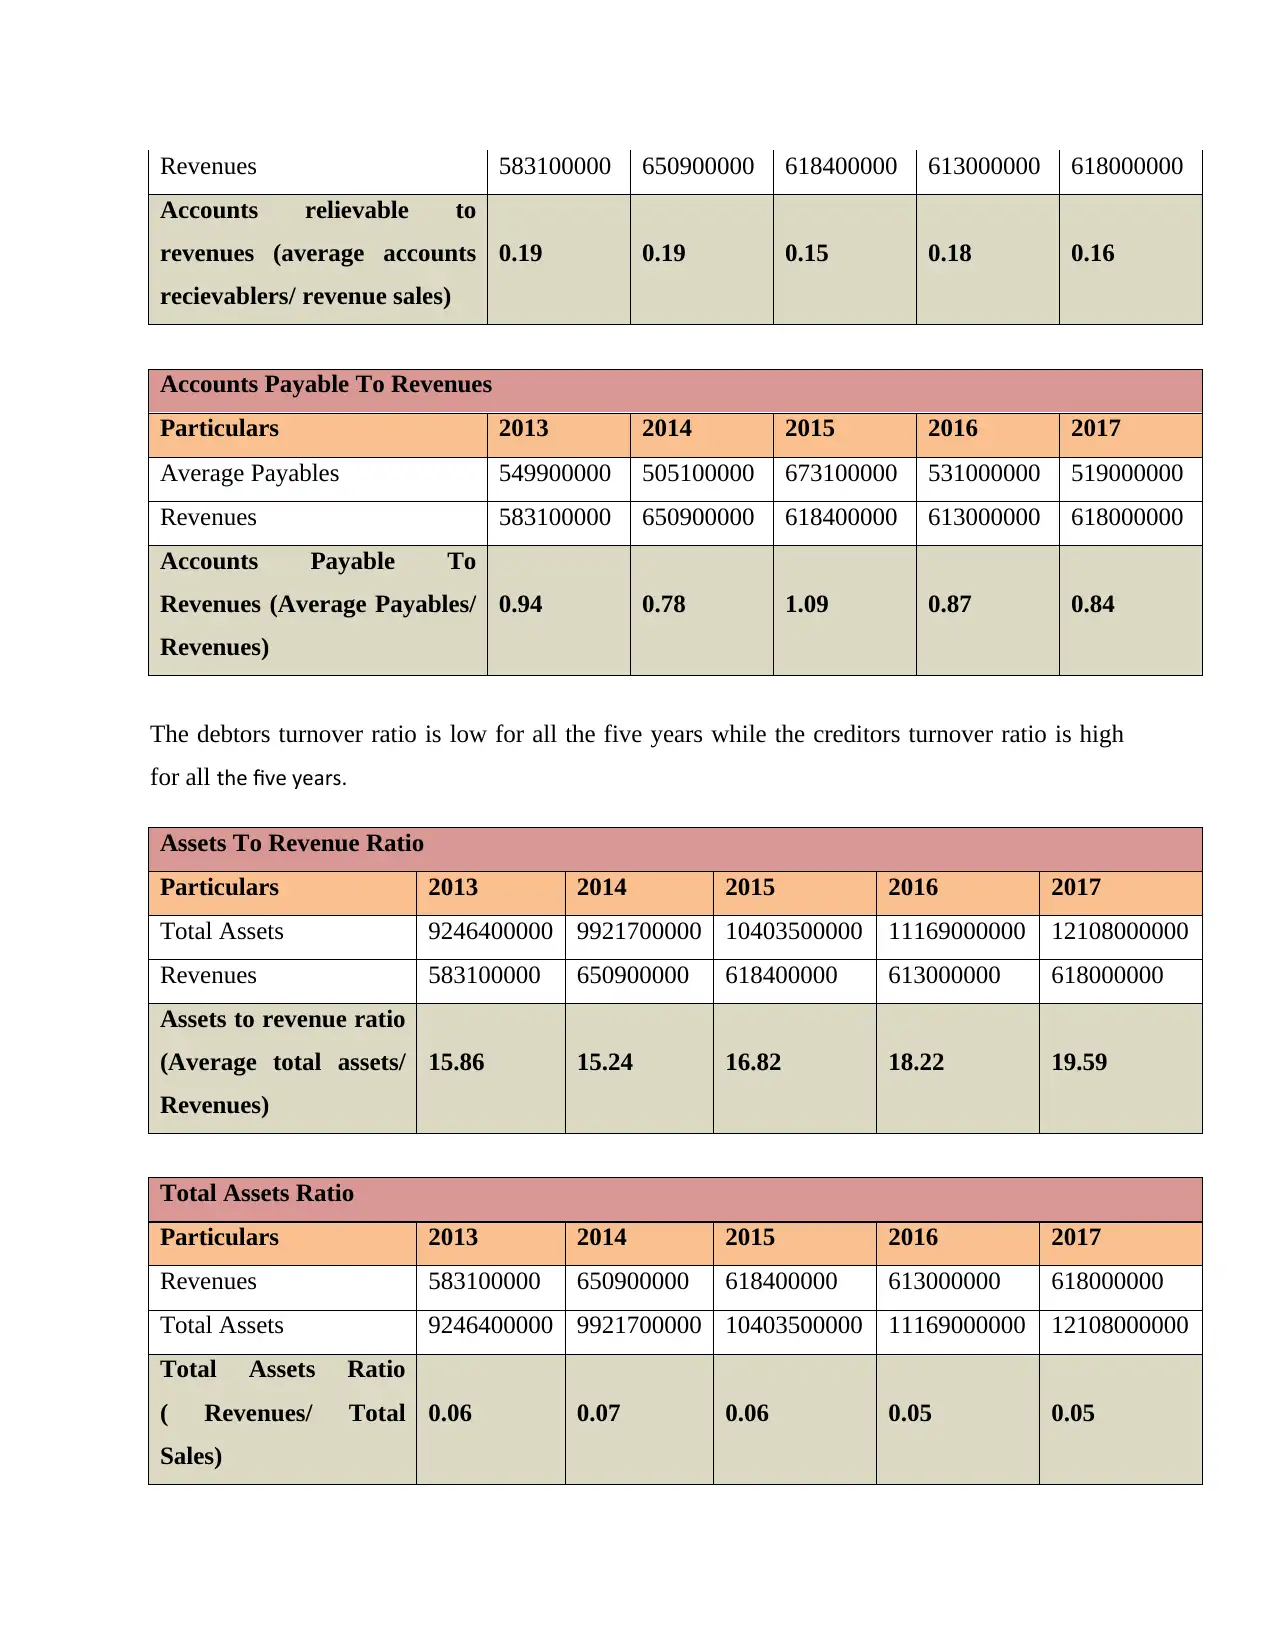
0.19 0.19 0.15 0.18 0.16
Accounts Payable To Revenues
Particulars 2013 2014 2015 2016 2017
Average Payables 549900000 505100000 673100000 531000000 519000000
Revenues 583100000 650900000 618400000 613000000 618000000
Accounts Payable To
Revenues (Average Payables/
Revenues)
0.94 0.78 1.09 0.87 0.84
The debtors turnover ratio is low for all the five years while the creditors turnover ratio is high
for all the five years.
Assets To Revenue Ratio
Particulars 2013 2014 2015 2016 2017
Total Assets 9246400000 9921700000 10403500000 11169000000 12108000000
Revenues 583100000 650900000 618400000 613000000 618000000
Assets to revenue ratio
(Average total assets/
Revenues)
15.86 15.24 16.82 18.22 19.59
Total Assets Ratio
Particulars 2013 2014 2015 2016 2017
Revenues 583100000 650900000 618400000 613000000 618000000
Total Assets 9246400000 9921700000 10403500000 11169000000 12108000000
Total Assets Ratio
( Revenues/ Total
Sales)
0.06 0.07 0.06 0.05 0.05
shows a negative result meaning that the company isn't using it fixed assets in the most effecient
way.
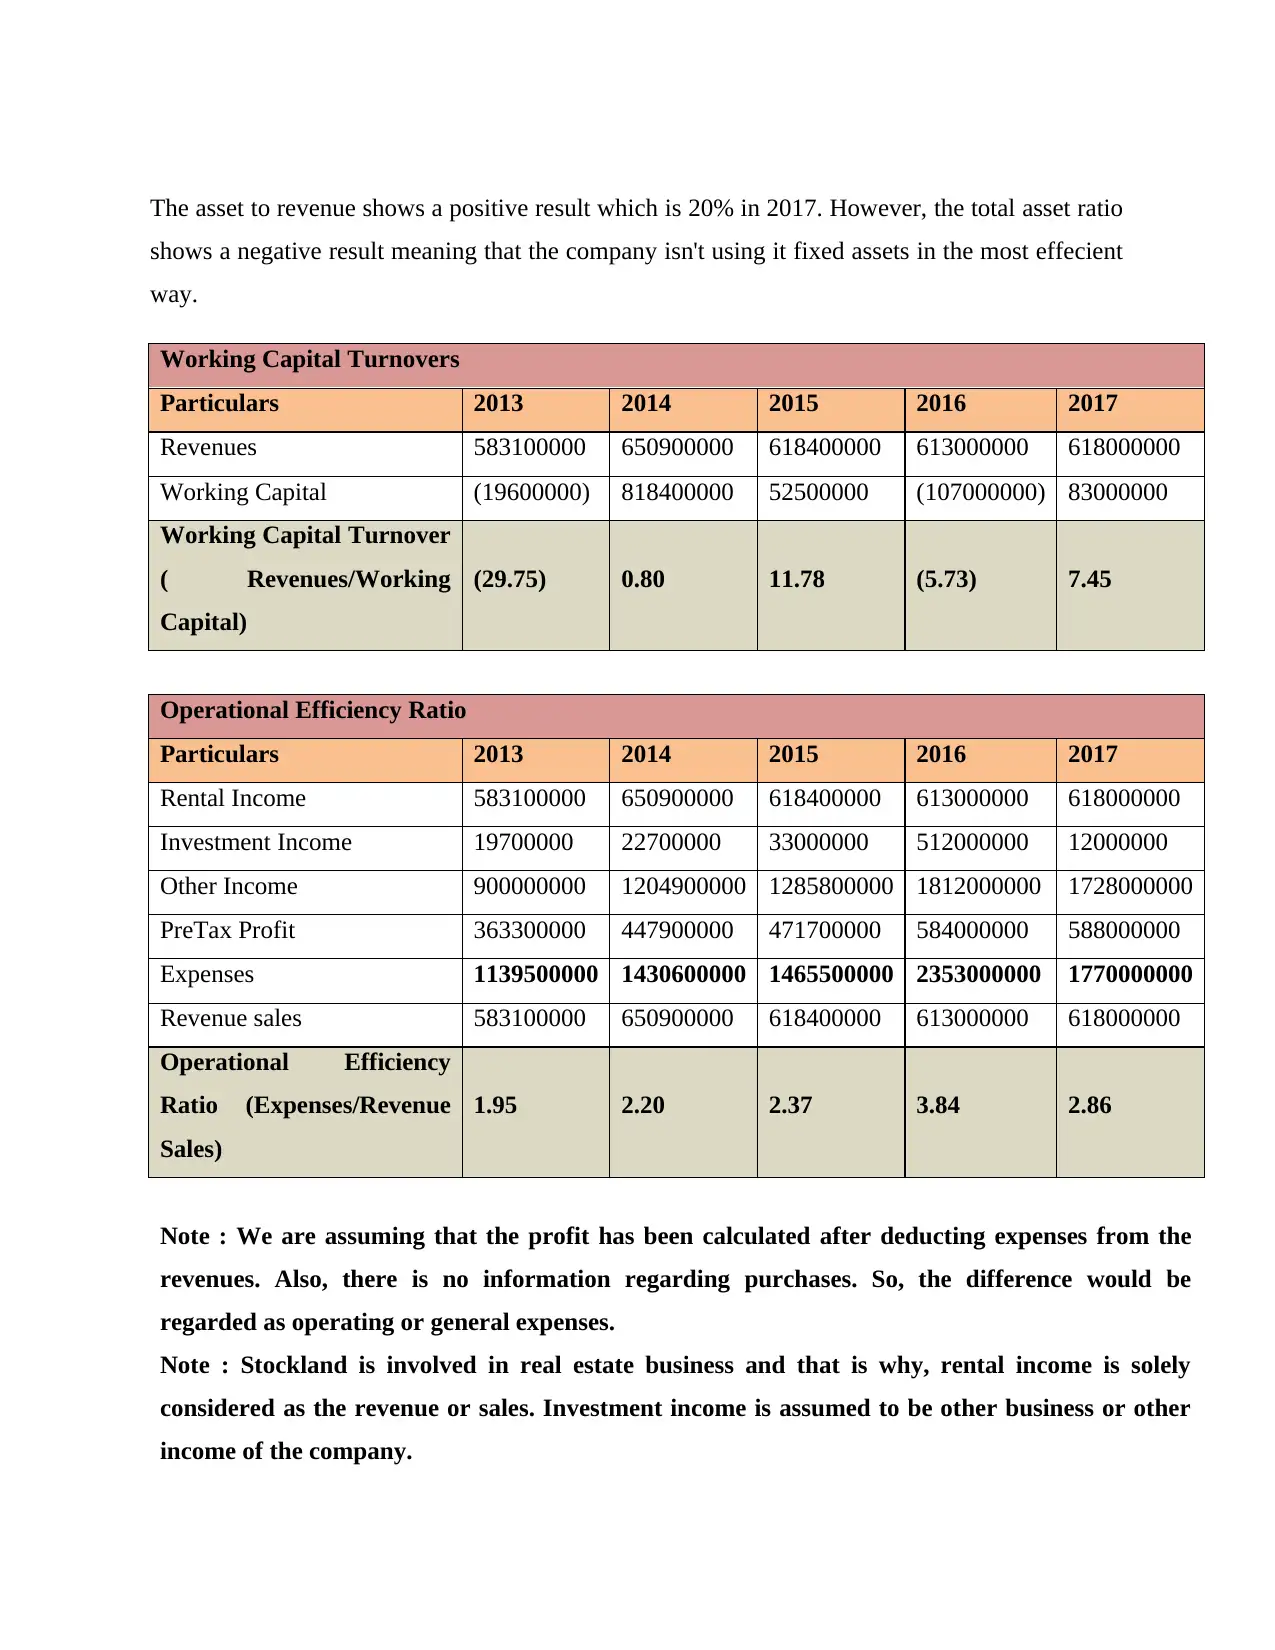
Working Capital Turnovers
Particulars 2013 2014 2015 2016 2017
Revenues 583100000 650900000 618400000 613000000 618000000
Working Capital (19600000) 818400000 52500000 (107000000) 83000000
Working Capital Turnover
( Revenues/Working
Capital)
(29.75) 0.80 11.78 (5.73) 7.45
Operational Efficiency Ratio
Particulars 2013 2014 2015 2016 2017
Rental Income 583100000 650900000 618400000 613000000 618000000
Investment Income 19700000 22700000 33000000 512000000 12000000
Other Income 900000000 1204900000 1285800000 1812000000 1728000000
PreTax Profit 363300000 447900000 471700000 584000000 588000000
Expenses 1139500000 1430600000 1465500000 2353000000 1770000000
Revenue sales 583100000 650900000 618400000 613000000 618000000
Operational Efficiency
Ratio (Expenses/Revenue
Sales)
1.95 2.20 2.37 3.84 2.86
Note : We are assuming that the profit has been calculated after deducting expenses from the
revenues. Also, there is no information regarding purchases. So, the difference would be
regarded as operating or general expenses.
Note : Stockland is involved in real estate business and that is why, rental income is solely
considered as the revenue or sales. Investment income is assumed to be other business or other
income of the company.
⊘ This is a preview!⊘
Do you want full access?
Subscribe today to unlock all pages.
Trusted by 1+ million students worldwide
ratio shows higher expenditures of the company.
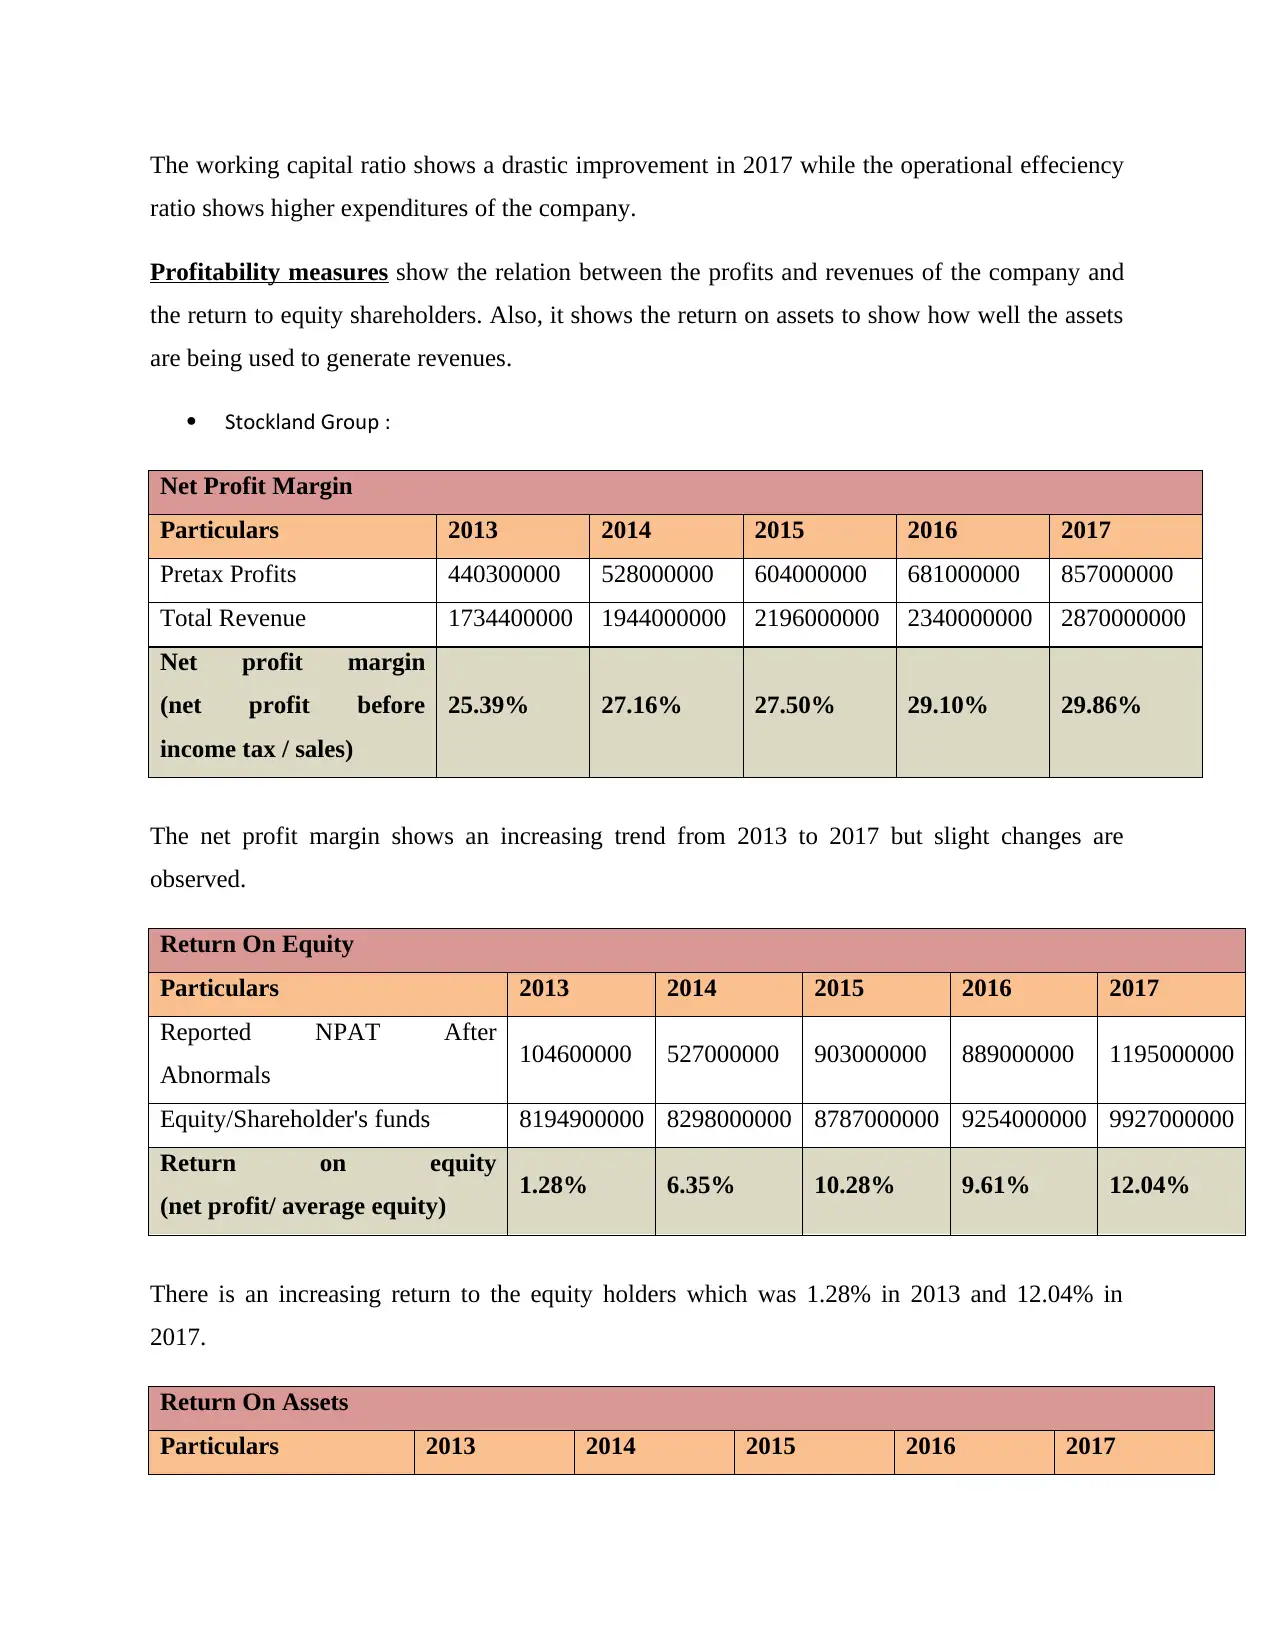
Profitability measures show the relation between the profits and revenues of the company and
the return to equity shareholders. Also, it shows the return on assets to show how well the assets
are being used to generate revenues.
Stockland Group :
Net Profit Margin
Particulars 2013 2014 2015 2016 2017
Pretax Profits 440300000 528000000 604000000 681000000 857000000
Total Revenue 1734400000 1944000000 2196000000 2340000000 2870000000
Net profit margin
(net profit before
income tax / sales)
25.39% 27.16% 27.50% 29.10% 29.86%
The net profit margin shows an increasing trend from 2013 to 2017 but slight changes are
observed.
Return On Equity
Particulars 2013 2014 2015 2016 2017
Reported NPAT After
Abnormals 104600000 527000000 903000000 889000000 1195000000
Equity/Shareholder's funds 8194900000 8298000000 8787000000 9254000000 9927000000
Return on equity
(net profit/ average equity) 1.28% 6.35% 10.28% 9.61% 12.04%
There is an increasing return to the equity holders which was 1.28% in 2013 and 12.04% in
2017.
Return On Assets
Particulars 2013 2014 2015 2016 2017
Paraphrase This Document
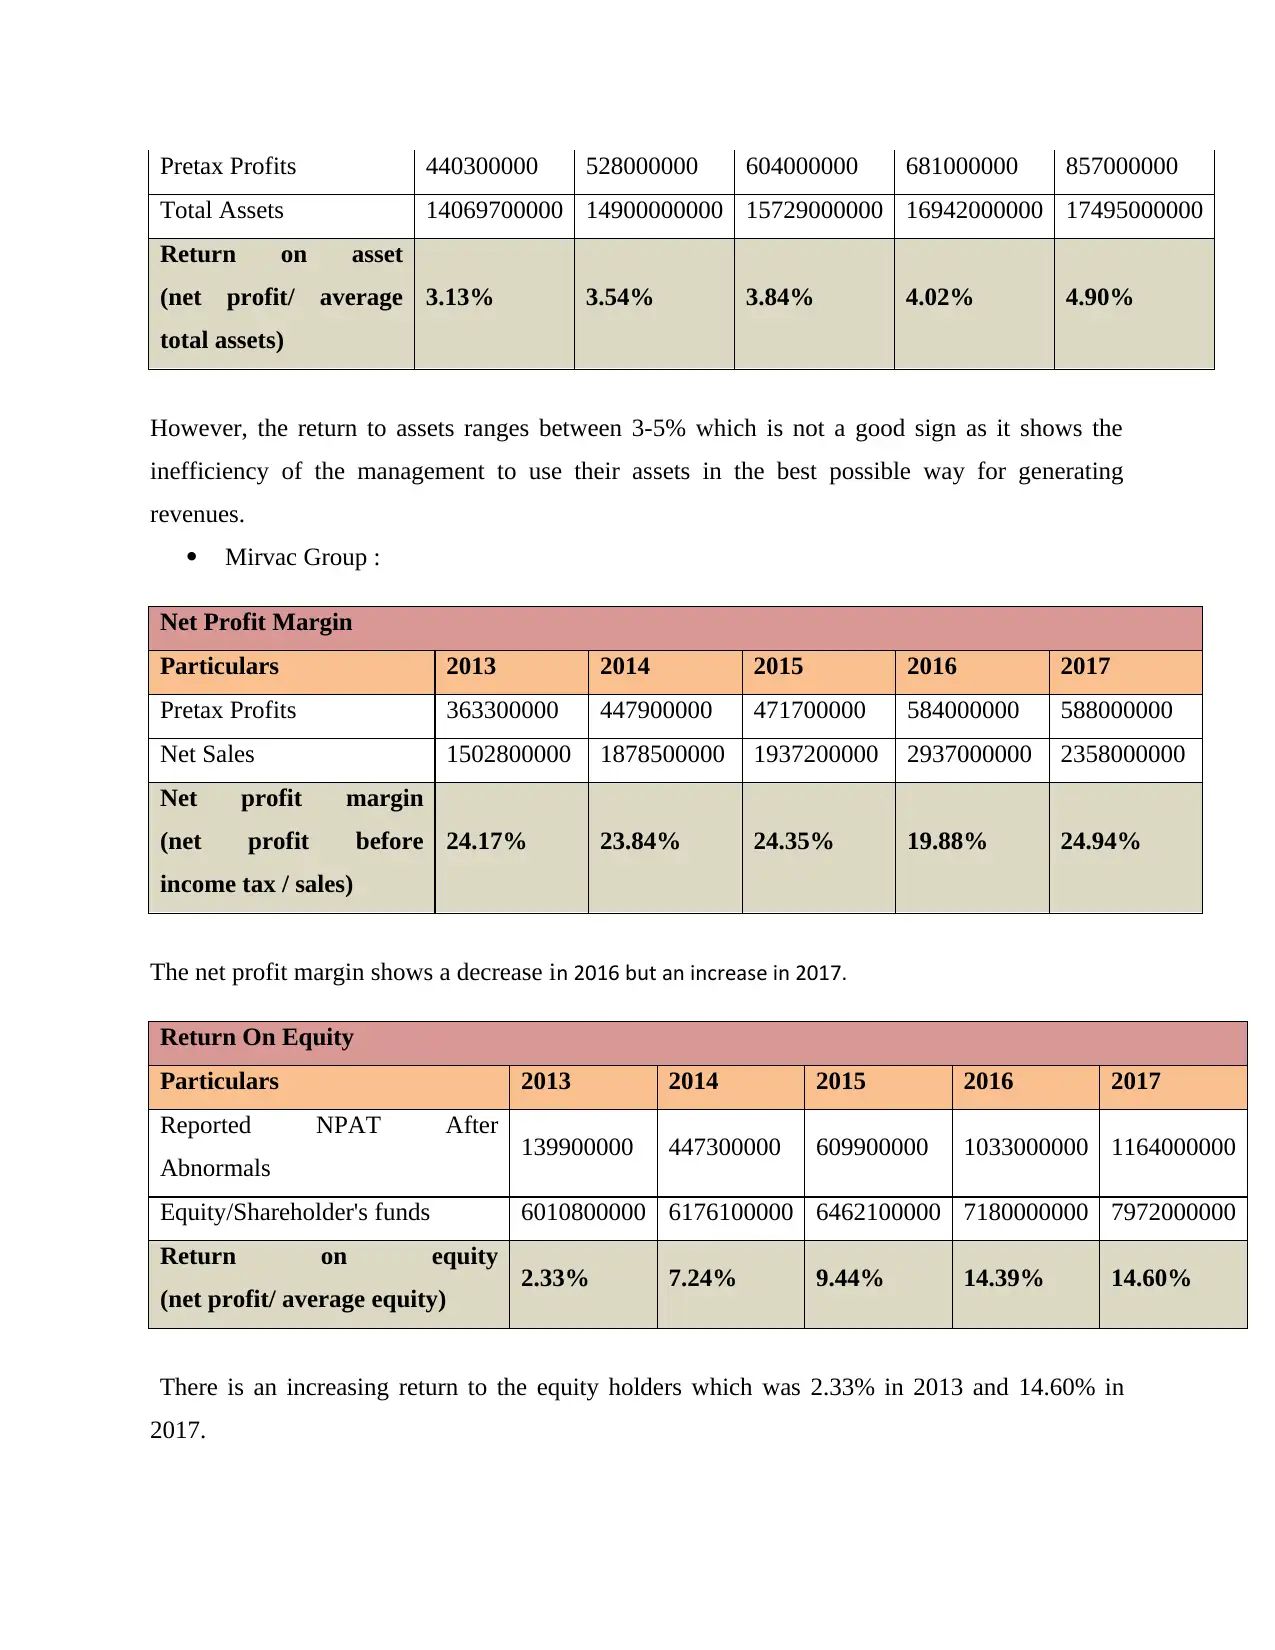
Total Assets 14069700000 14900000000 15729000000 16942000000 17495000000
Return on asset
(net profit/ average
total assets)
3.13% 3.54% 3.84% 4.02% 4.90%
However, the return to assets ranges between 3-5% which is not a good sign as it shows the
inefficiency of the management to use their assets in the best possible way for generating
revenues.
Mirvac Group :
Net Profit Margin
Particulars 2013 2014 2015 2016 2017
Pretax Profits 363300000 447900000 471700000 584000000 588000000
Net Sales 1502800000 1878500000 1937200000 2937000000 2358000000
Net profit margin
(net profit before
income tax / sales)
24.17% 23.84% 24.35% 19.88% 24.94%
The net profit margin shows a decrease in 2016 but an increase in 2017.
Return On Equity
Particulars 2013 2014 2015 2016 2017
Reported NPAT After
Abnormals 139900000 447300000 609900000 1033000000 1164000000
Equity/Shareholder's funds 6010800000 6176100000 6462100000 7180000000 7972000000
Return on equity
(net profit/ average equity) 2.33% 7.24% 9.44% 14.39% 14.60%
There is an increasing return to the equity holders which was 2.33% in 2013 and 14.60% in
2017.
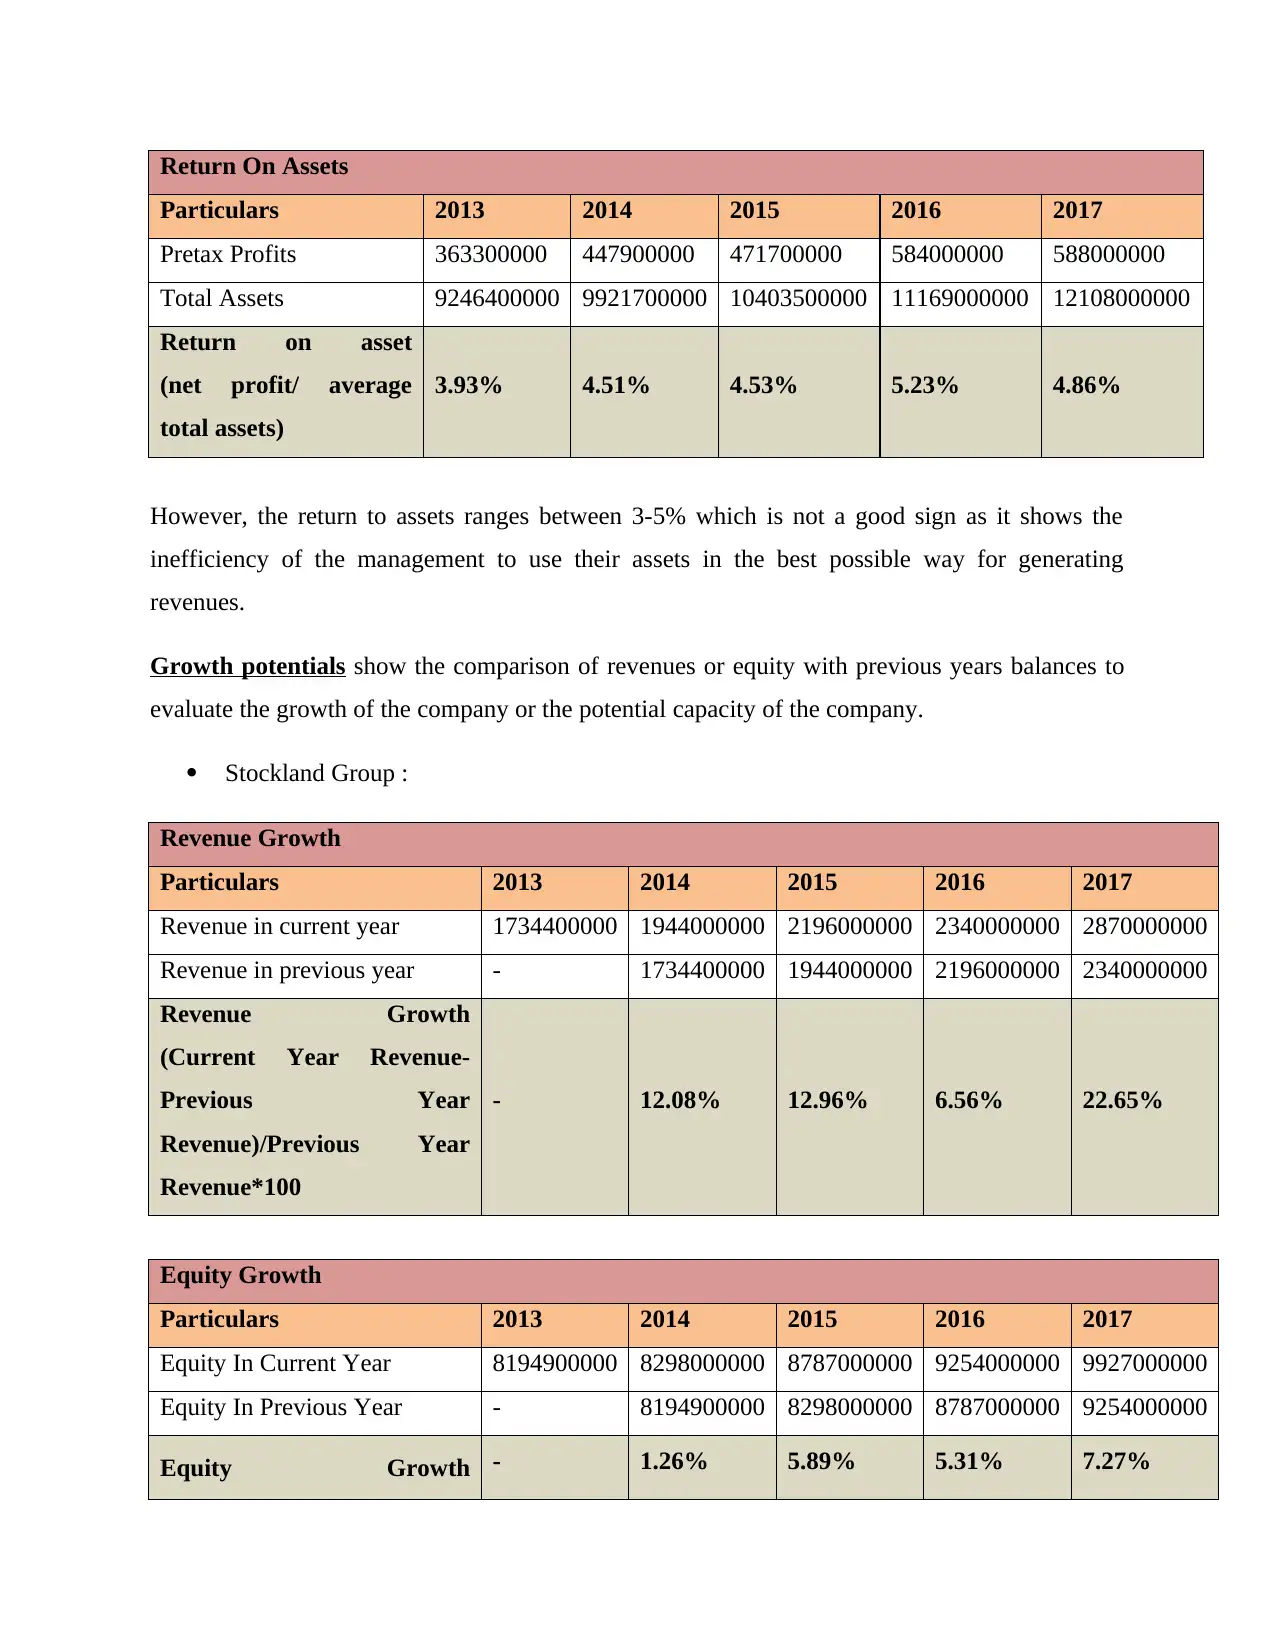
Particulars 2013 2014 2015 2016 2017
Pretax Profits 363300000 447900000 471700000 584000000 588000000
Total Assets 9246400000 9921700000 10403500000 11169000000 12108000000
Return on asset
(net profit/ average
total assets)
3.93% 4.51% 4.53% 5.23% 4.86%
However, the return to assets ranges between 3-5% which is not a good sign as it shows the
inefficiency of the management to use their assets in the best possible way for generating
revenues.
Growth potentials show the comparison of revenues or equity with previous years balances to
evaluate the growth of the company or the potential capacity of the company.
Stockland Group :
Revenue Growth
Particulars 2013 2014 2015 2016 2017
Revenue in current year 1734400000 1944000000 2196000000 2340000000 2870000000
Revenue in previous year - 1734400000 1944000000 2196000000 2340000000
Revenue Growth
(Current Year Revenue-
Previous Year
Revenue)/Previous Year
Revenue*100
- 12.08% 12.96% 6.56% 22.65%
Equity Growth
Particulars 2013 2014 2015 2016 2017
Equity In Current Year 8194900000 8298000000 8787000000 9254000000 9927000000
Equity In Previous Year - 8194900000 8298000000 8787000000 9254000000
Equity Growth - 1.26% 5.89% 5.31% 7.27%
⊘ This is a preview!⊘
Do you want full access?
Subscribe today to unlock all pages.
Trusted by 1+ million students worldwide
equity in previous
year/previous year
equity)*100
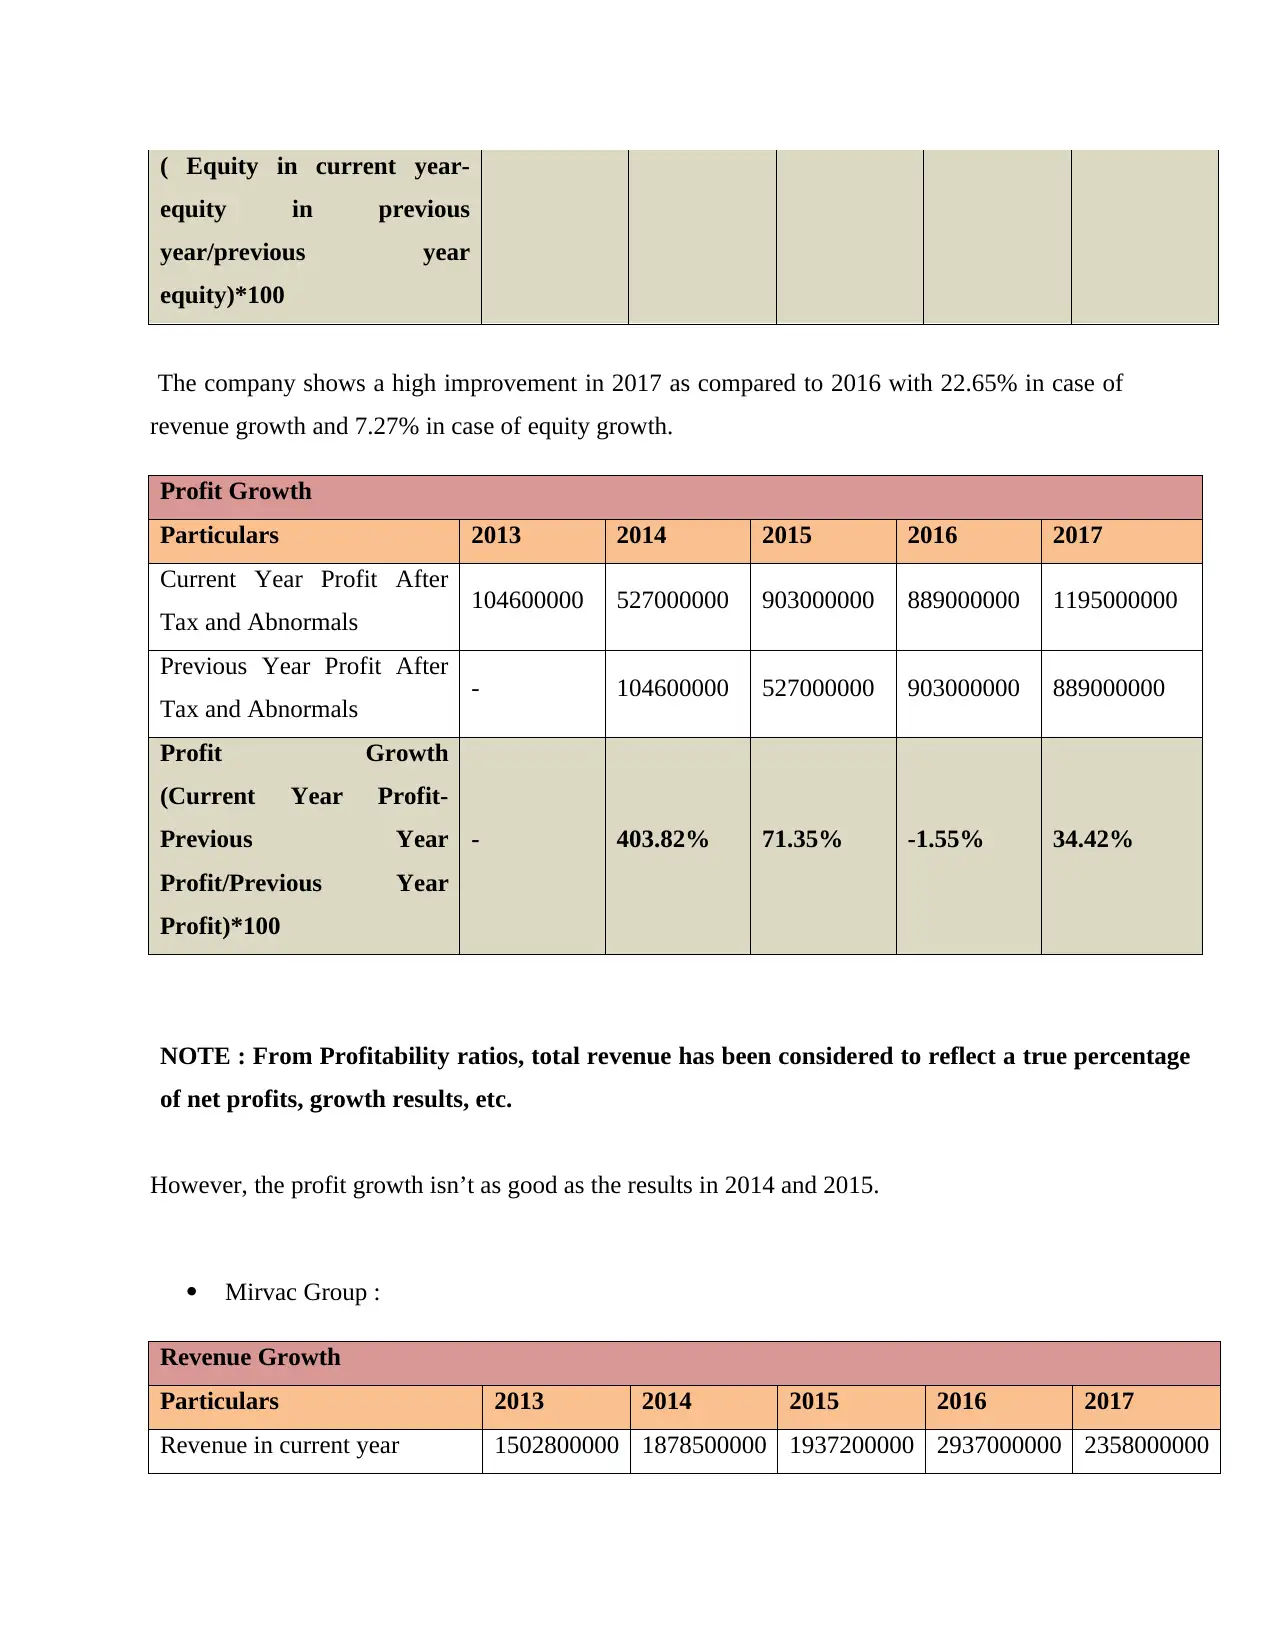
The company shows a high improvement in 2017 as compared to 2016 with 22.65% in case of
revenue growth and 7.27% in case of equity growth.
Profit Growth
Particulars 2013 2014 2015 2016 2017
Current Year Profit After
Tax and Abnormals 104600000 527000000 903000000 889000000 1195000000
Previous Year Profit After
Tax and Abnormals - 104600000 527000000 903000000 889000000
Profit Growth
(Current Year Profit-
Previous Year
Profit/Previous Year
Profit)*100
- 403.82% 71.35% -1.55% 34.42%
NOTE : From Profitability ratios, total revenue has been considered to reflect a true percentage
of net profits, growth results, etc.
However, the profit growth isn’t as good as the results in 2014 and 2015.
Mirvac Group :
Revenue Growth
Particulars 2013 2014 2015 2016 2017
Revenue in current year 1502800000 1878500000 1937200000 2937000000 2358000000
Paraphrase This Document
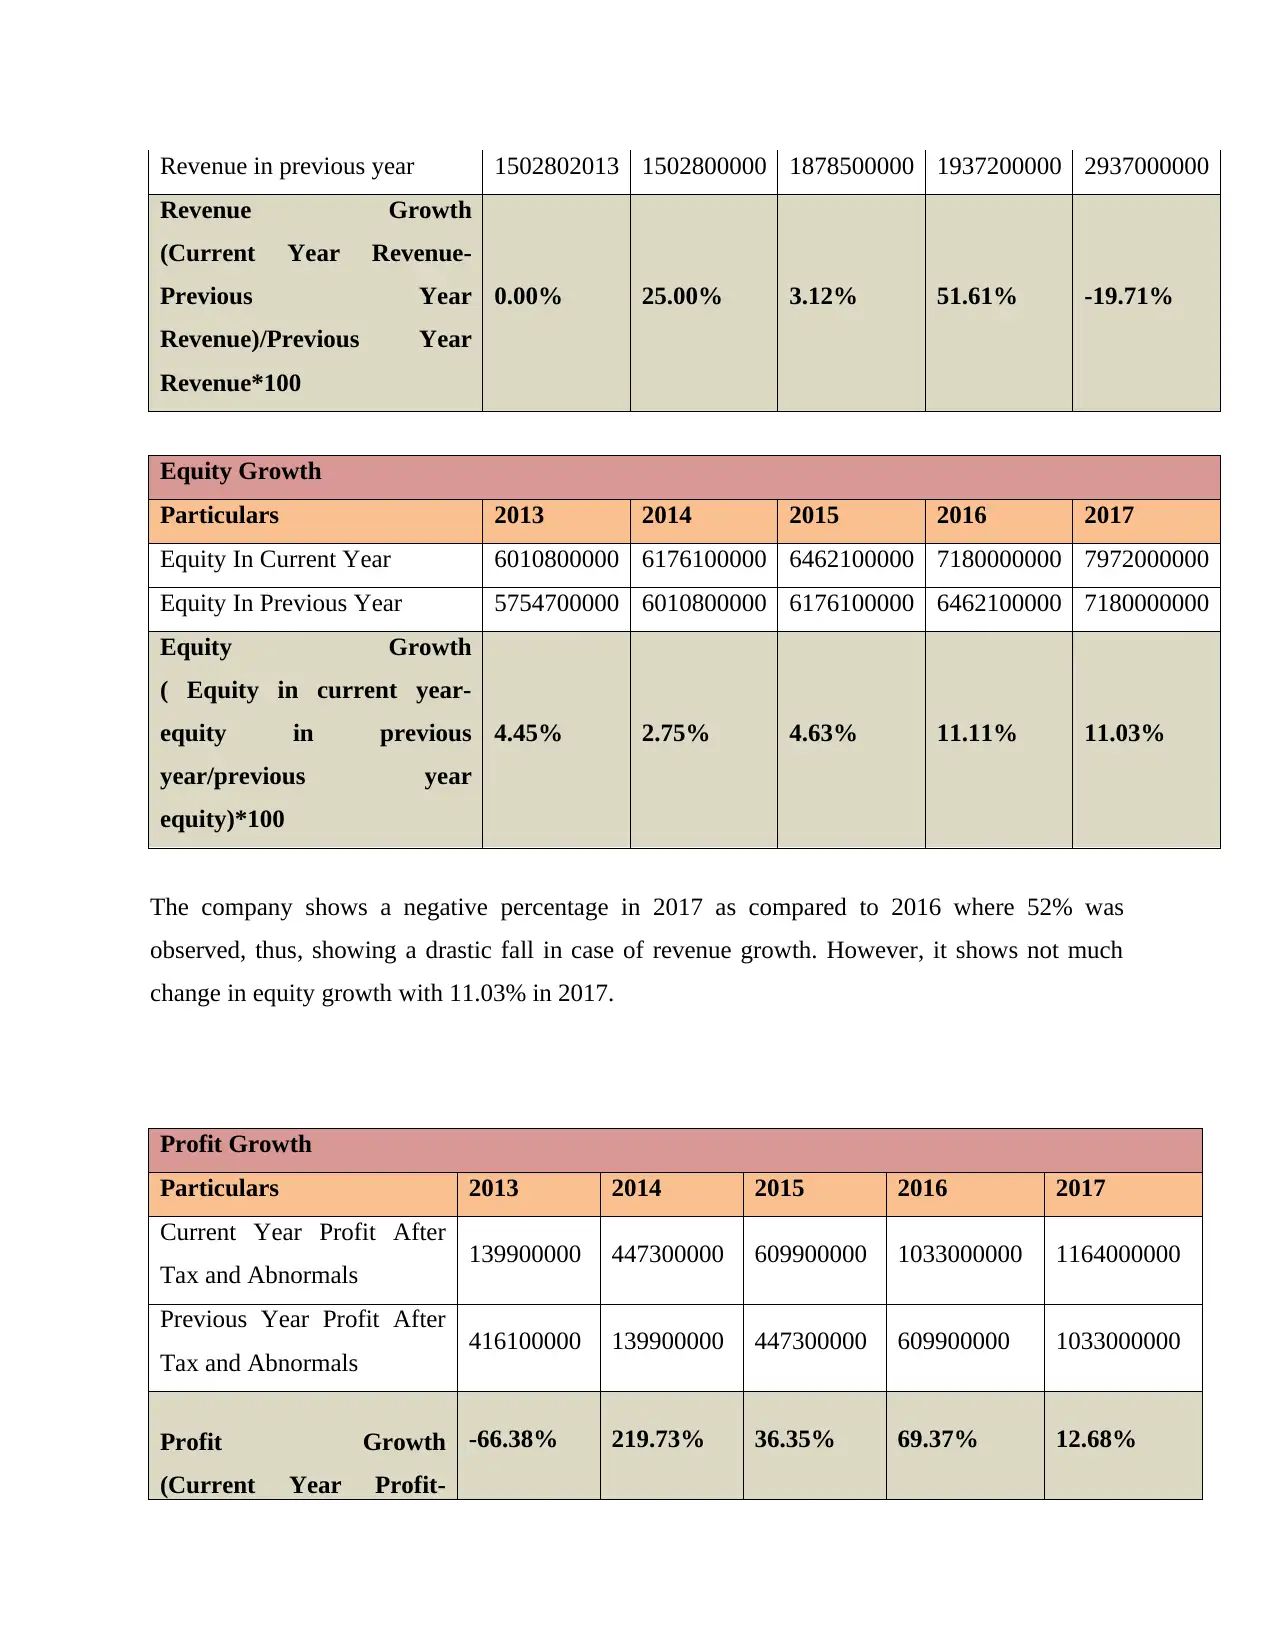
Revenue Growth
(Current Year Revenue-
Previous Year
Revenue)/Previous Year
Revenue*100
0.00% 25.00% 3.12% 51.61% -19.71%
Equity Growth
Particulars 2013 2014 2015 2016 2017
Equity In Current Year 6010800000 6176100000 6462100000 7180000000 7972000000
Equity In Previous Year 5754700000 6010800000 6176100000 6462100000 7180000000
Equity Growth
( Equity in current year-
equity in previous
year/previous year
equity)*100
4.45% 2.75% 4.63% 11.11% 11.03%
The company shows a negative percentage in 2017 as compared to 2016 where 52% was
observed, thus, showing a drastic fall in case of revenue growth. However, it shows not much
change in equity growth with 11.03% in 2017.
Profit Growth
Particulars 2013 2014 2015 2016 2017
Current Year Profit After
Tax and Abnormals 139900000 447300000 609900000 1033000000 1164000000
Previous Year Profit After
Tax and Abnormals 416100000 139900000 447300000 609900000 1033000000
Profit Growth
(Current Year Profit-
-66.38% 219.73% 36.35% 69.37% 12.68%
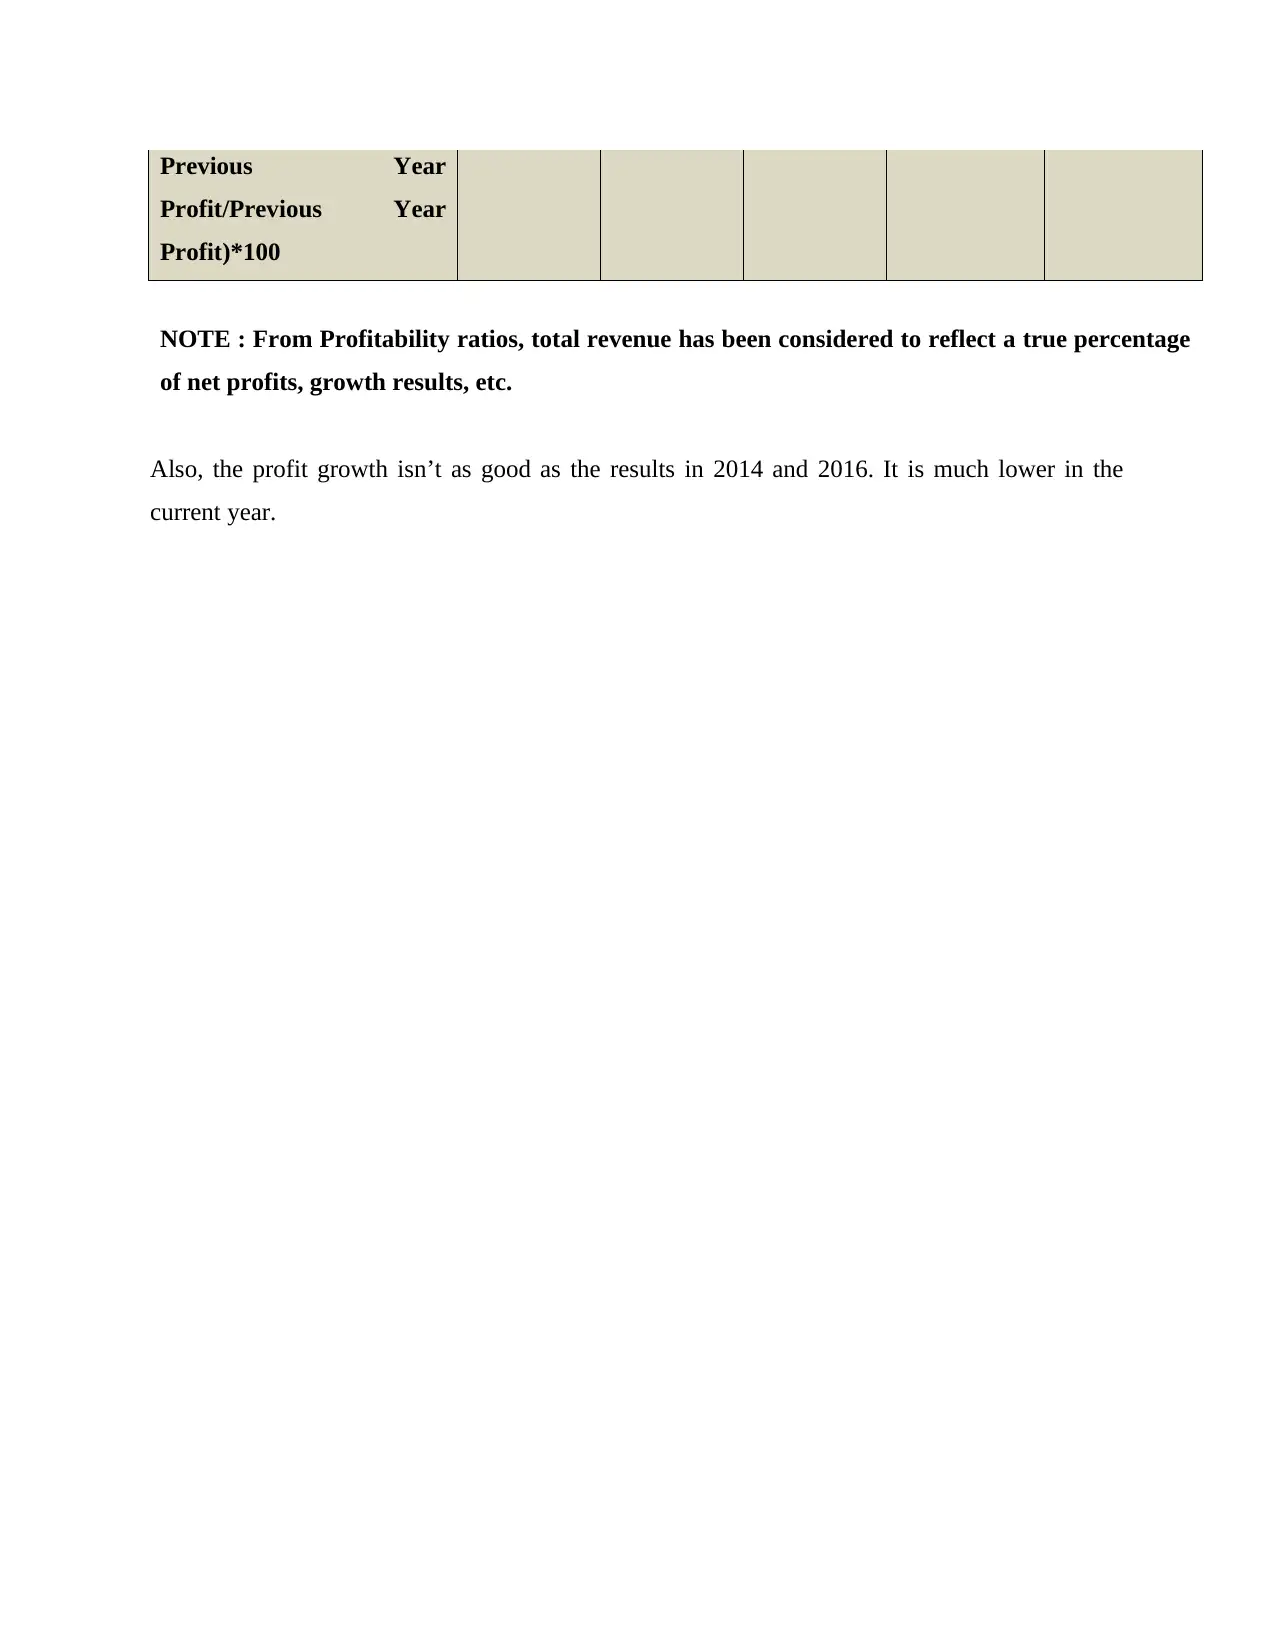
Profit/Previous Year
Profit)*100
NOTE : From Profitability ratios, total revenue has been considered to reflect a true percentage
of net profits, growth results, etc.
Also, the profit growth isn’t as good as the results in 2014 and 2016. It is much lower in the
current year.
⊘ This is a preview!⊘
Do you want full access?
Subscribe today to unlock all pages.
Trusted by 1+ million students worldwide
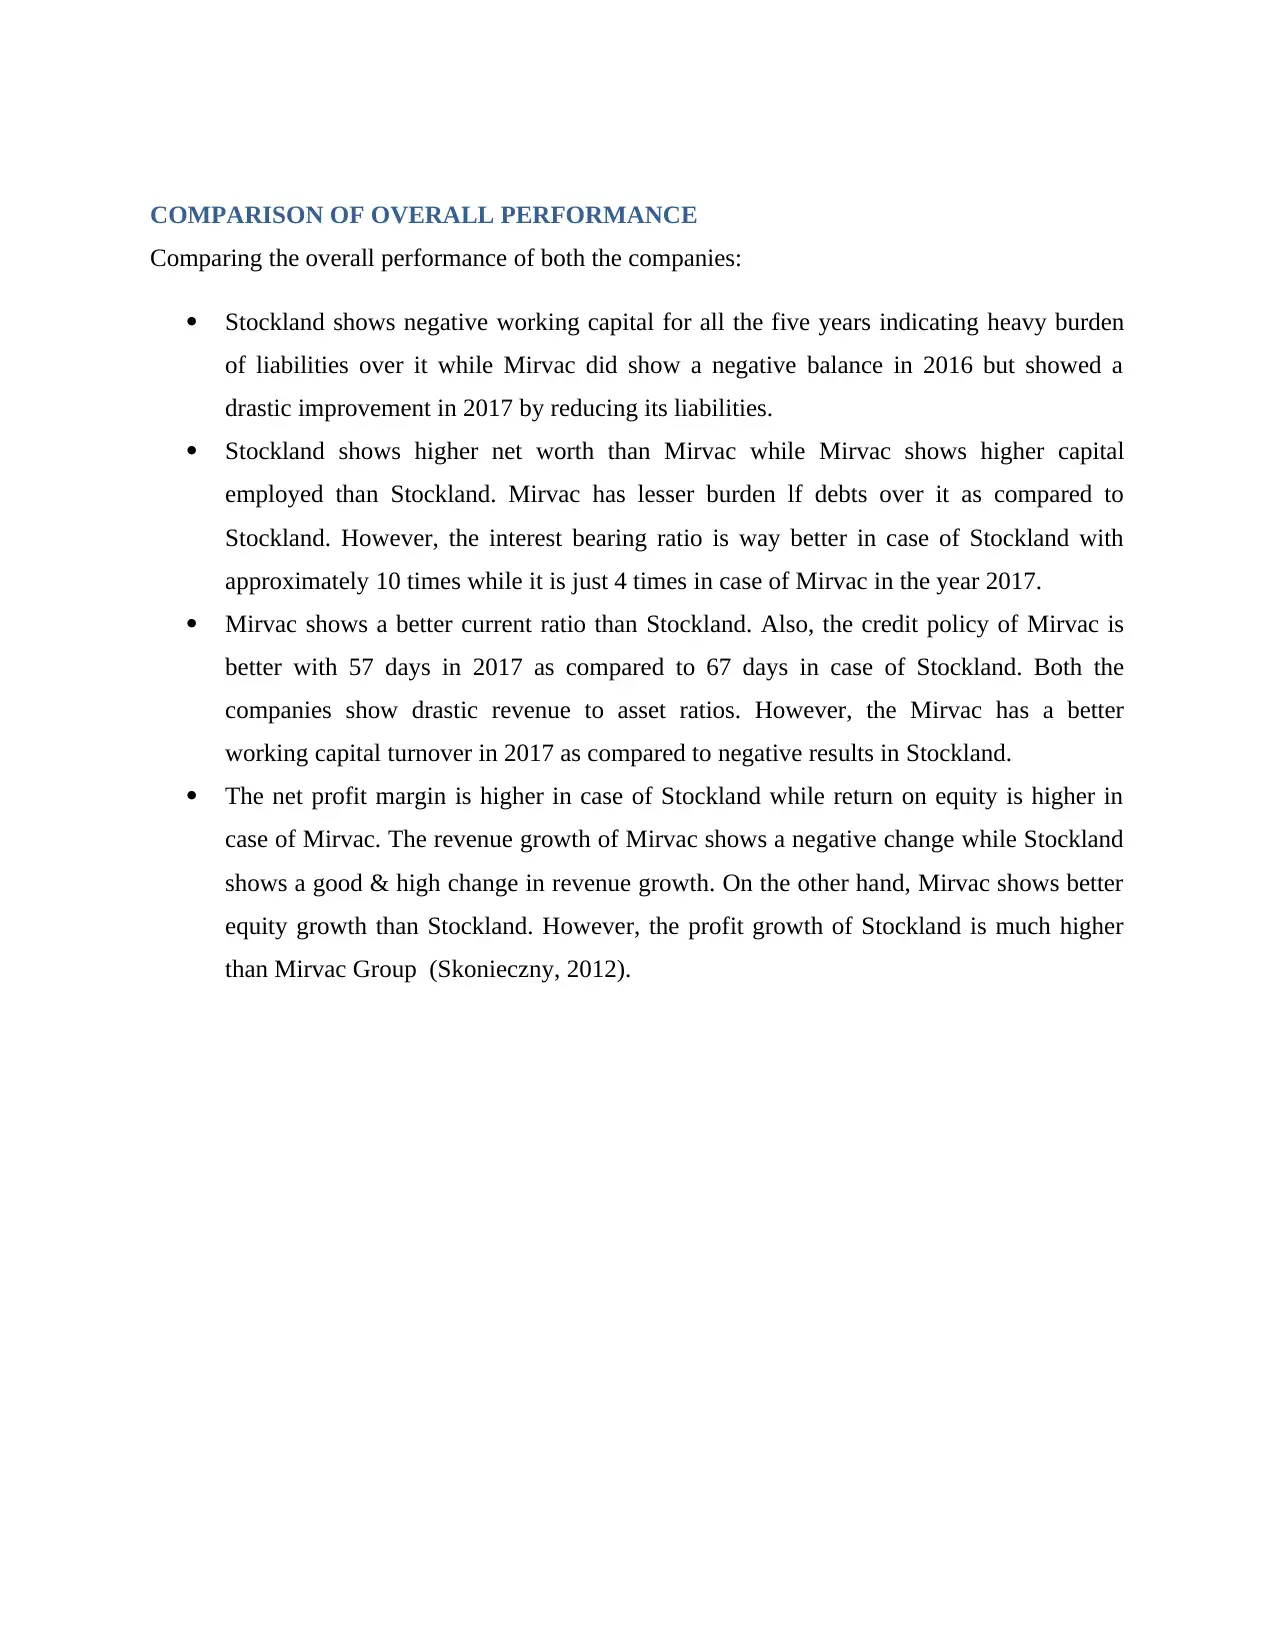
Comparing the overall performance of both the companies:
Stockland shows negative working capital for all the five years indicating heavy burden
of liabilities over it while Mirvac did show a negative balance in 2016 but showed a
drastic improvement in 2017 by reducing its liabilities.
Stockland shows higher net worth than Mirvac while Mirvac shows higher capital
employed than Stockland. Mirvac has lesser burden lf debts over it as compared to
Stockland. However, the interest bearing ratio is way better in case of Stockland with
approximately 10 times while it is just 4 times in case of Mirvac in the year 2017.
Mirvac shows a better current ratio than Stockland. Also, the credit policy of Mirvac is
better with 57 days in 2017 as compared to 67 days in case of Stockland. Both the
companies show drastic revenue to asset ratios. However, the Mirvac has a better
working capital turnover in 2017 as compared to negative results in Stockland.
The net profit margin is higher in case of Stockland while return on equity is higher in
case of Mirvac. The revenue growth of Mirvac shows a negative change while Stockland
shows a good & high change in revenue growth. On the other hand, Mirvac shows better
equity growth than Stockland. However, the profit growth of Stockland is much higher
than Mirvac Group (Skonieczny, 2012).
Paraphrase This Document
Analyzing the companies individually and comparing their results, the observations say that both
the companies have flaws and therefore, relevant decision is hard to be formed. However, we
consider Mirvac Group to be a better capitalizing and ideal partner. The following organization
will form the most appropriate potential partnership with HPL.
The reasons behind recommending this company can be enumerated as below:
The company shows drastic improvements in 2017 as compared to 2016. For example,
the positive change in working capital but Stockland Group shows negative working
capital balances over the last five years.
Mirvac Group has a better capital structure than Stockland in terms of equity debt
structure, that is, it has a lesser proportion of debts in its capital structure. Also, the
company has a better current ratio reflecting a better liquidity status. Mirvac has a better
credit policy (Taillard, 2013).
It’s true that a better revenue growth is observed in Stockland which is a vital need for
every company but having a better equity growth is a positive signal for long term
sustainability as it shows the external stakeholders increasing trust and confidence in the
company.
However, the most commendable part of Mirvac Group is its drastic improvements in the year
2017 which were worse in 2016. This somewhere shows the company's ability to take strong
decisions and focusing more on other factors than higher revenues. The company's changes such
as reduction of current liabilities, increase in current assets, increase in equity growth, better
debtor turnover, etc reflects its strong determination towards taking its company onto higher
levels. This also proves their promising nature towards the coming up projects and thus, we
recommend Mirvac Group for this deal.
The above comparative analysis is however restricted to the financial information. The certain
information such as a company's future plans, or some ongoing projects due to which it is
incurring heavy expenditure and such other non financial information are equally important to
understand the business operations and accordingly, compare it with other companies. However,
ratio analysis tool aren't based on such information. We can conclude by choosing Mirvac over
Stockland for HPL Limited on the basis of above analysis.
⊘ This is a preview!⊘
Do you want full access?
Subscribe today to unlock all pages.
Trusted by 1+ million students worldwide
Alvarez, F. (2013). Financial statement analysis. Hoboken, N.J.: Wiley.
Atkinson, A. A. (2012). Management accounting. Upper Saddle River, N.J.: Paerson.
Berry, L. E. (2009). Management accounting demystified. New York: McGraw-Hill.
Boyd, W. K. (2013). Cost Accounting For Dummies. Hoboken: Wiley.
Easton, P. (2010). Financial statement analysis & valuation. Cambridge, UK: Cambridge
Business Publishers.
Elaine, H. (2015). International financial statement analysis. Hoboken: John Wiley & Sons.
Fridson, M., & Alvarez, F. (2012). Financial Statement Analysis: A Practitioner's Guide. New
York: John Wiley & Sons.
Girard, S. L. (2014). Business finance basics. Pompton Plains, NJ: Career Press.
Ittelson, T. (2009). Financial Statements: A Step-by-Step Guide to Understanding and Creating
Financial Reports. Franklin Lakes, N.J.: Career Press.
McLaney, E., & Adril, D. P. (2016). Accounting and Finance: An Introduction. United
Kingdom: Pearson.
Menifield, C. E. (2014). The Basics of Public Budgeting and Financial Management: A
Handbook for Academics and Practitioners. Lanham, Md.: University Press of America.
Parrino, R. (2013). Fundamentals of Corporate Finance, 2nd Edition. Milton: John Wiley &
Sons.
Penman, S. (2012). Financial statement analysis and security valuation. Boston, Mass.:
McGraw-Hill.
Ramírez, C. Z. (2018). The Impact of IFRS 16 on Key Financial Ratios: A New Methodological
Approach. Accounting in Europe .
Paraphrase This Document
Local Governments. Washington, D.C.: ICMA Press.
Seitz, N., & Ellison, M. (2009). Capital Budgeting and Long-Term Financing Decisions. New
York: Thomson Learning.
Siciliano, G. (2015). Finance for Nonfinancial Managers. New York: McGraw-Hill.
Simpson, M. (2012). Financial accounting. Basingstoke: Macmillan Press.
Skonieczny, M. (2012). The basics of understanding financial statements. Schaumburg, Ill.:
Investment Publishing.
Taillard, M. (2013). Corporate finance for dummies. Hoboken, N.J.: Wiley.
Related Documents


Your All-in-One AI-Powered Toolkit for Academic Success.
+13062052269
info@desklib.com
Available 24*7 on WhatsApp / Email
![[object Object]](/_next/static/media/star-bottom.7253800d.svg)
© 2024 | Zucol Services PVT LTD | All rights reserved.