Real-Time Analytics: Statistical Analysis of Rice Production Data
VerifiedAdded on  2021/05/31
|29
|5453
|17
Report
AI Summary
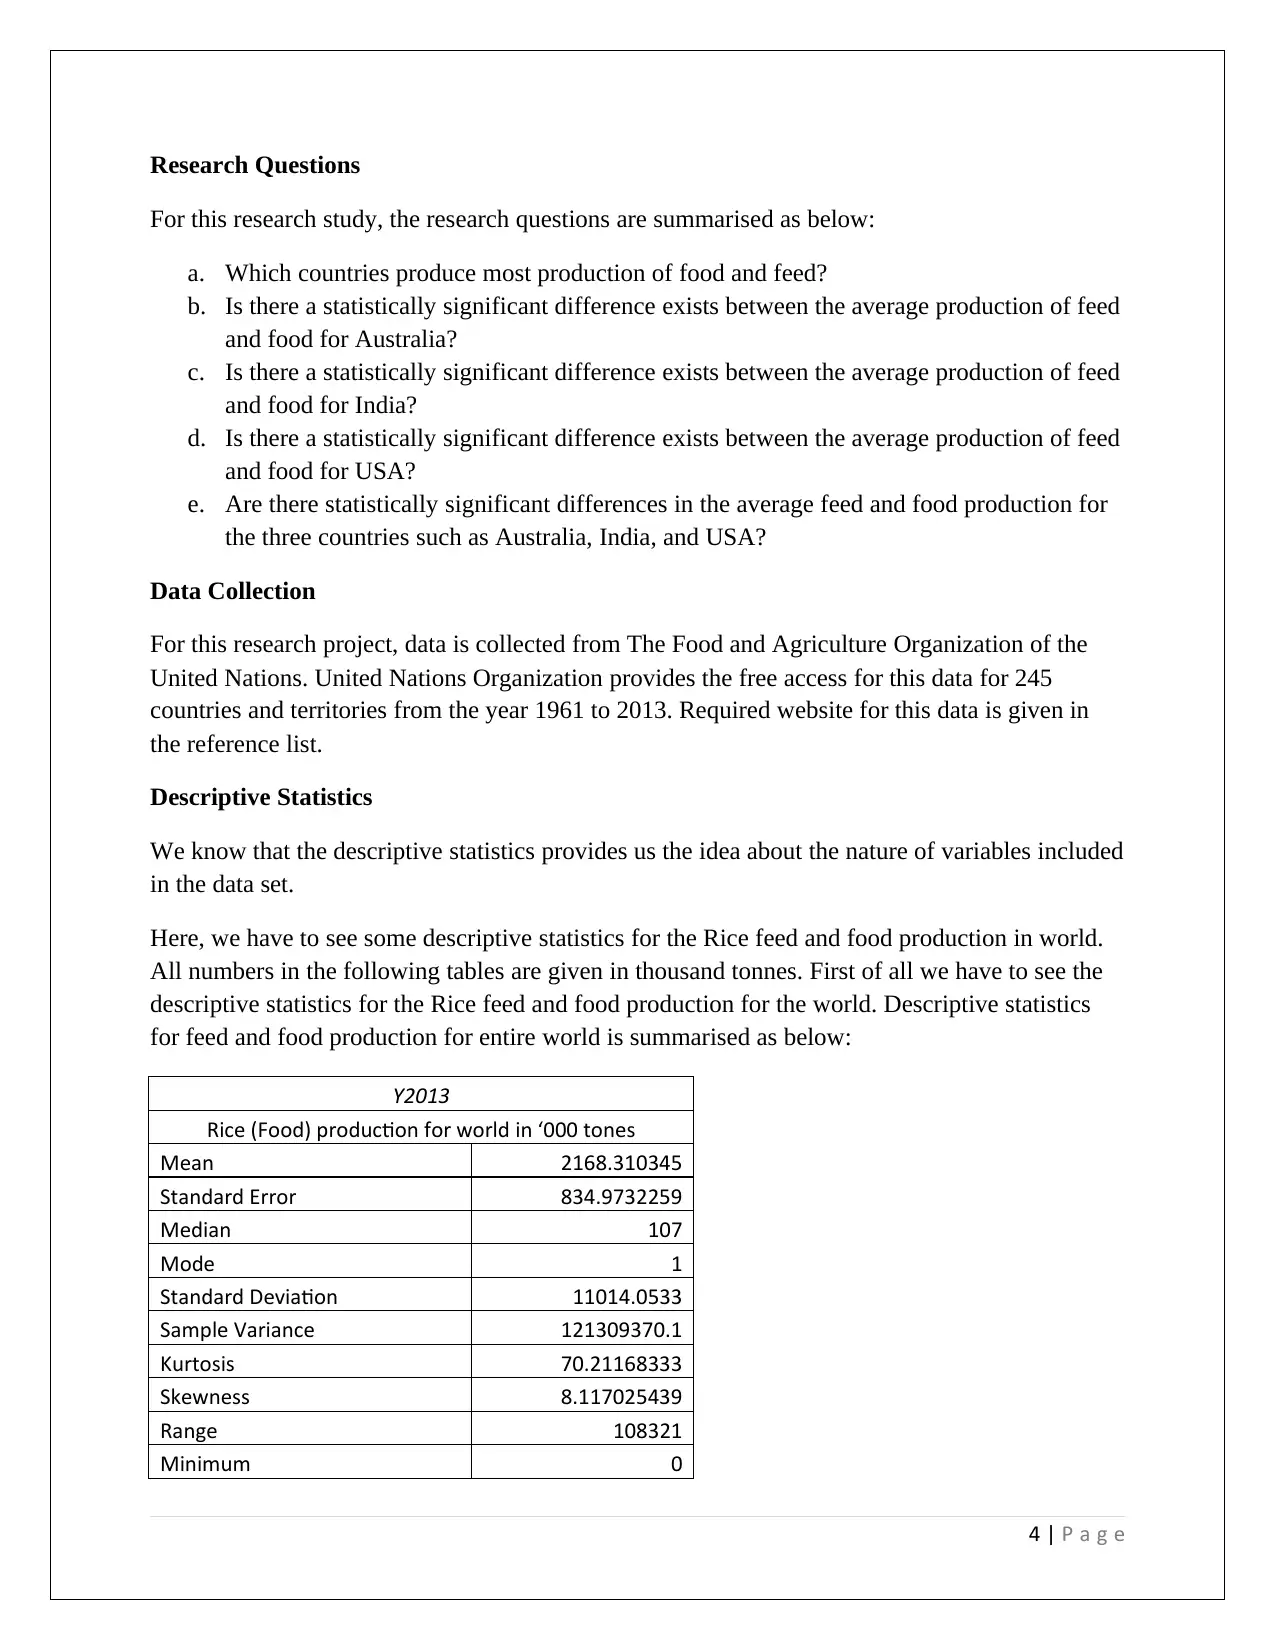
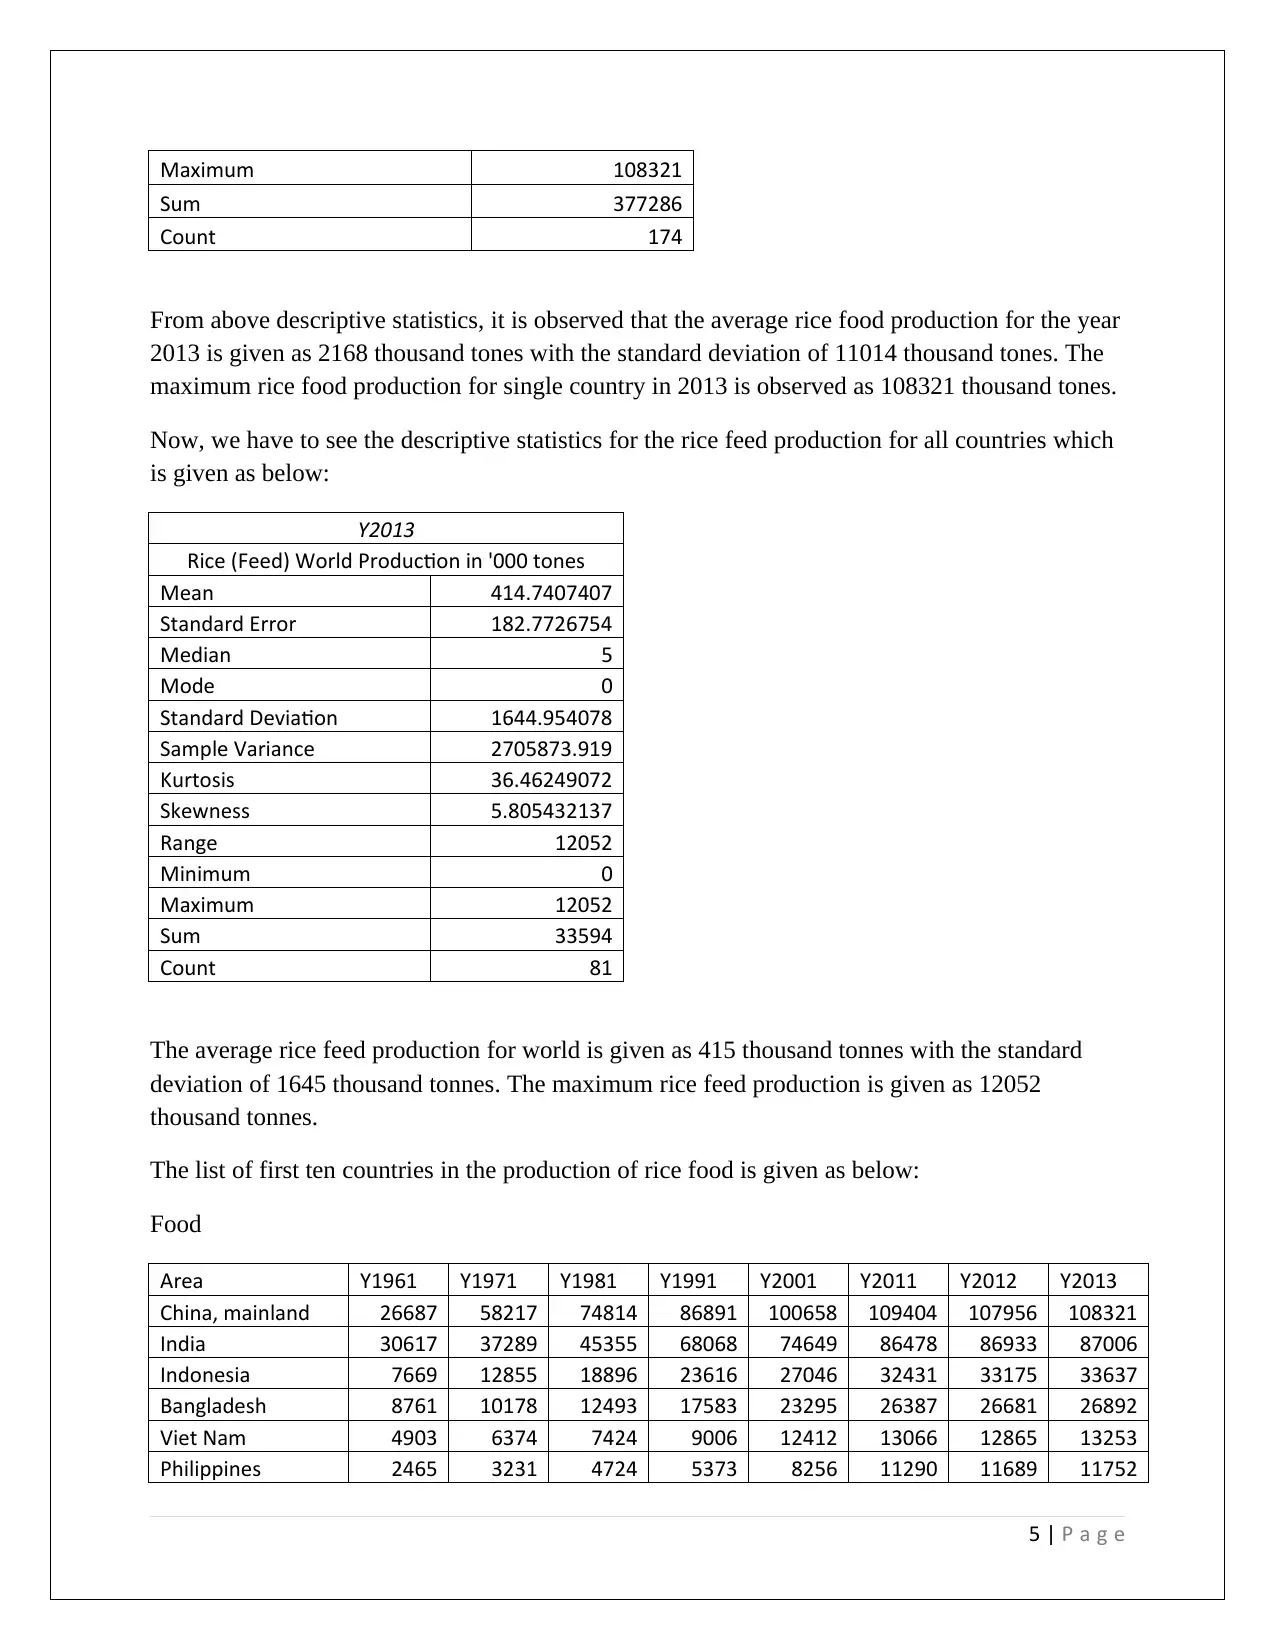
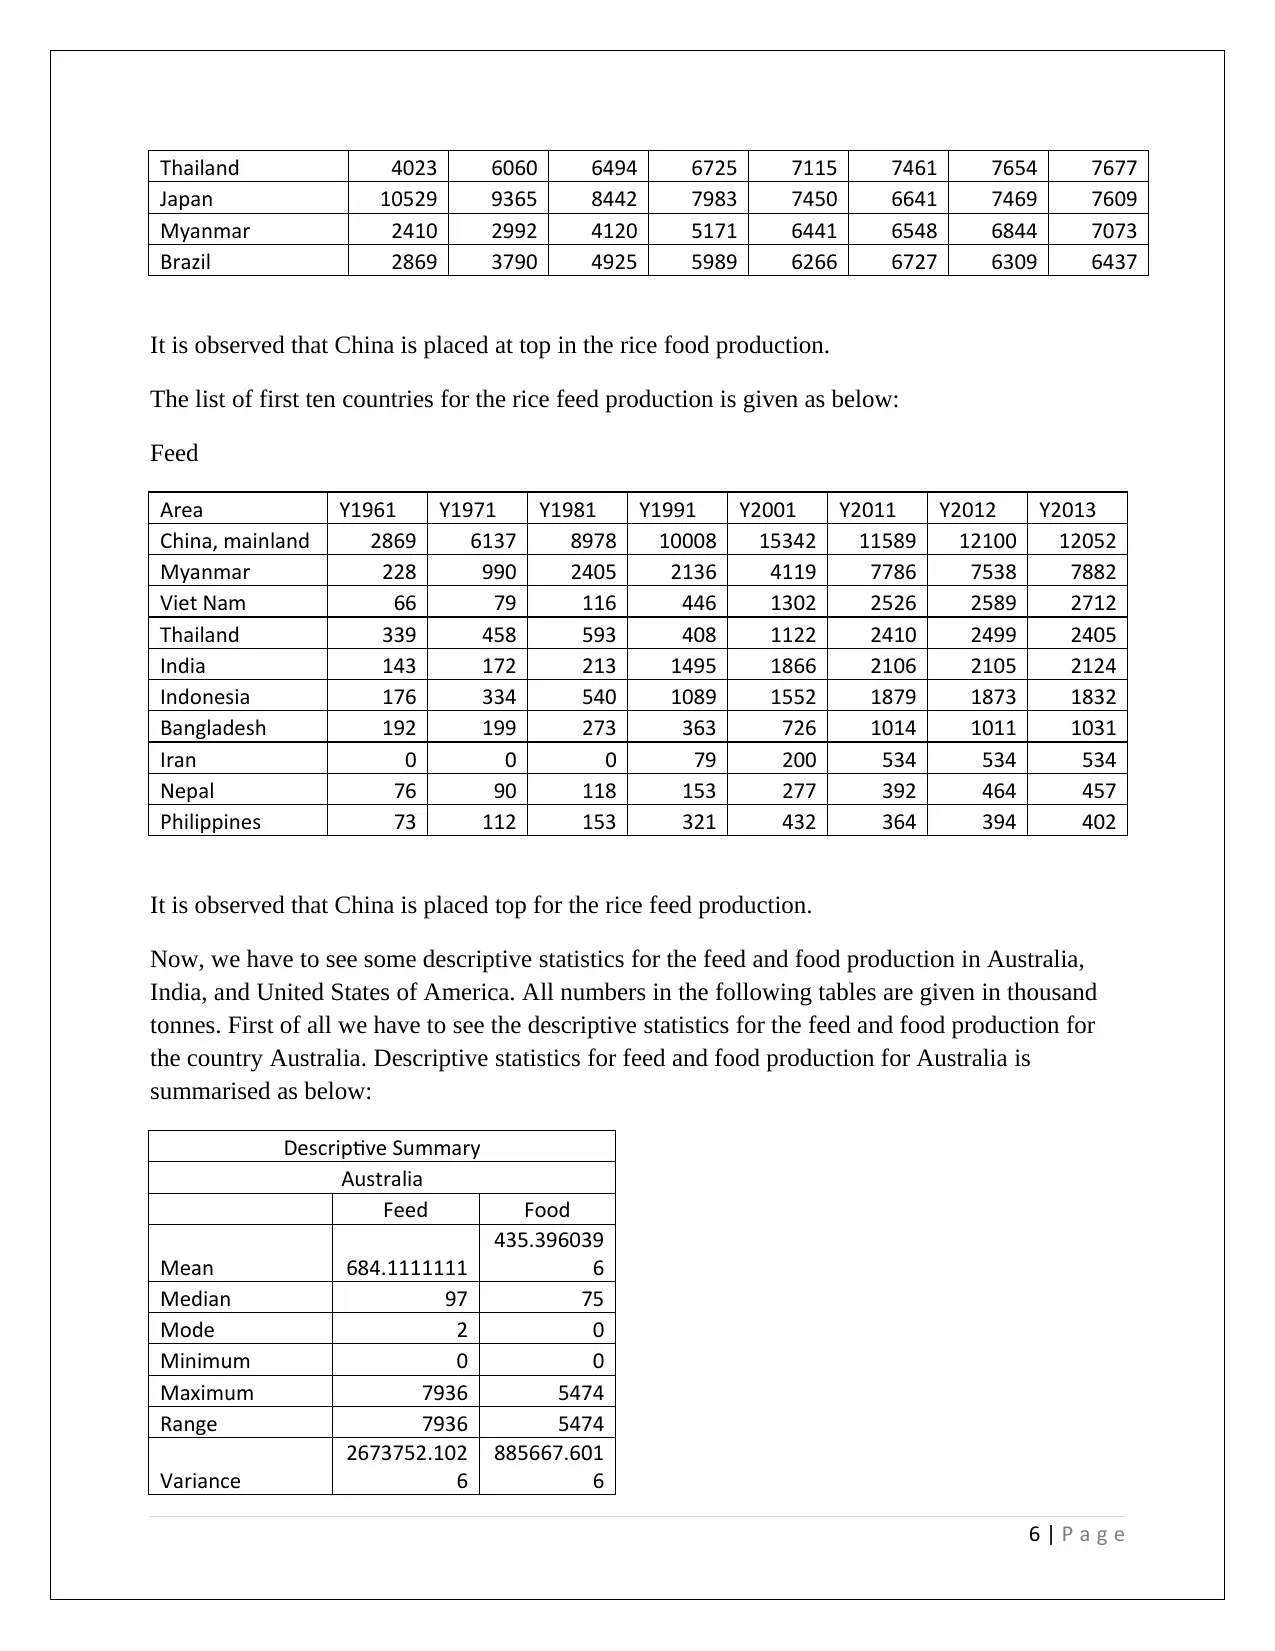
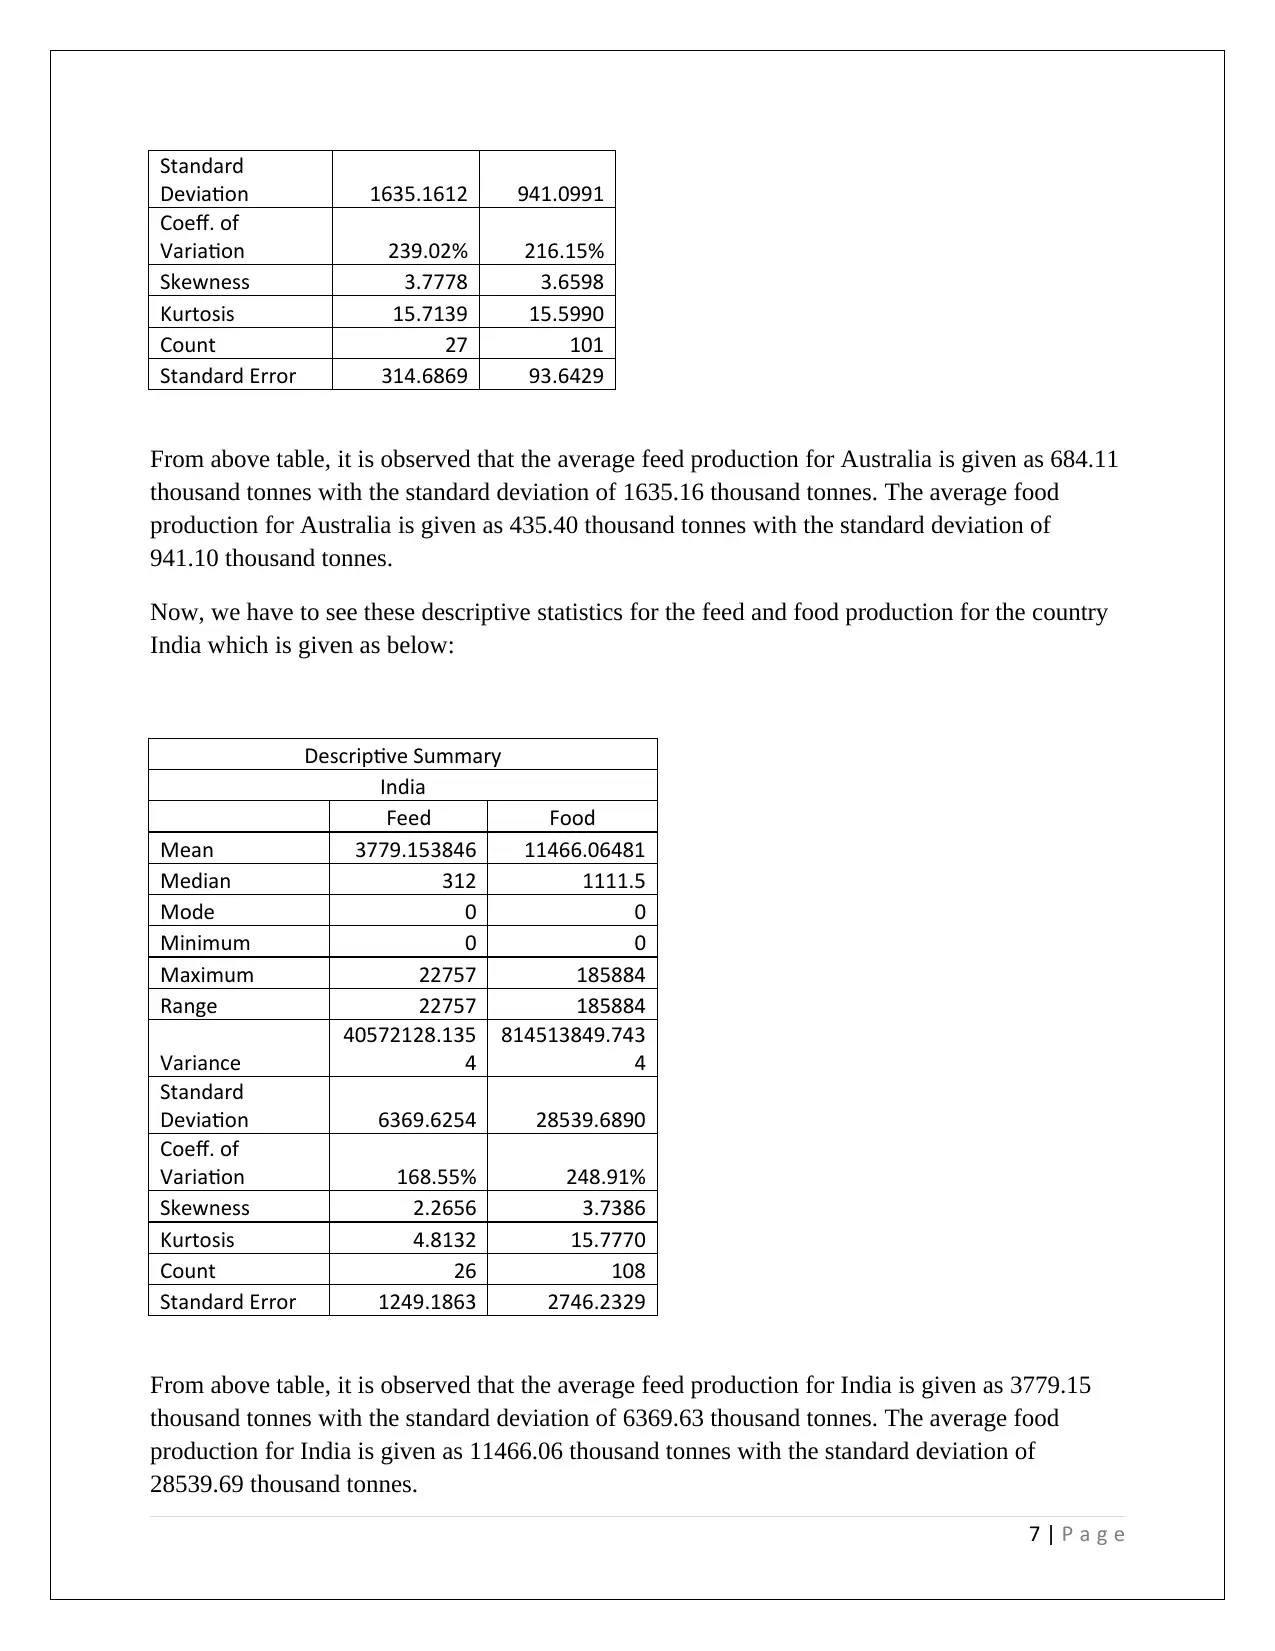
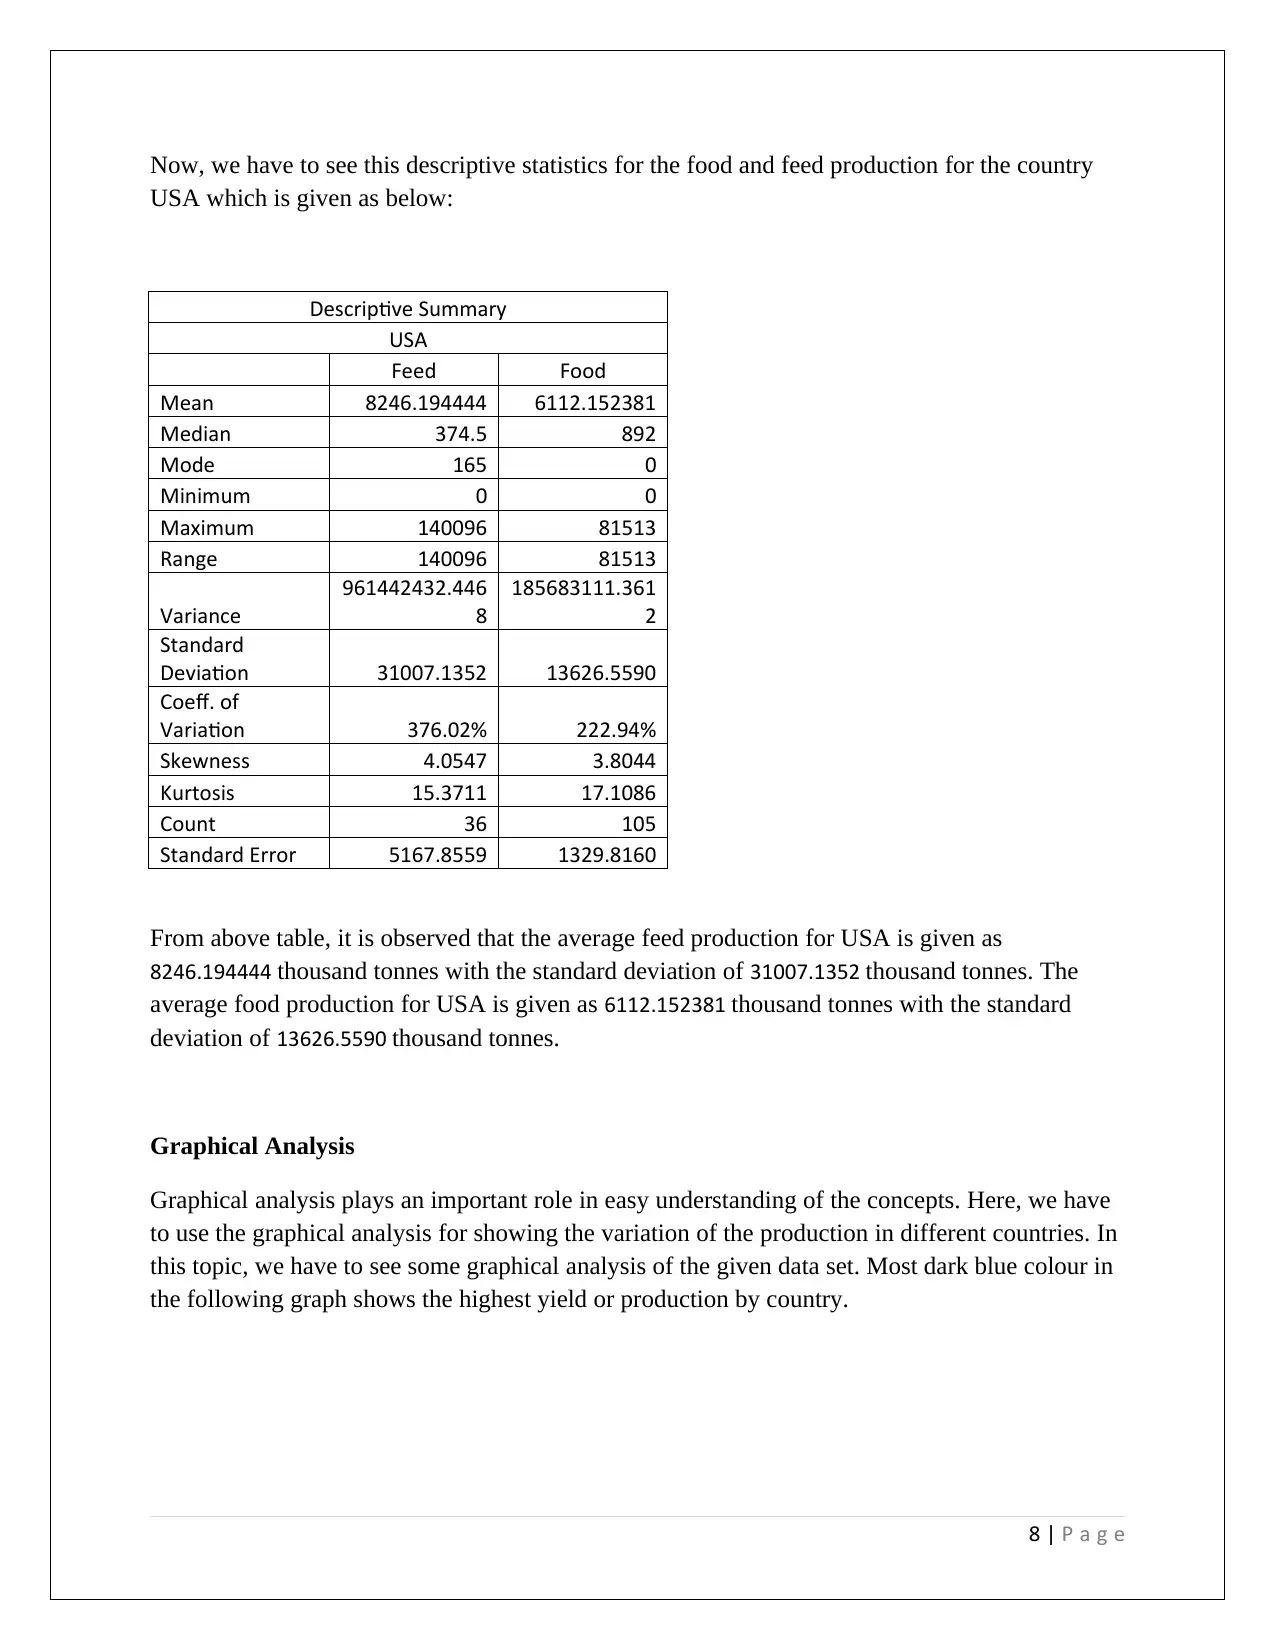
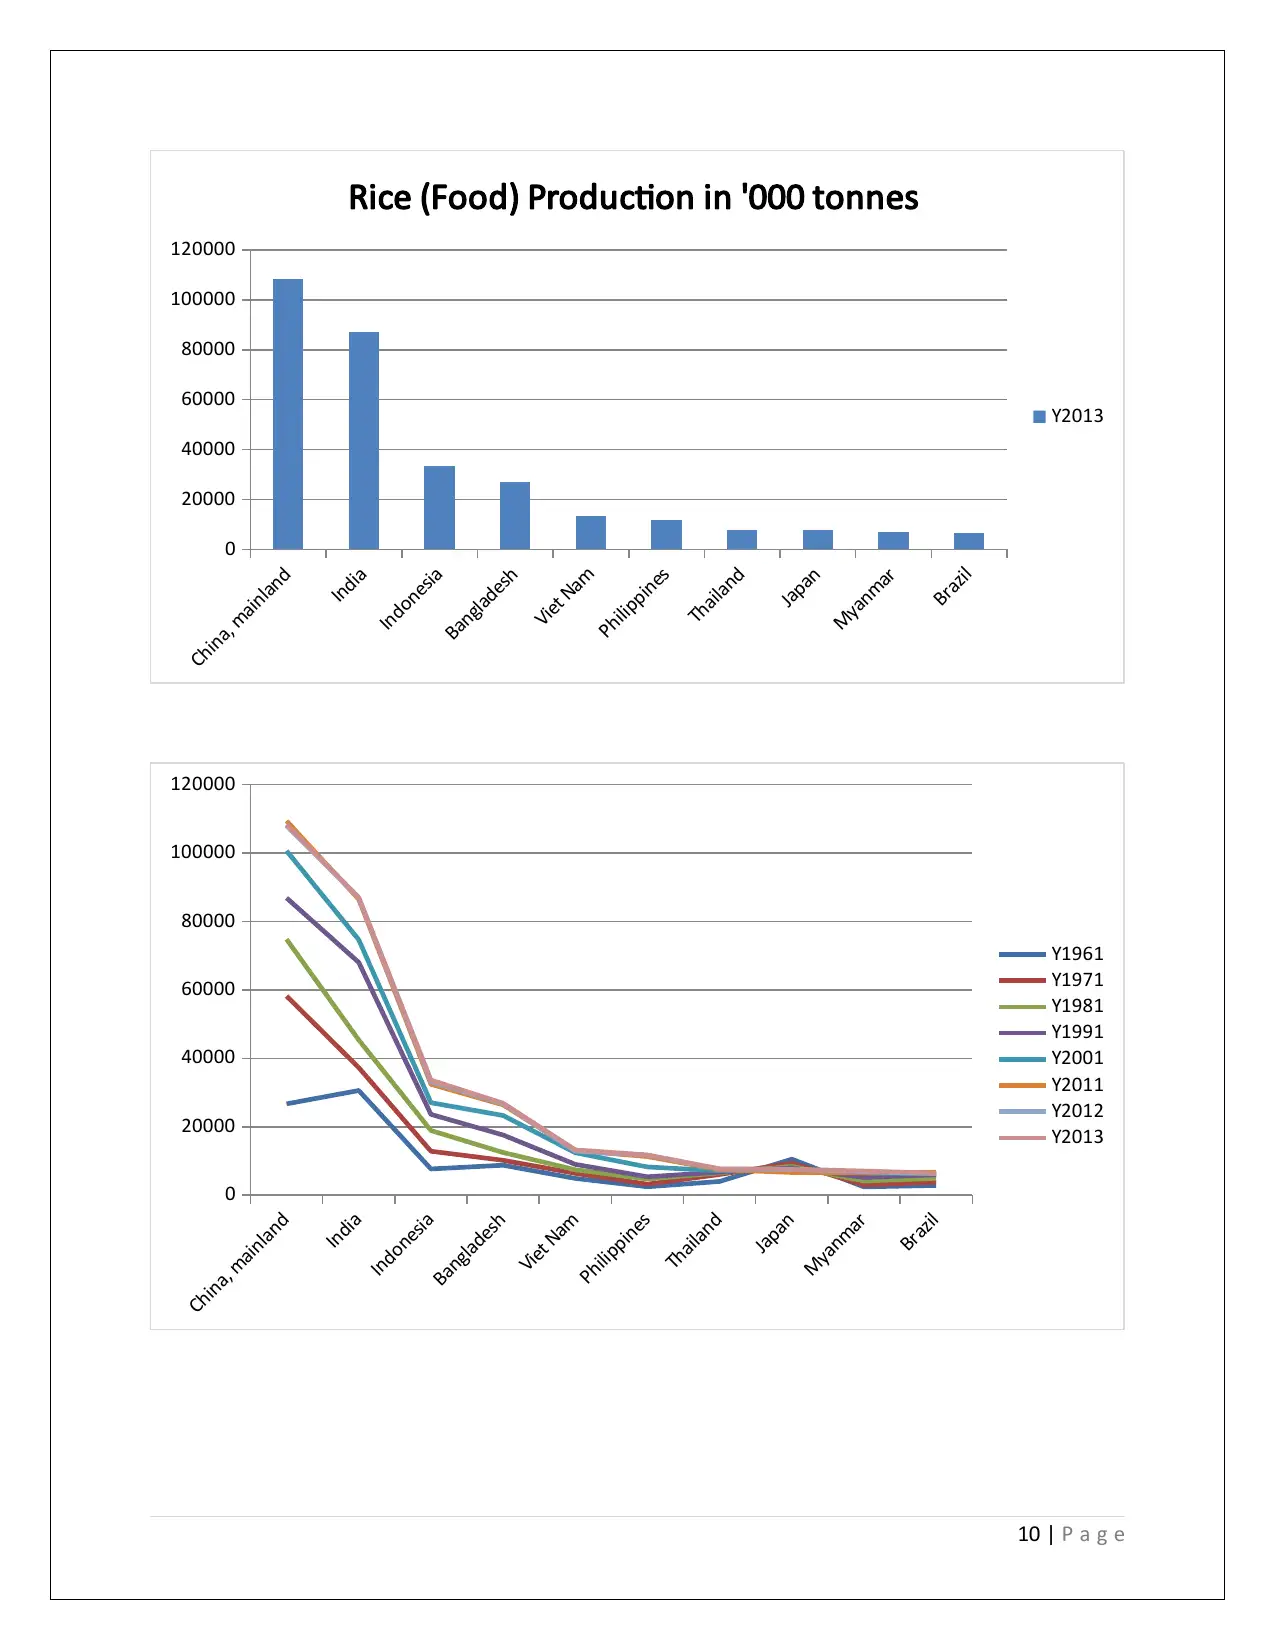
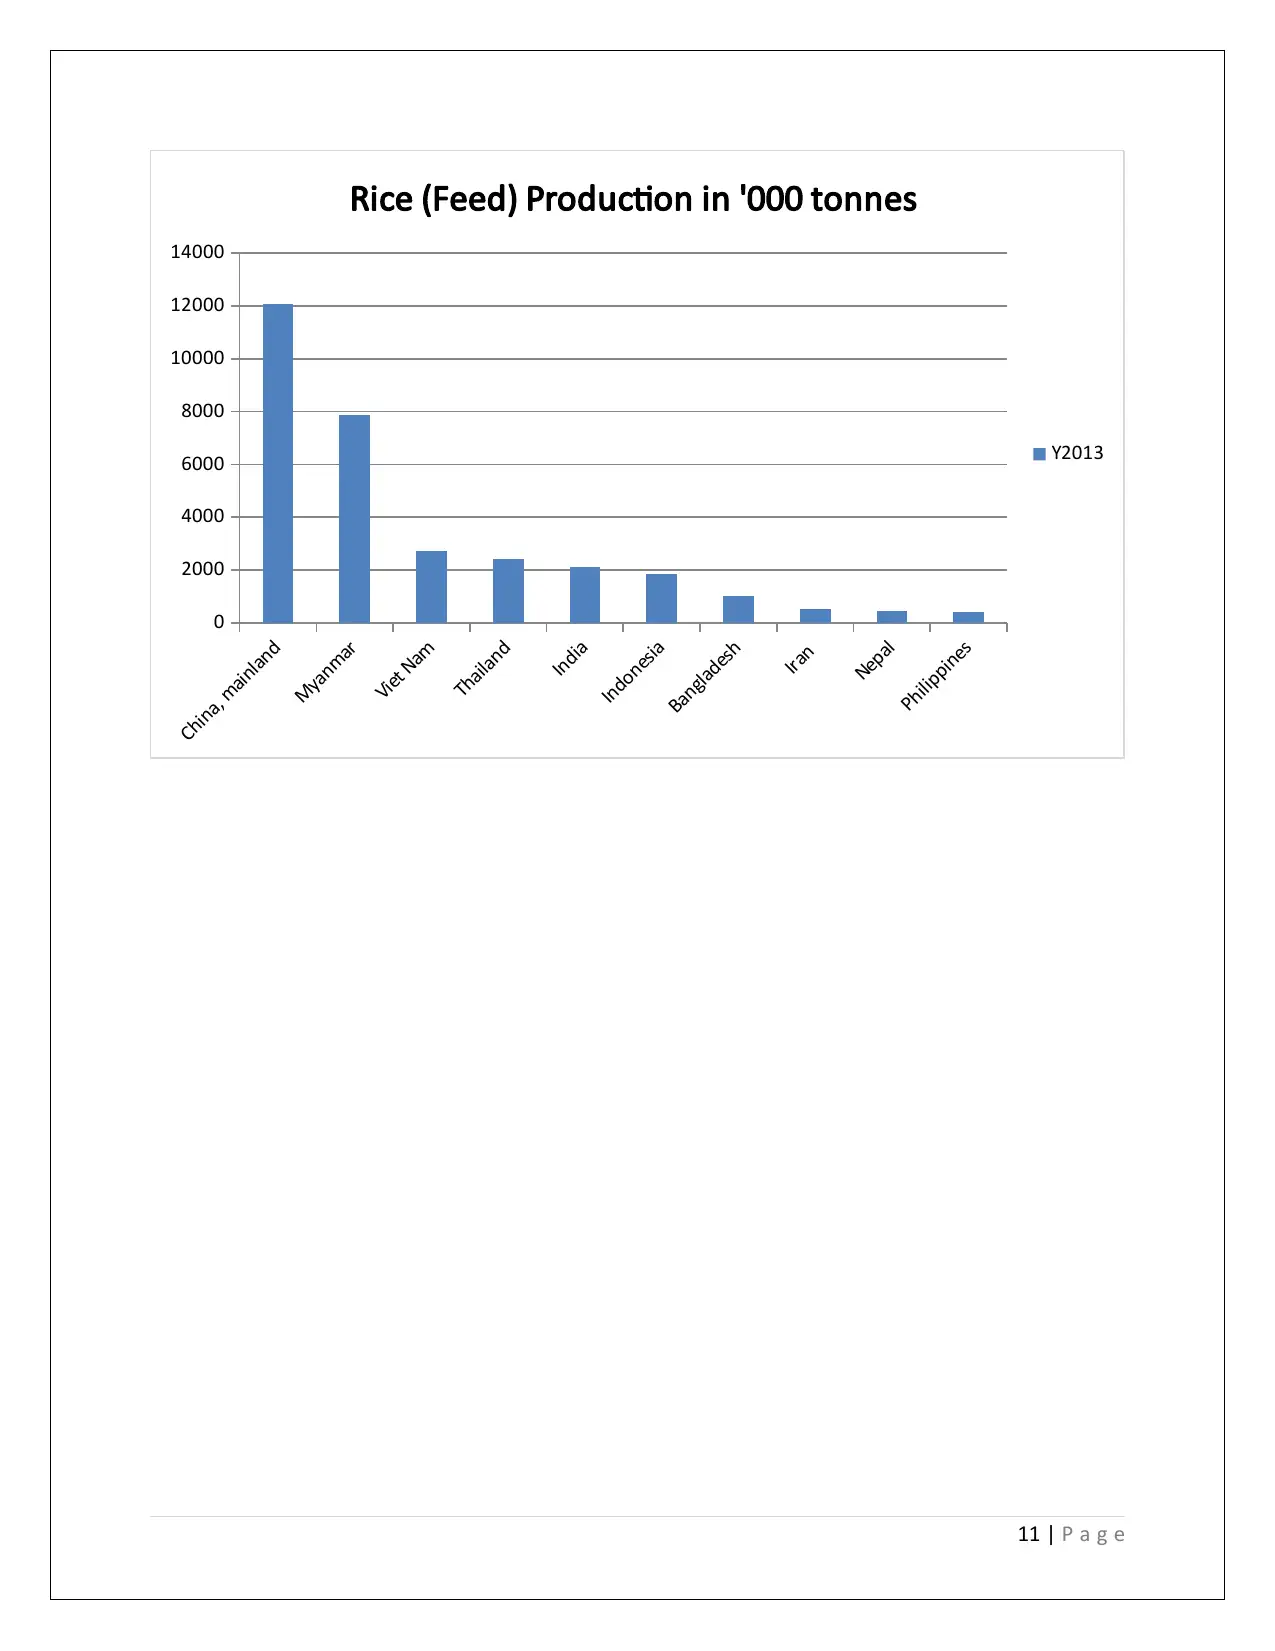
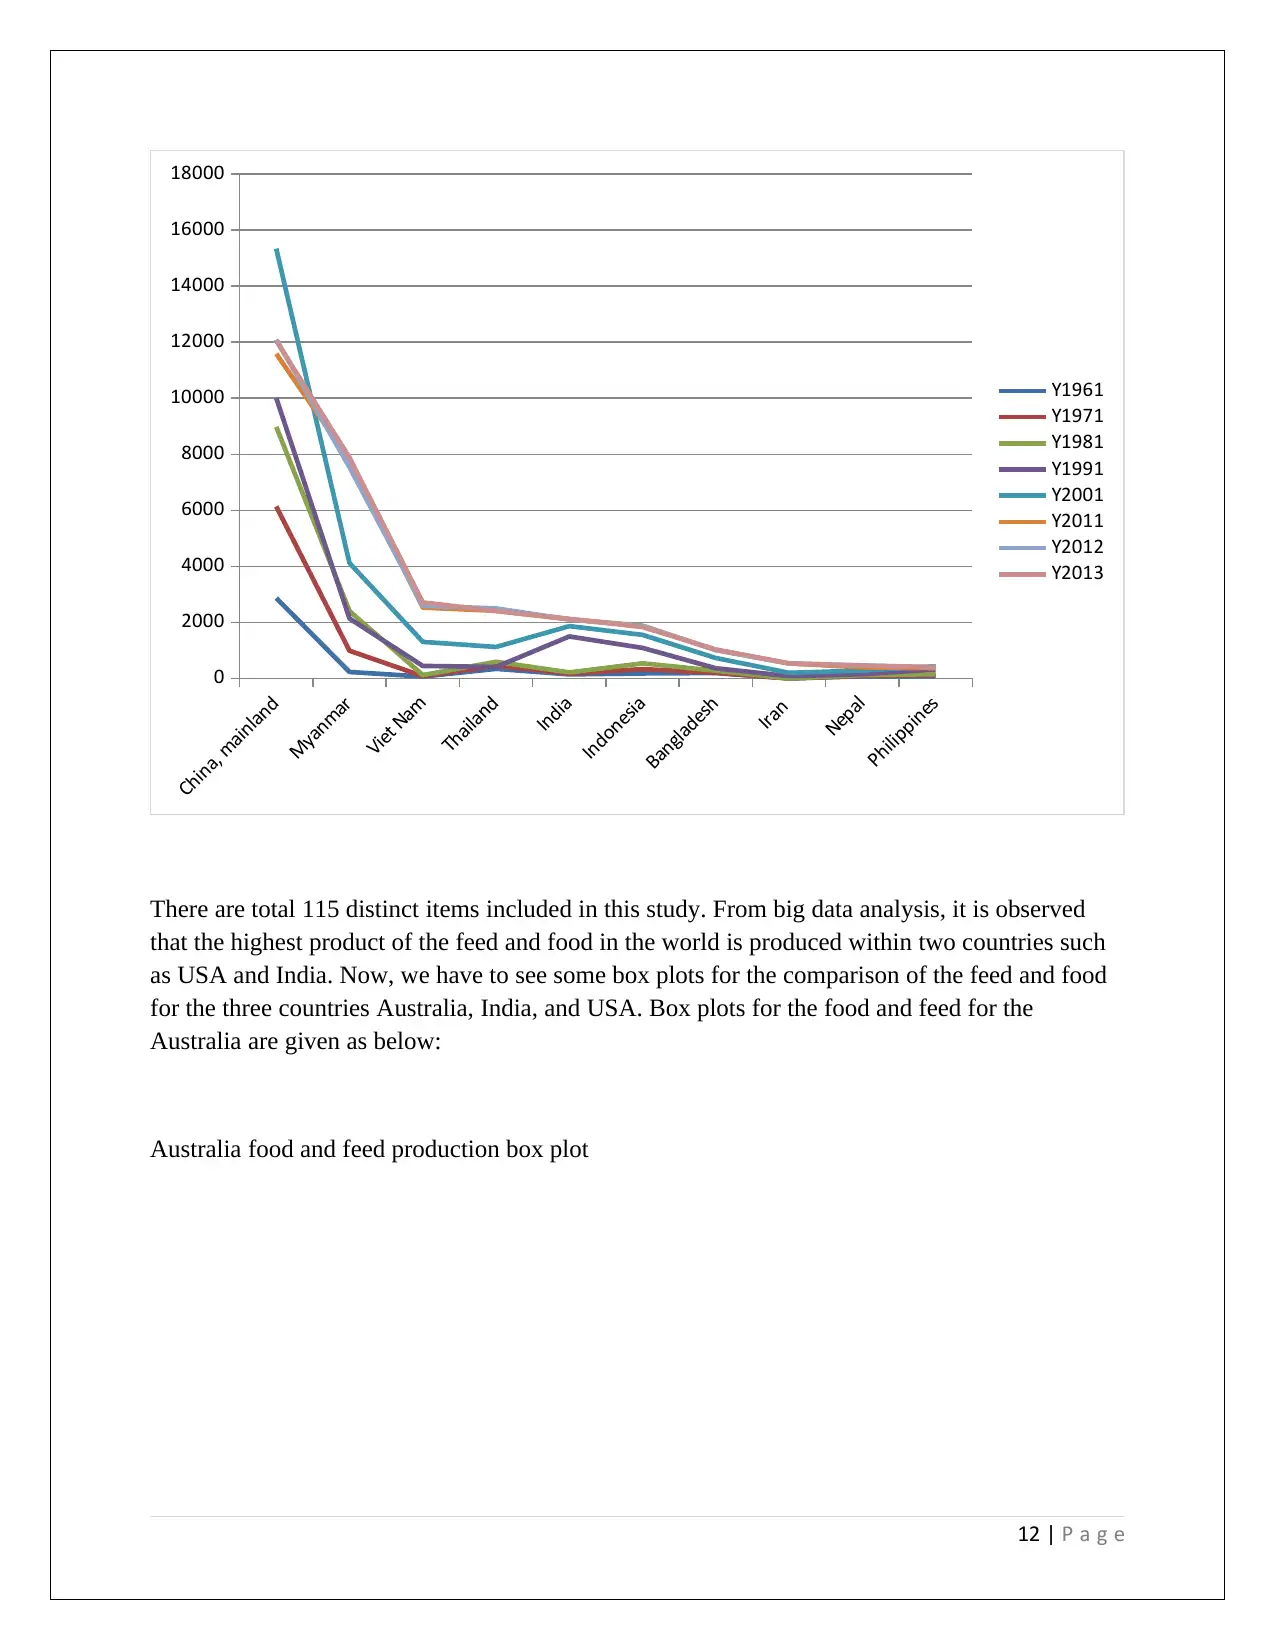
This report presents a real-time analytics data analysis of global rice production, focusing on feed and food production. The analysis includes descriptive statistics, graphical representations, and statistical tests such as independent samples t-tests and two-way ANOVA. The study examines data from the Food and Agriculture Organization of the United Nations, comparing rice production across various countries, with a specific focus on Australia, India, and the USA. The report addresses research questions related to production volumes and statistical differences in feed and food production. Key findings include the identification of outliers in the data, particularly for the mentioned countries, and the application of statistical tests to determine significant differences in production means. The report concludes with discussions on the observed trends and the implications of the statistical outcomes, offering valuable insights into global rice production dynamics. The report also includes detailed tables and figures to support the analysis.

Real Time Analytics
Data Analysis
Data Analysis
Paraphrase This Document
Need a fresh take? Get an instant paraphrase of this document with our AI Paraphraser

Table of Contents
Abstract................................................................................................................................3
Introduction..........................................................................................................................3
Research Questions..............................................................................................................4
Data Collection.....................................................................................................................5
Descriptive Statistics............................................................................................................4
Graphical Analysis...............................................................................................................5
Independent Samples t-tests.................................................................................................3
Two way ANOVA................................................................................................................4
Results and Discussions.......................................................................................................4
Conclusions..........................................................................................................................5
References............................................................................................................................5
2 | P a g e

Real Time Analytics
Data Analysis
Abstract
It is observed that the average rice food production for the year 2013 is given as 2168 thousand
tones with the standard deviation of 11014 thousand tones. The maximum rice food production
for single country in 2013 is observed as 108321 thousand tones. The average rice feed
production for world is given as 415 thousand tonnes with the standard deviation of 1645
thousand tonnes. The maximum rice feed production is given as 12052 thousand tonnes. It is
observed that China is placed at top in the rice food and feed production. There is insufficient
evidence to conclude that the average Rice food production is less than average rice feed
production. It is observed that the highest product of the feed and food in the world is produced
within two countries such as USA and India. From this study, it is observed that there are outliers
exist in the data for the feed and food production in United States of America, India, and
Australia. There is insufficient evidence to conclude that there is a statistically significant
difference exists between the average production of feed and food for Australia. There is
sufficient evidence to conclude that there is a statistically significant difference exists between
the average production of feed and food for India. No sufficient evidence occurred to conclude
that there is a statistically significant difference exists between the average production of feed
and food for USA. Strong and sufficient evidence occurred to conclude that there are statistically
significant differences in the average feed and food production for the three countries such as
Australia, India, and USA.
Introduction
We know that the world population is continuously growing and demand for food for this
population is also increases. So, it is necessary to increase the food production for providing the
food for each one. Also, animal population also increasing and feed production for animal should
be increase. For this project, we have to compare the food and feed production for the Australia
and two countries with highest production of food and feed. We have to compare the variation
pattern in the use of food and feed for the different countries. For this purpose, we have to collect
the data and then we have to check some hypotheses by using proper statistical tools and
techniques. Let us see this statistical data analysis in detail.
3 | P a g e
⊘ This is a preview!⊘
Do you want full access?
Subscribe today to unlock all pages.

Trusted by 1+ million students worldwide

Research Questions
For this research study, the research questions are summarised as below:
a. Which countries produce most production of food and feed?
b. Is there a statistically significant difference exists between the average production of feed
and food for Australia?
c. Is there a statistically significant difference exists between the average production of feed
and food for India?
d. Is there a statistically significant difference exists between the average production of feed
and food for USA?
e. Are there statistically significant differences in the average feed and food production for
the three countries such as Australia, India, and USA?
Data Collection
For this research project, data is collected from The Food and Agriculture Organization of the
United Nations. United Nations Organization provides the free access for this data for 245
countries and territories from the year 1961 to 2013. Required website for this data is given in
the reference list.
Descriptive Statistics
We know that the descriptive statistics provides us the idea about the nature of variables included
in the data set.
Here, we have to see some descriptive statistics for the Rice feed and food production in world.
All numbers in the following tables are given in thousand tonnes. First of all we have to see the
descriptive statistics for the Rice feed and food production for the world. Descriptive statistics
for feed and food production for entire world is summarised as below:
Y2013
Rice (Food) production for world in ‘000 tones
Mean 2168.310345
Standard Error 834.9732259
Median 107
Mode 1
Standard Deviation 11014.0533
Sample Variance 121309370.1
Kurtosis 70.21168333
Skewness 8.117025439
Range 108321
Minimum 0
4 | P a g e
Paraphrase This Document
Need a fresh take? Get an instant paraphrase of this document with our AI Paraphraser

Maximum 108321
Sum 377286
Count 174
From above descriptive statistics, it is observed that the average rice food production for the year
2013 is given as 2168 thousand tones with the standard deviation of 11014 thousand tones. The
maximum rice food production for single country in 2013 is observed as 108321 thousand tones.
Now, we have to see the descriptive statistics for the rice feed production for all countries which
is given as below:
Y2013
Rice (Feed) World Production in '000 tones
Mean 414.7407407
Standard Error 182.7726754
Median 5
Mode 0
Standard Deviation 1644.954078
Sample Variance 2705873.919
Kurtosis 36.46249072
Skewness 5.805432137
Range 12052
Minimum 0
Maximum 12052
Sum 33594
Count 81
The average rice feed production for world is given as 415 thousand tonnes with the standard
deviation of 1645 thousand tonnes. The maximum rice feed production is given as 12052
thousand tonnes.
The list of first ten countries in the production of rice food is given as below:
Food
Area Y1961 Y1971 Y1981 Y1991 Y2001 Y2011 Y2012 Y2013
China, mainland 26687 58217 74814 86891 100658 109404 107956 108321
India 30617 37289 45355 68068 74649 86478 86933 87006
Indonesia 7669 12855 18896 23616 27046 32431 33175 33637
Bangladesh 8761 10178 12493 17583 23295 26387 26681 26892
Viet Nam 4903 6374 7424 9006 12412 13066 12865 13253
Philippines 2465 3231 4724 5373 8256 11290 11689 11752
5 | P a g e

Thailand 4023 6060 6494 6725 7115 7461 7654 7677
Japan 10529 9365 8442 7983 7450 6641 7469 7609
Myanmar 2410 2992 4120 5171 6441 6548 6844 7073
Brazil 2869 3790 4925 5989 6266 6727 6309 6437
It is observed that China is placed at top in the rice food production.
The list of first ten countries for the rice feed production is given as below:
Feed
Area Y1961 Y1971 Y1981 Y1991 Y2001 Y2011 Y2012 Y2013
China, mainland 2869 6137 8978 10008 15342 11589 12100 12052
Myanmar 228 990 2405 2136 4119 7786 7538 7882
Viet Nam 66 79 116 446 1302 2526 2589 2712
Thailand 339 458 593 408 1122 2410 2499 2405
India 143 172 213 1495 1866 2106 2105 2124
Indonesia 176 334 540 1089 1552 1879 1873 1832
Bangladesh 192 199 273 363 726 1014 1011 1031
Iran 0 0 0 79 200 534 534 534
Nepal 76 90 118 153 277 392 464 457
Philippines 73 112 153 321 432 364 394 402
It is observed that China is placed top for the rice feed production.
Now, we have to see some descriptive statistics for the feed and food production in Australia,
India, and United States of America. All numbers in the following tables are given in thousand
tonnes. First of all we have to see the descriptive statistics for the feed and food production for
the country Australia. Descriptive statistics for feed and food production for Australia is
summarised as below:
Descriptive Summary
Australia
Feed Food
Mean 684.1111111
435.396039
6
Median 97 75
Mode 2 0
Minimum 0 0
Maximum 7936 5474
Range 7936 5474
Variance
2673752.102
6
885667.601
6
6 | P a g e
⊘ This is a preview!⊘
Do you want full access?
Subscribe today to unlock all pages.

Trusted by 1+ million students worldwide

Standard
Deviation 1635.1612 941.0991
Coeff. of
Variation 239.02% 216.15%
Skewness 3.7778 3.6598
Kurtosis 15.7139 15.5990
Count 27 101
Standard Error 314.6869 93.6429
From above table, it is observed that the average feed production for Australia is given as 684.11
thousand tonnes with the standard deviation of 1635.16 thousand tonnes. The average food
production for Australia is given as 435.40 thousand tonnes with the standard deviation of
941.10 thousand tonnes.
Now, we have to see these descriptive statistics for the feed and food production for the country
India which is given as below:
Descriptive Summary
India
Feed Food
Mean 3779.153846 11466.06481
Median 312 1111.5
Mode 0 0
Minimum 0 0
Maximum 22757 185884
Range 22757 185884
Variance
40572128.135
4
814513849.743
4
Standard
Deviation 6369.6254 28539.6890
Coeff. of
Variation 168.55% 248.91%
Skewness 2.2656 3.7386
Kurtosis 4.8132 15.7770
Count 26 108
Standard Error 1249.1863 2746.2329
From above table, it is observed that the average feed production for India is given as 3779.15
thousand tonnes with the standard deviation of 6369.63 thousand tonnes. The average food
production for India is given as 11466.06 thousand tonnes with the standard deviation of
28539.69 thousand tonnes.
7 | P a g e
Paraphrase This Document
Need a fresh take? Get an instant paraphrase of this document with our AI Paraphraser

Now, we have to see this descriptive statistics for the food and feed production for the country
USA which is given as below:
Descriptive Summary
USA
Feed Food
Mean 8246.194444 6112.152381
Median 374.5 892
Mode 165 0
Minimum 0 0
Maximum 140096 81513
Range 140096 81513
Variance
961442432.446
8
185683111.361
2
Standard
Deviation 31007.1352 13626.5590
Coeff. of
Variation 376.02% 222.94%
Skewness 4.0547 3.8044
Kurtosis 15.3711 17.1086
Count 36 105
Standard Error 5167.8559 1329.8160
From above table, it is observed that the average feed production for USA is given as
8246.194444 thousand tonnes with the standard deviation of 31007.1352 thousand tonnes. The
average food production for USA is given as 6112.152381 thousand tonnes with the standard
deviation of 13626.5590 thousand tonnes.
Graphical Analysis
Graphical analysis plays an important role in easy understanding of the concepts. Here, we have
to use the graphical analysis for showing the variation of the production in different countries. In
this topic, we have to see some graphical analysis of the given data set. Most dark blue colour in
the following graph shows the highest yield or production by country.
8 | P a g e

Figure 1 (From analysis from IBM Watson)
9 | P a g e
9 | P a g e
⊘ This is a preview!⊘
Do you want full access?
Subscribe today to unlock all pages.

Trusted by 1+ million students worldwide

China, mainland
India
Indonesia
Bangladesh
Viet Nam
Philippines
Thailand
Japan
Myanmar
Brazil
0
20000
40000
60000
80000
100000
120000
Rice (Food) Production in '000 tonnes
Y2013
China, mainland
India
Indonesia
Bangladesh
Viet Nam
Philippines
Thailand
Japan
Myanmar
Brazil
0
20000
40000
60000
80000
100000
120000
Y1961
Y1971
Y1981
Y1991
Y2001
Y2011
Y2012
Y2013
10 | P a g e
India
Indonesia
Bangladesh
Viet Nam
Philippines
Thailand
Japan
Myanmar
Brazil
0
20000
40000
60000
80000
100000
120000
Rice (Food) Production in '000 tonnes
Y2013
China, mainland
India
Indonesia
Bangladesh
Viet Nam
Philippines
Thailand
Japan
Myanmar
Brazil
0
20000
40000
60000
80000
100000
120000
Y1961
Y1971
Y1981
Y1991
Y2001
Y2011
Y2012
Y2013
10 | P a g e
Paraphrase This Document
Need a fresh take? Get an instant paraphrase of this document with our AI Paraphraser

China, mainland
Myanmar
Viet Nam
Thailand
India
Indonesia
Bangladesh
Iran
Nepal
Philippines
0
2000
4000
6000
8000
10000
12000
14000
Rice (Feed) Production in '000 tonnes
Y2013
11 | P a g e
Myanmar
Viet Nam
Thailand
India
Indonesia
Bangladesh
Iran
Nepal
Philippines
0
2000
4000
6000
8000
10000
12000
14000
Rice (Feed) Production in '000 tonnes
Y2013
11 | P a g e

China, mainland
Myanmar
Viet Nam
Thailand
India
Indonesia
Bangladesh
Iran
Nepal
Philippines
0
2000
4000
6000
8000
10000
12000
14000
16000
18000
Y1961
Y1971
Y1981
Y1991
Y2001
Y2011
Y2012
Y2013
There are total 115 distinct items included in this study. From big data analysis, it is observed
that the highest product of the feed and food in the world is produced within two countries such
as USA and India. Now, we have to see some box plots for the comparison of the feed and food
for the three countries Australia, India, and USA. Box plots for the food and feed for the
Australia are given as below:
Australia food and feed production box plot
12 | P a g e
⊘ This is a preview!⊘
Do you want full access?
Subscribe today to unlock all pages.

Trusted by 1+ million students worldwide
1 out of 29
Related Documents
Your All-in-One AI-Powered Toolkit for Academic Success.
 +13062052269
info@desklib.com
Available 24*7 on WhatsApp / Email
Unlock your academic potential
Copyright © 2020–2026 A2Z Services. All Rights Reserved. Developed and managed by ZUCOL.


