Real World Analytics Project: Cooling Load Prediction and Optimization
VerifiedAdded on 2021/06/14
|11
|1501
|131
Project
AI Summary
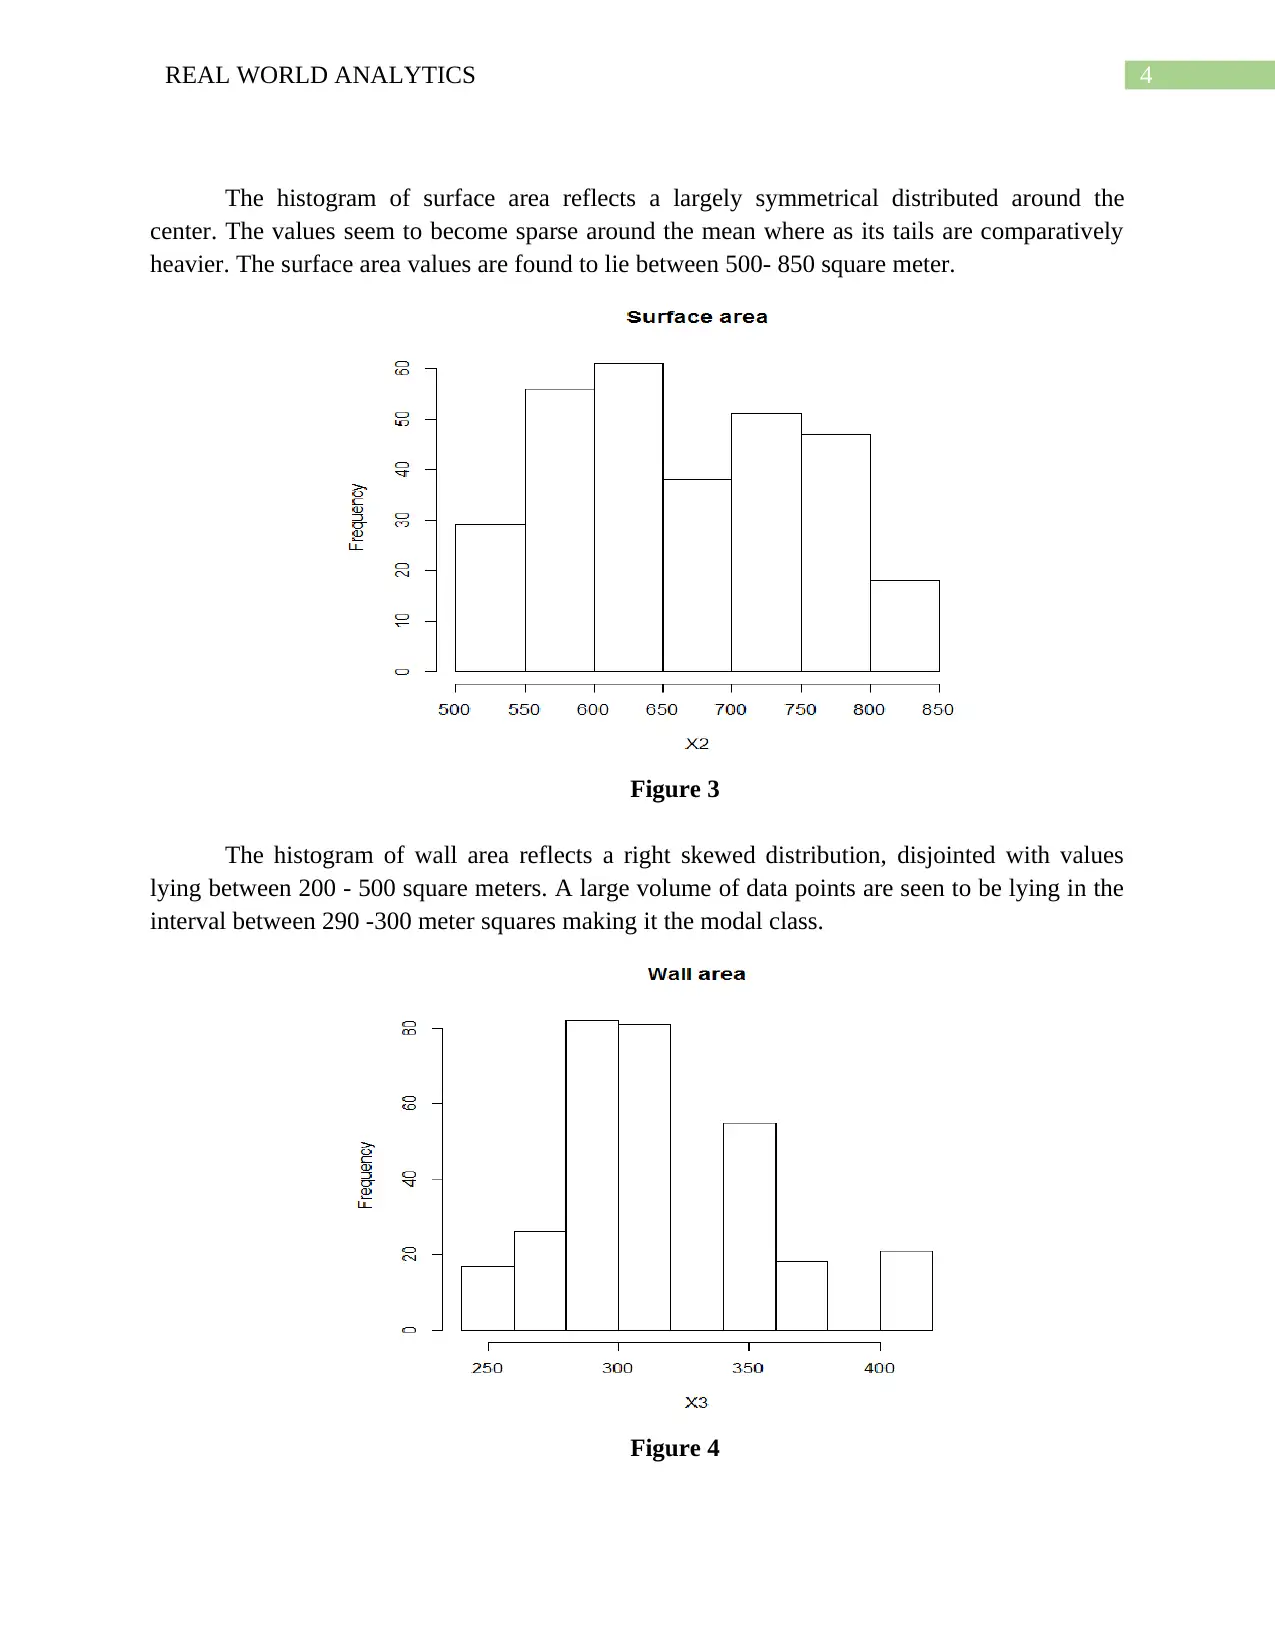
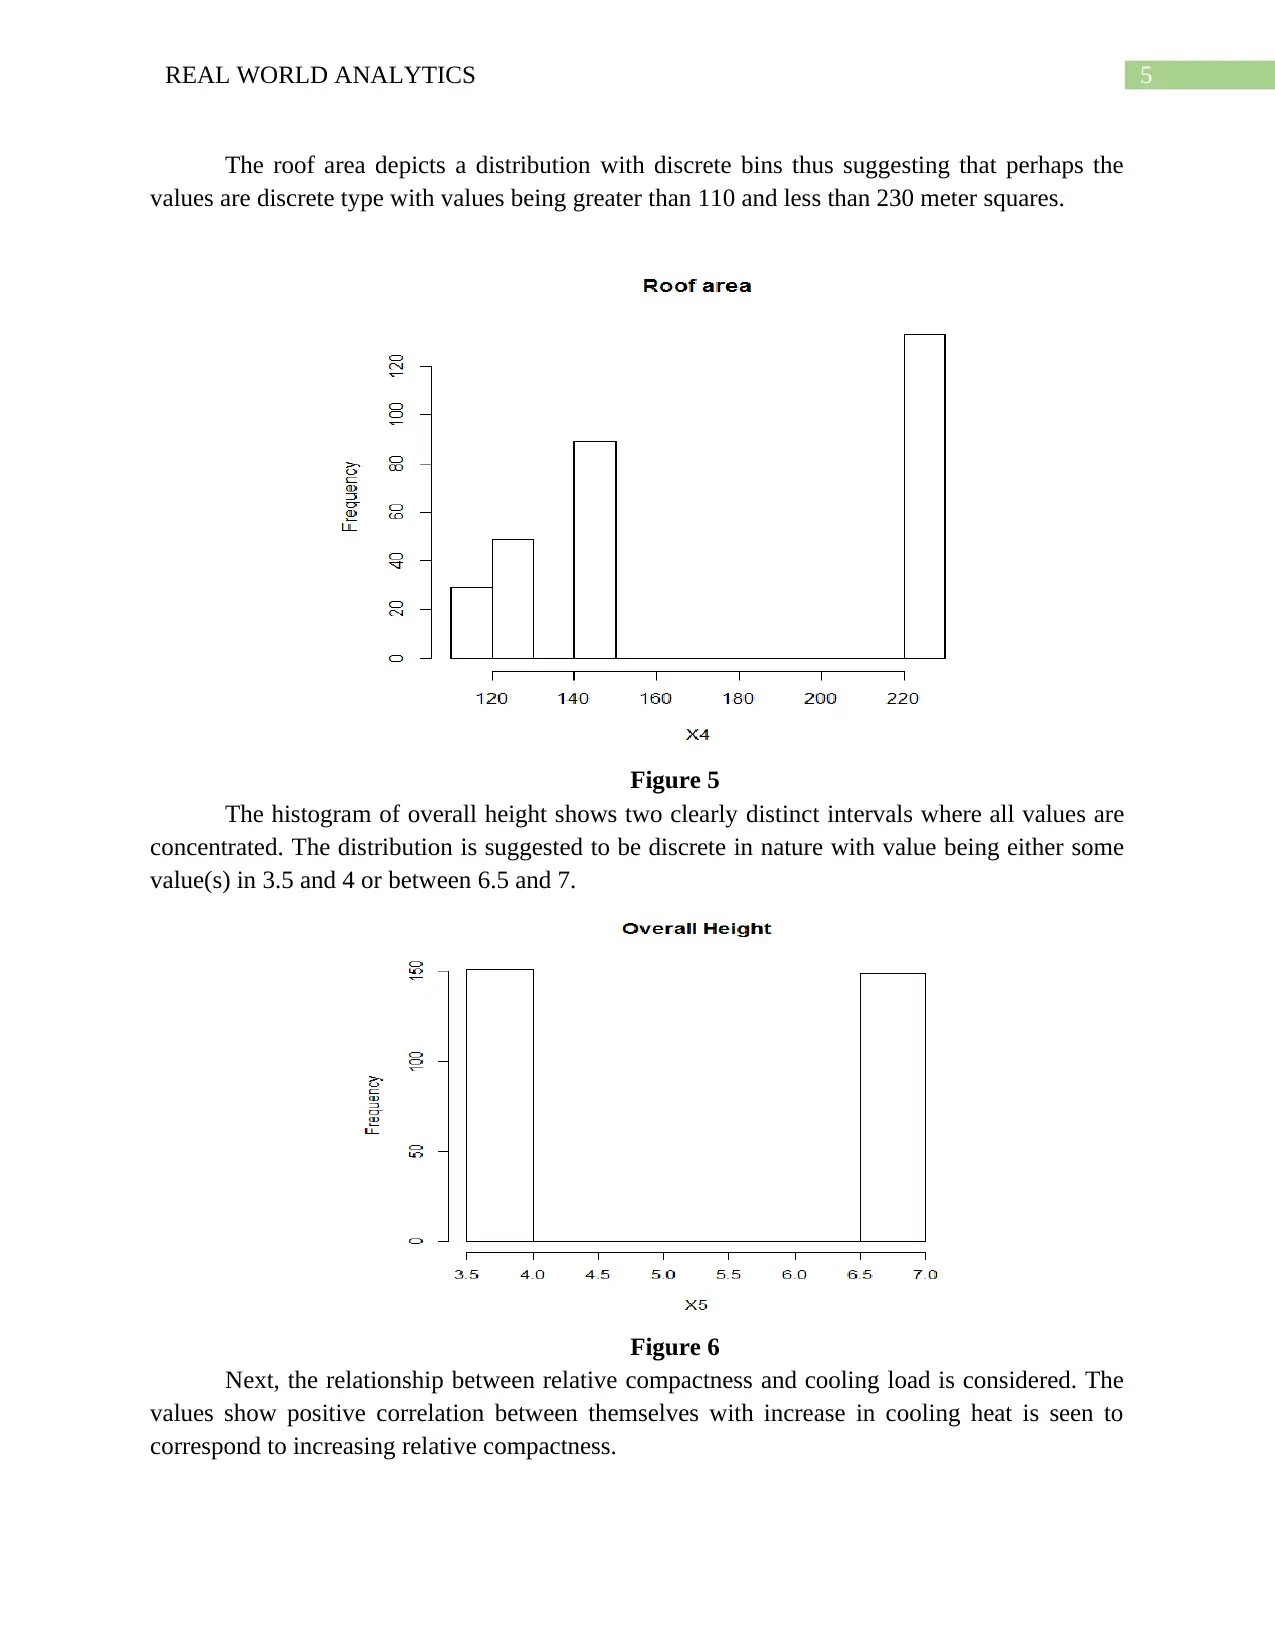
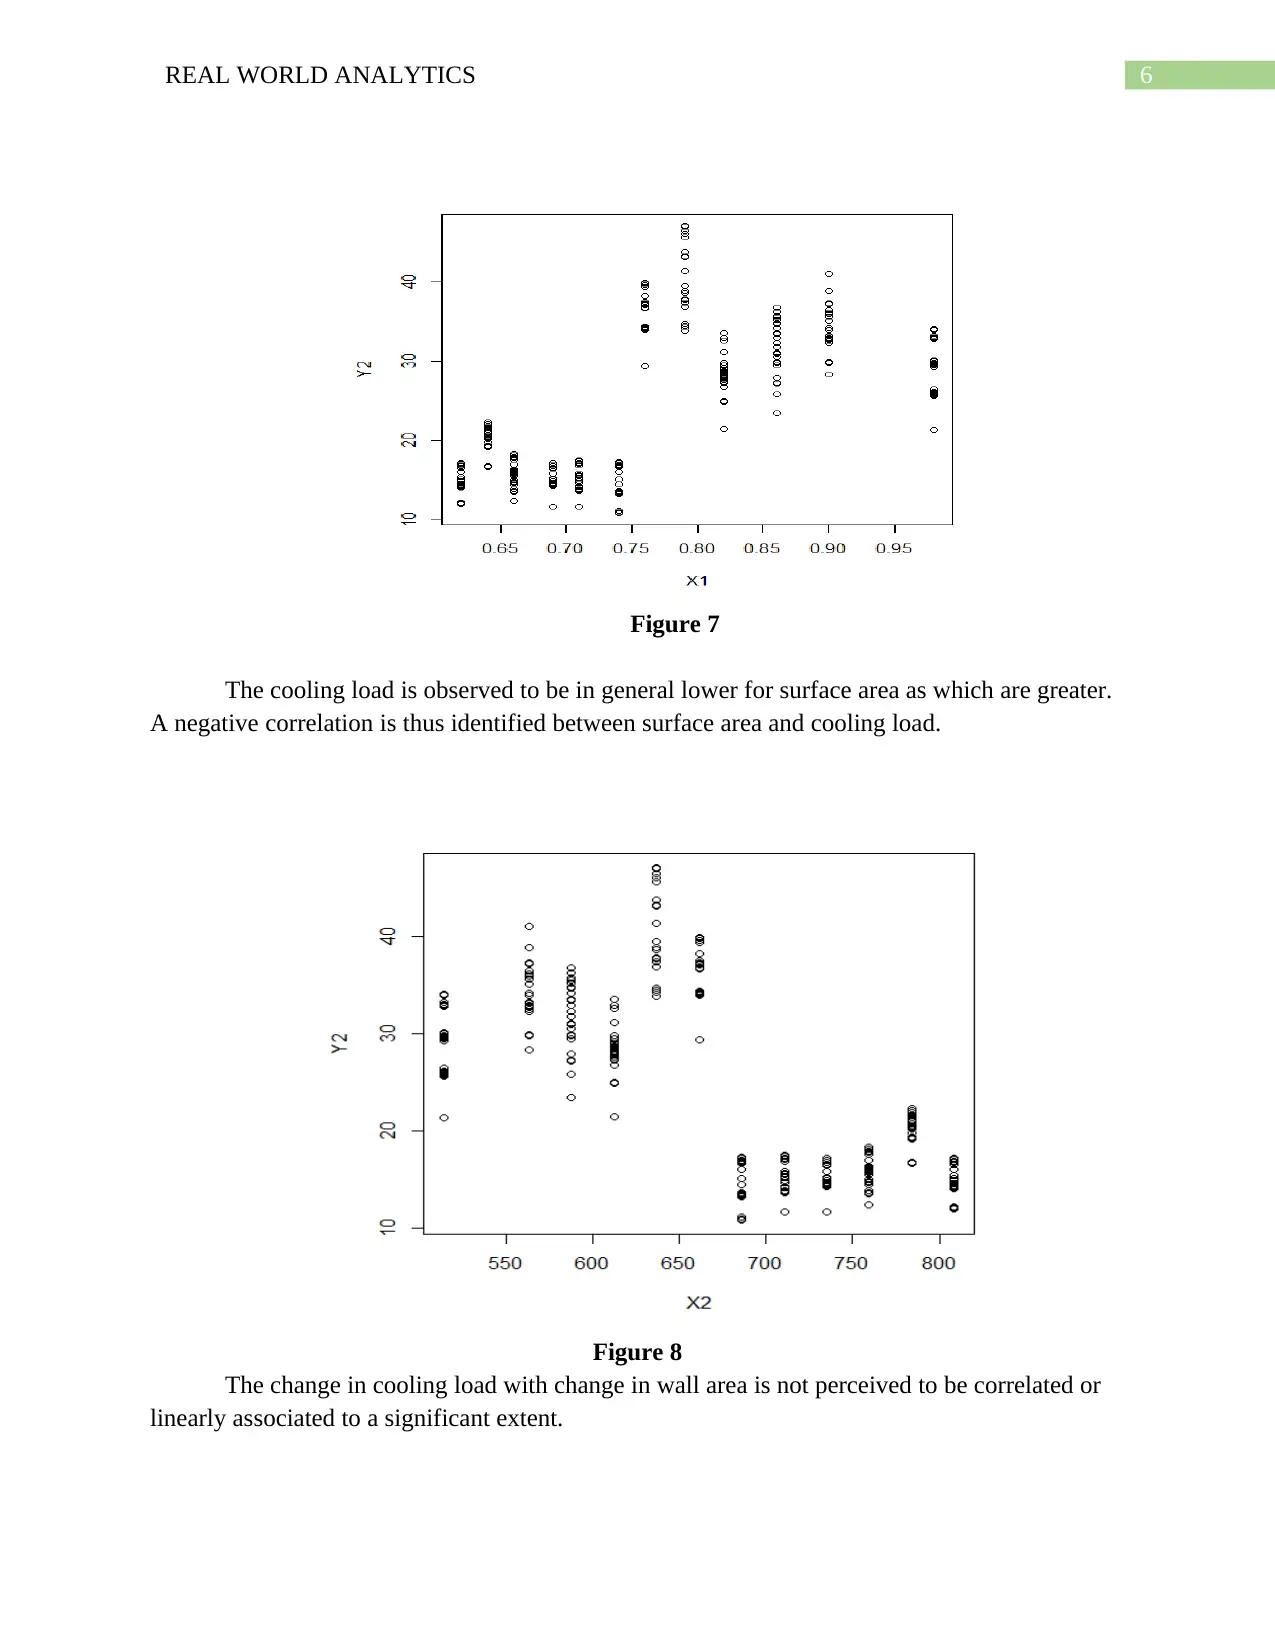
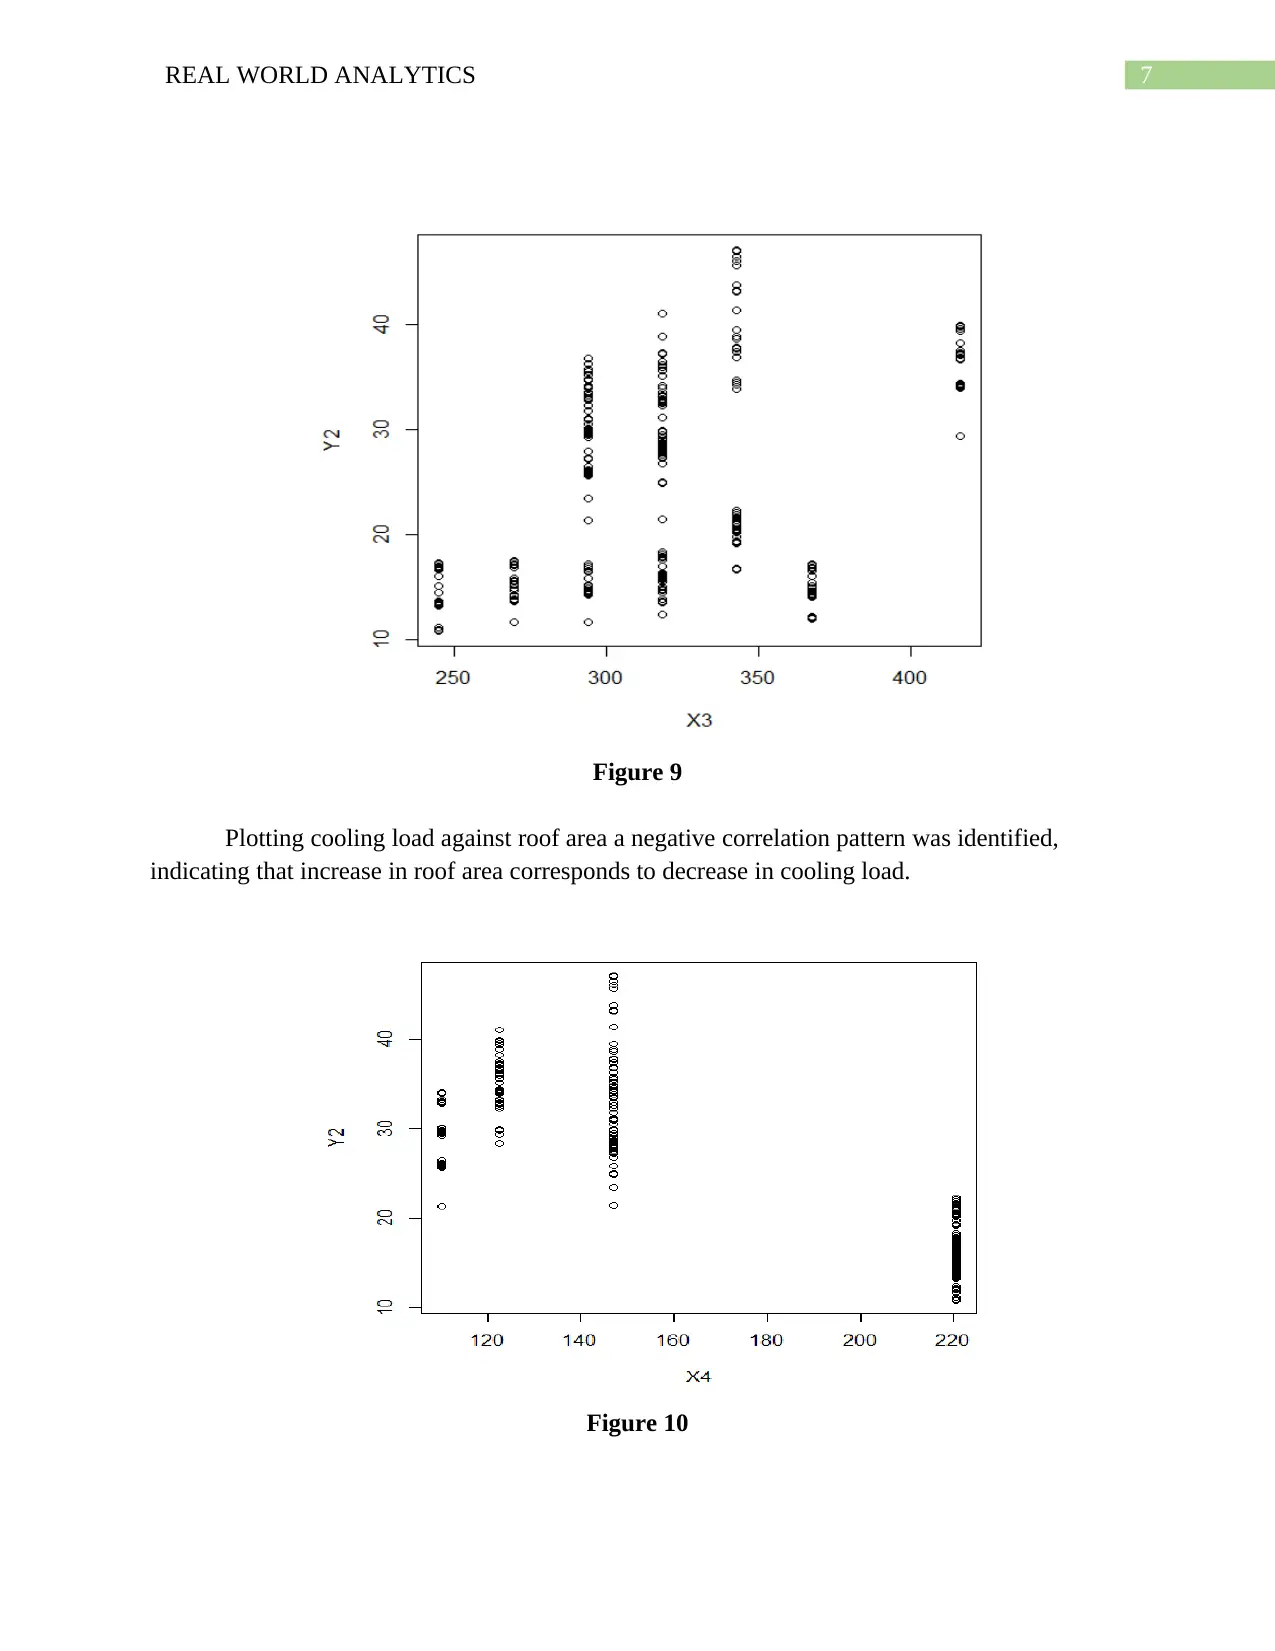
This project analyzes cooling load data to predict energy consumption in buildings. It utilizes a dataset of 300 samples, exploring the influence of various independent variables such as relative compactness, surface area, wall area, roof area, and overall height on cooling load. The analysis is conducted in R, involving data visualization through histograms and scatter plots to understand the relationships between variables. The project transforms variables to reduce skewness and employs different models, including weighted average mean, weighted power means, ordered weighted averages, and Choquet's integral, to predict cooling load. The weighted power average model with a power of 0.5 is identified as the best fit. Furthermore, a linear regression model is fitted, and the predicted cooling load is calculated based on specific values of the independent variables. Finally, the project extends to an optimization problem involving juice blending, defining constraints related to concentrate volumes to minimize the cost of the special juice.
1 out of 11
Related Documents


Your All-in-One AI-Powered Toolkit for Academic Success.
+13062052269
info@desklib.com
Available 24*7 on WhatsApp / Email
![[object Object]](/_next/static/media/star-bottom.7253800d.svg)
Copyright © 2020–2026 A2Z Services. All Rights Reserved. Developed and managed by ZUCOL.