Ask a question from expert

Ask now

Real WORLD ANALYTICS 12 12 REAL WORLD ANALYTICS Name of Student Name

13 Pages1766 Words465 Views
   

Added on  2021-05-30

About This Document

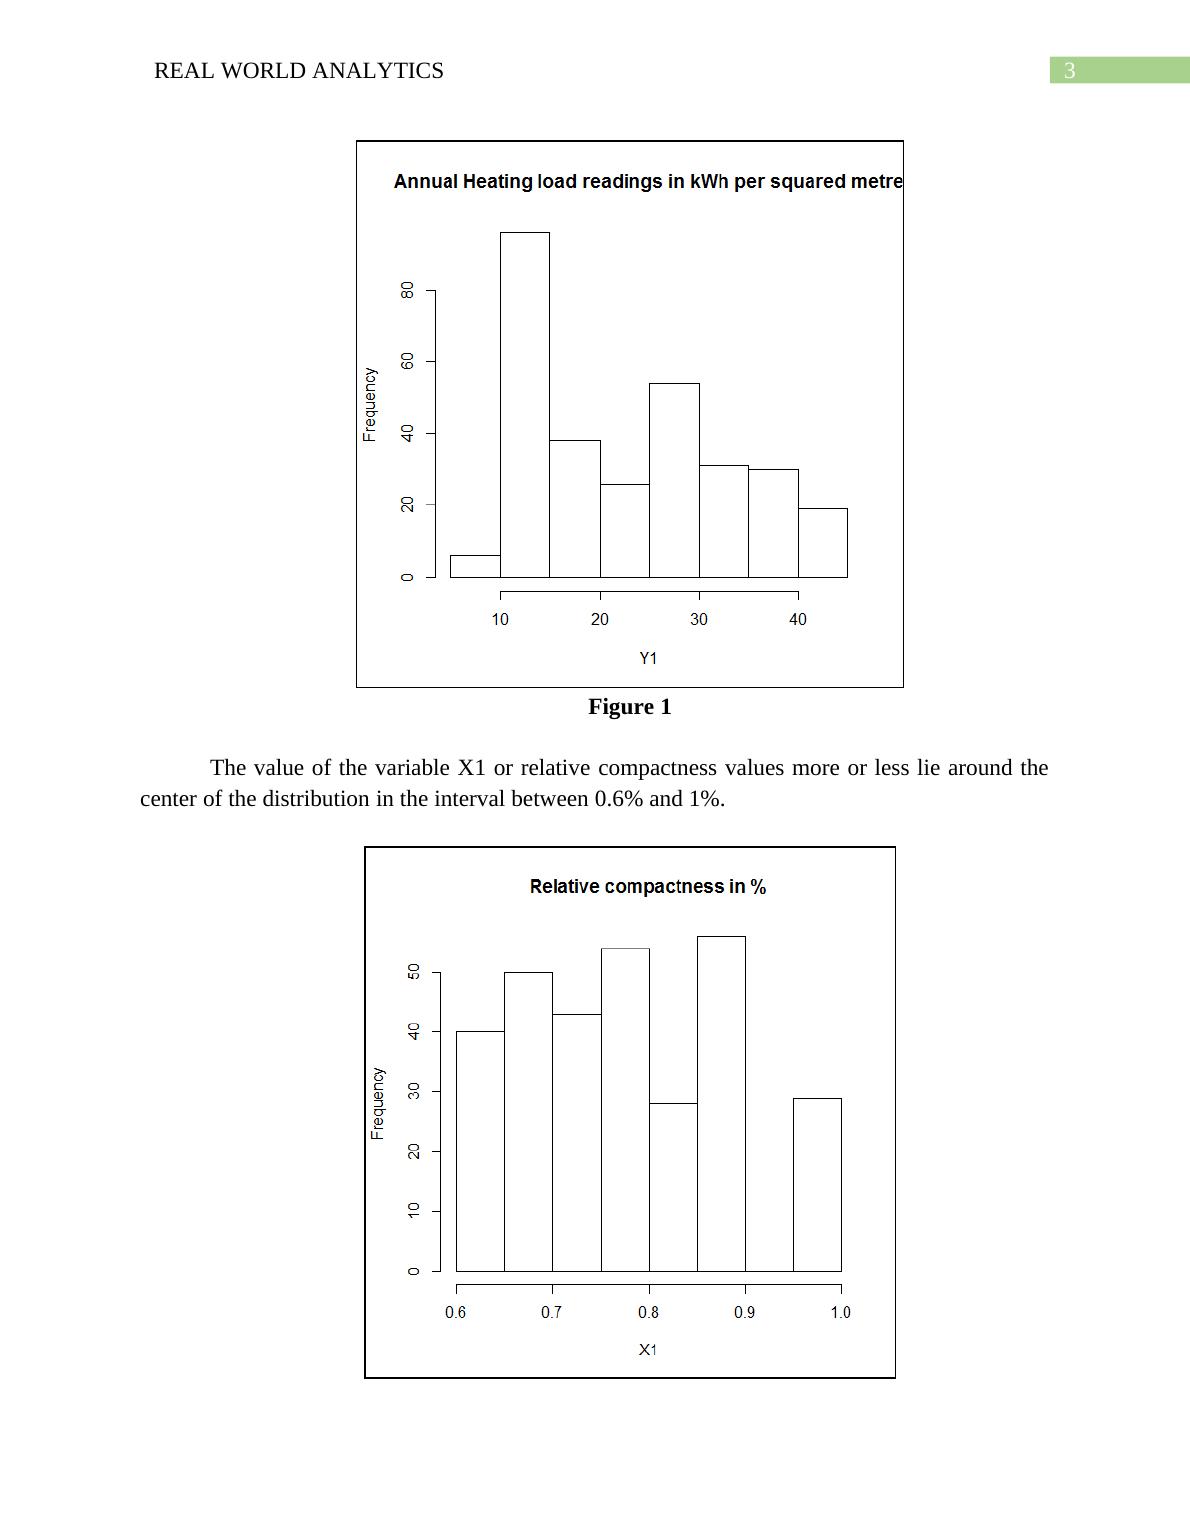
REAL WORLD ANALYTICS REAL WORLD ANALYTICS 12 12 REAL WORLD ANALYTICS REAL WORLD ANALYTICS Name of Student Name of University Part A: 2 Description of Data 2 Task 1 2 Task 2 10 Task 3 10 Task 4 11 Part A: Description of Data Heating and cooling load are quite significant consideration while determining the specifics of the equipment used for heating and cooling purposes in eco-friendly , energy saving designs of buildings. The study takes into account the independent variables such as relative

Real WORLD ANALYTICS 12 12 REAL WORLD ANALYTICS Name of Student Name

   Added on 2021-05-30

BookmarkShareRelated Documents
Running head: REAL WORLD ANALYTICSREAL WORLD ANALYTICSName of StudentName of University
Real WORLD ANALYTICS 12 12 REAL WORLD ANALYTICS Name of Student Name_1
REAL WORLD ANALYTICS1Table of ContentsPart A:..............................................................................................................................................2Description of Data......................................................................................................................2Task 1...........................................................................................................................................2Task 2.........................................................................................................................................10Task 3.........................................................................................................................................10Task 4.........................................................................................................................................11
Real WORLD ANALYTICS 12 12 REAL WORLD ANALYTICS Name of Student Name_2
REAL WORLD ANALYTICS2Part A: Description of DataHeating and cooling load are quite significant consideration while determining the specifics of the equipment used for heating and cooling purposes in eco-friendly , energy saving designs of buildings. It is why tools used for simulation of energy for predicting the tentative energy consumption behavior in a building are necessary. The paper considers the two parameters, Heating load (Y1) and Cooling load (Y2) as variables of interest to be studied and analyzed. The study takes into account the independent variables such as relative compactness (X1), Surface area (X2), wall area(X3), roof area (X4) and additionally the overall height (X5) of the building as indicators or influencers of the two variables heating load and cooling load. The data consists of data from 768 buildings which was simulated via building simulator tool. The subsequent analysis as per the requirements of the assignment was done in R.Task 1The file ENB18data.txt, downloaded from CloudDeakin consists of the data as described in the previous section which was used for the study. The data was saved in the working directory of R software and thus loaded into R environment. It was assigned to a data matrix, named “the.data” as directed by the requirement file of the assignment. The matrix had 7 columns storing data on the seven variables and 786 rows of observations on each of the seven variables.The assignment required only one variable of interest to be chosen between the heating Load (Y1) and the cooling load (Y2). Y1 was chosen as the study variable for this paper. Thus this the paper deals with the analysis of the Y1 variable and its relationship with the other independent variables X1, X2, X3, X4, and X5. A sample of size 300 was chosen randomly fromamong the 768 rows of data, as directed by the assignment requirements and the ensuing analysiswas done on this sample.The following diagram shows the histogram of the variable Y1 or annual heating load (KWh / meter square). It is seen to follow a distribution which is positively skewed , which means that most of the values of Y1 seem to be located along the left hand side of the distributional curve or the left tail which makes its right tail more elongated than its left making it positively or right skewed. The mode or the maximum frequency is found to be in the interval between 15KWh per square meter and 20KWh per square meter.
Real WORLD ANALYTICS 12 12 REAL WORLD ANALYTICS Name of Student Name_3
REAL WORLD ANALYTICS3Figure 1The value of the variable X1 or relative compactness values more or less lie around thecenter of the distribution in the interval between 0.6% and 1%.
Real WORLD ANALYTICS 12 12 REAL WORLD ANALYTICS Name of Student Name_4

End of preview

Want to access all the pages? Upload your documents or become a member.

Related Documents
Real World Analytics - Assignment Sample
|11
|1501
|131

Analysis of Energy Efficiency Dataset for Buildings - PDF
|12
|1568
|214

Real World Analytics - Assignment
|13
|1530
|90

Real World Analytics - Assignment Sample
|15
|1161
|15

SIT718 Real World Analytics
|9
|2017
|57