University of West London: K. Green's Financial Statement Analysis
VerifiedAdded on 2023/01/12
|8
|1143
|99
Homework Assignment
AI Summary
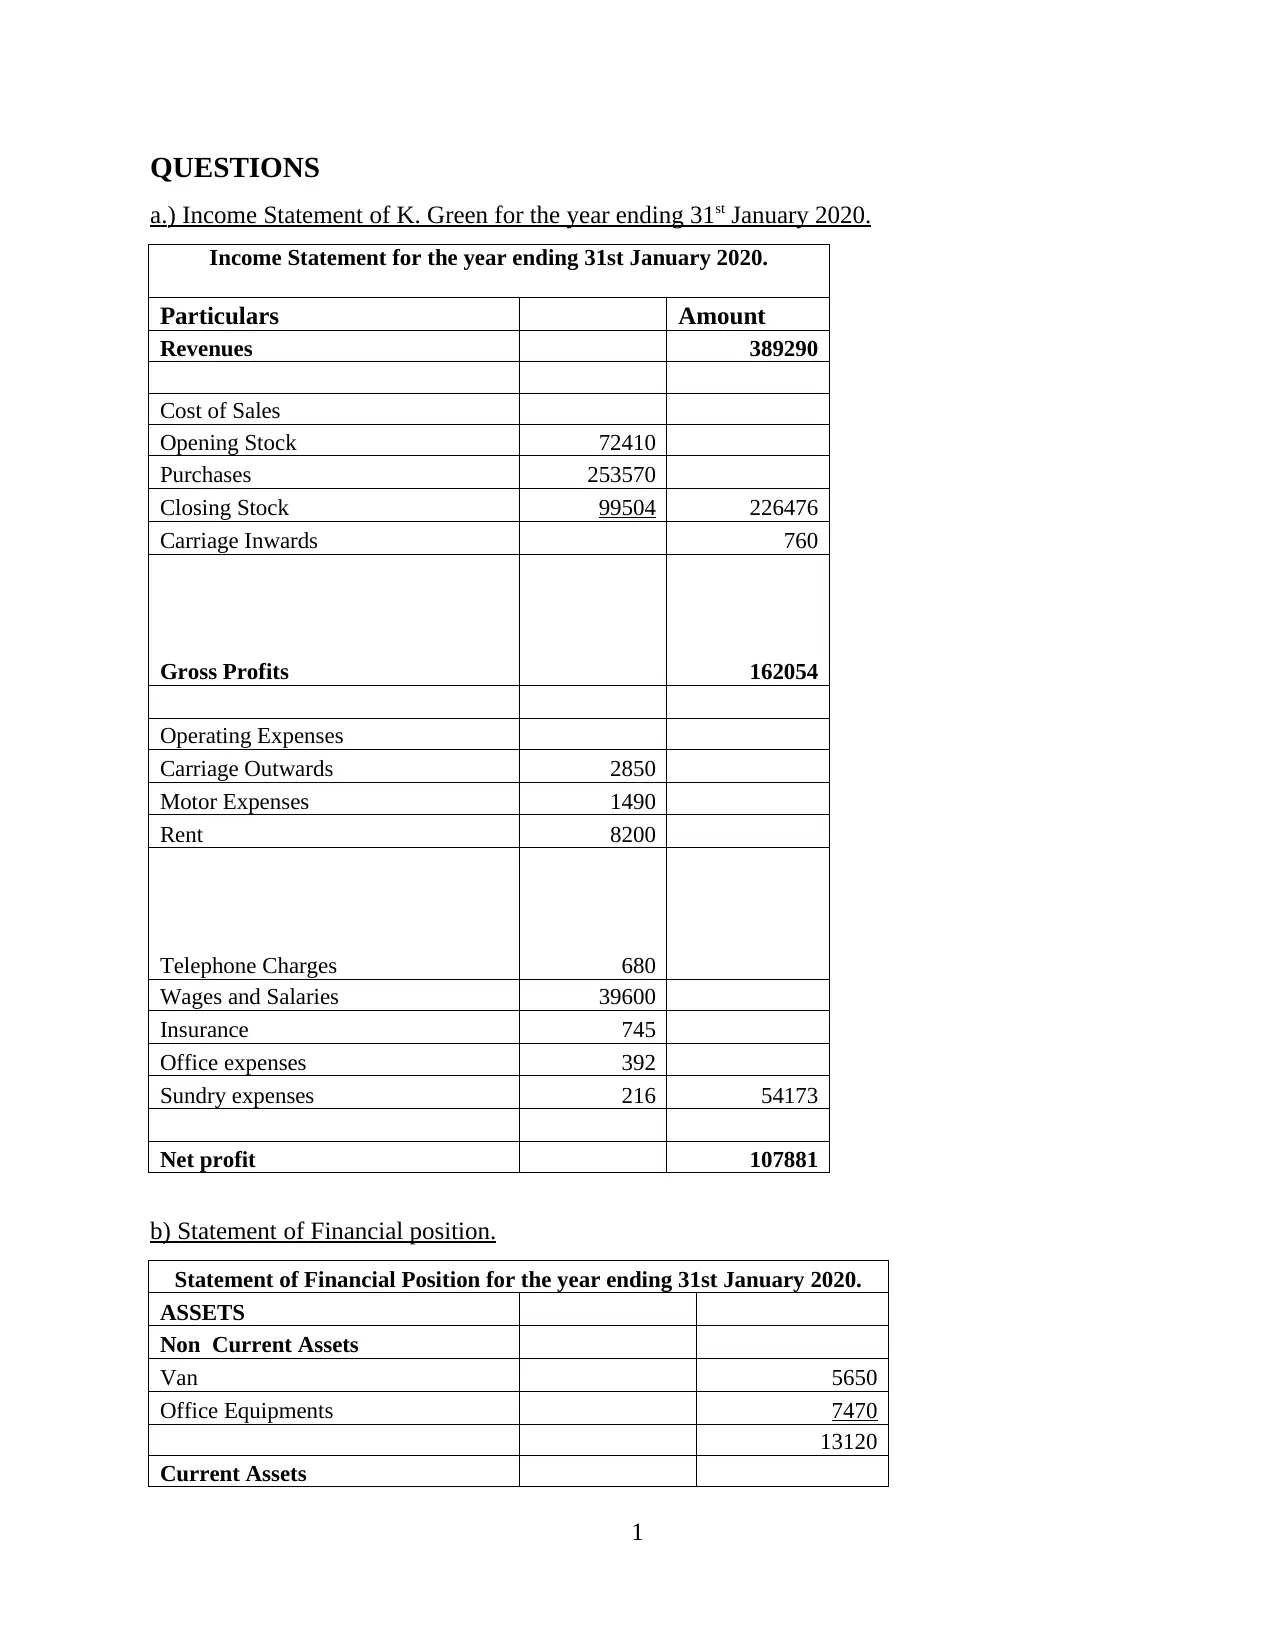
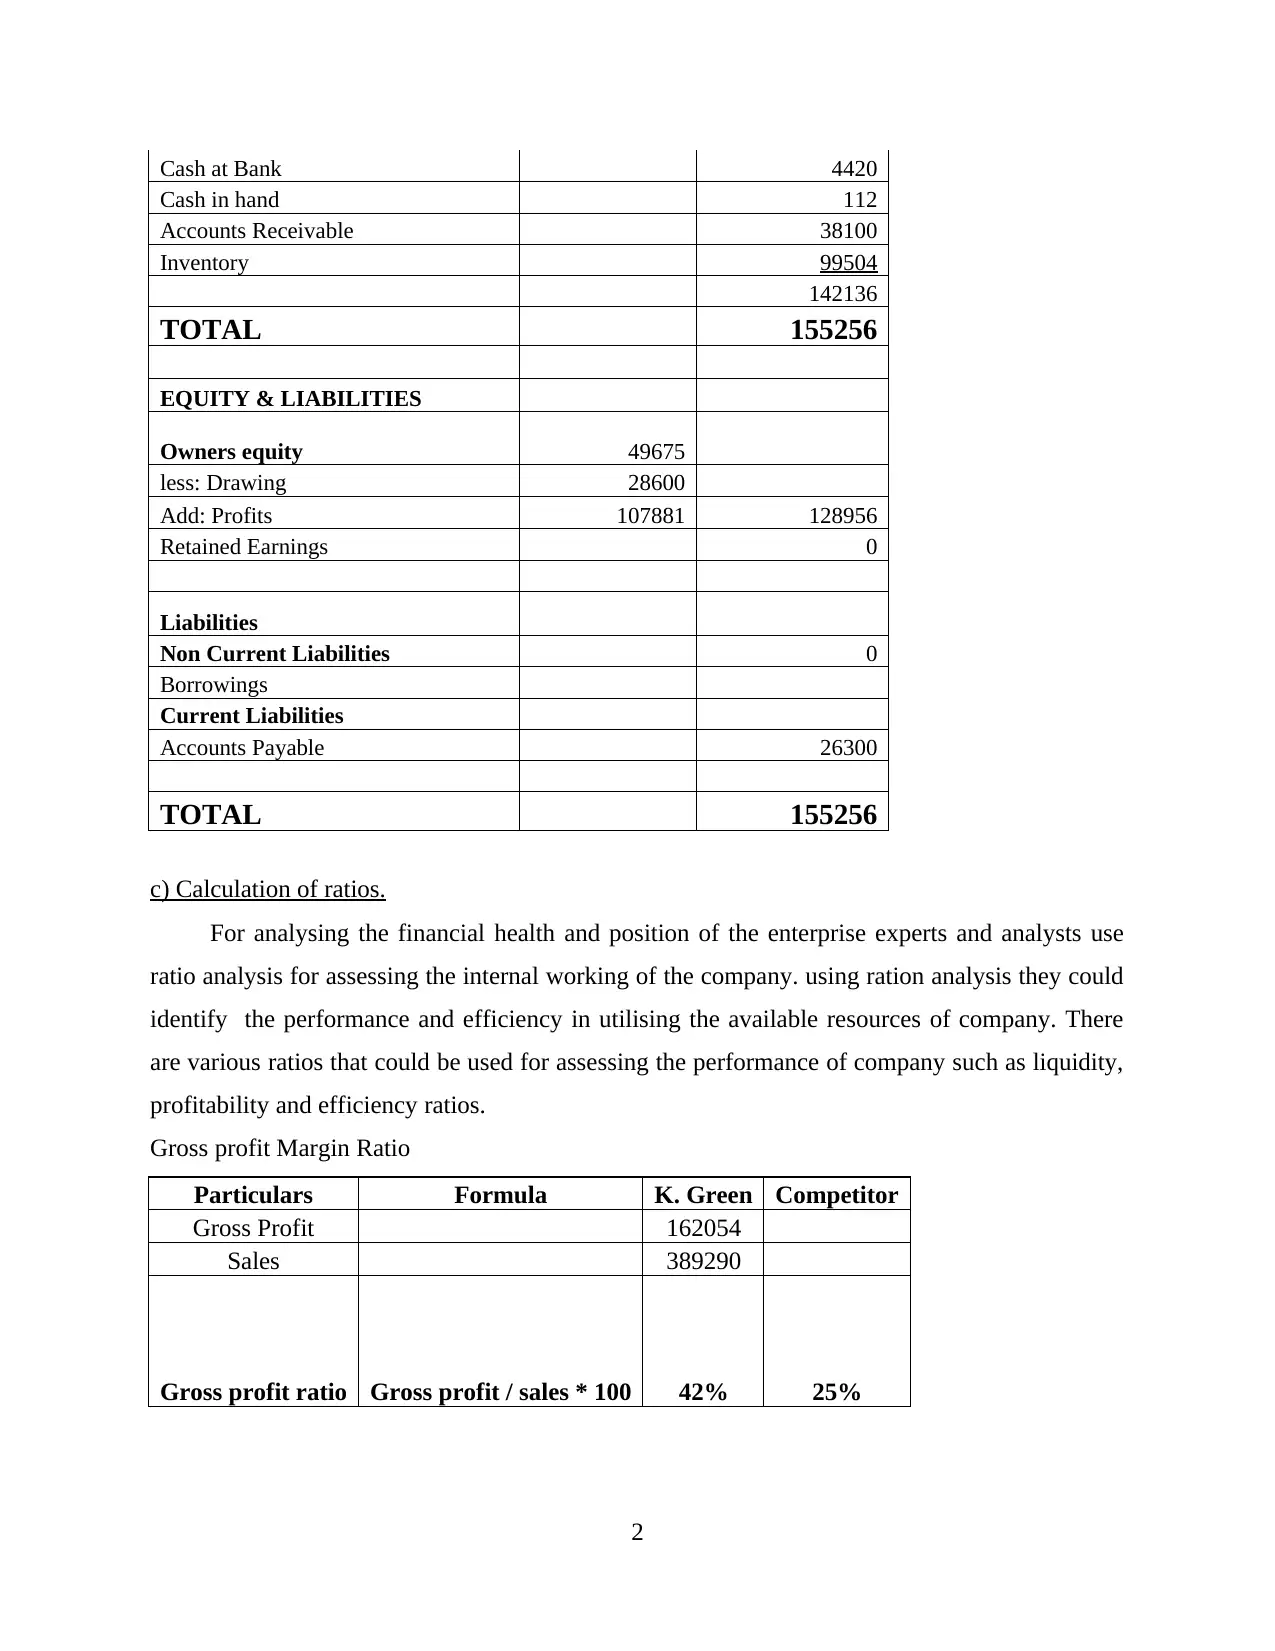
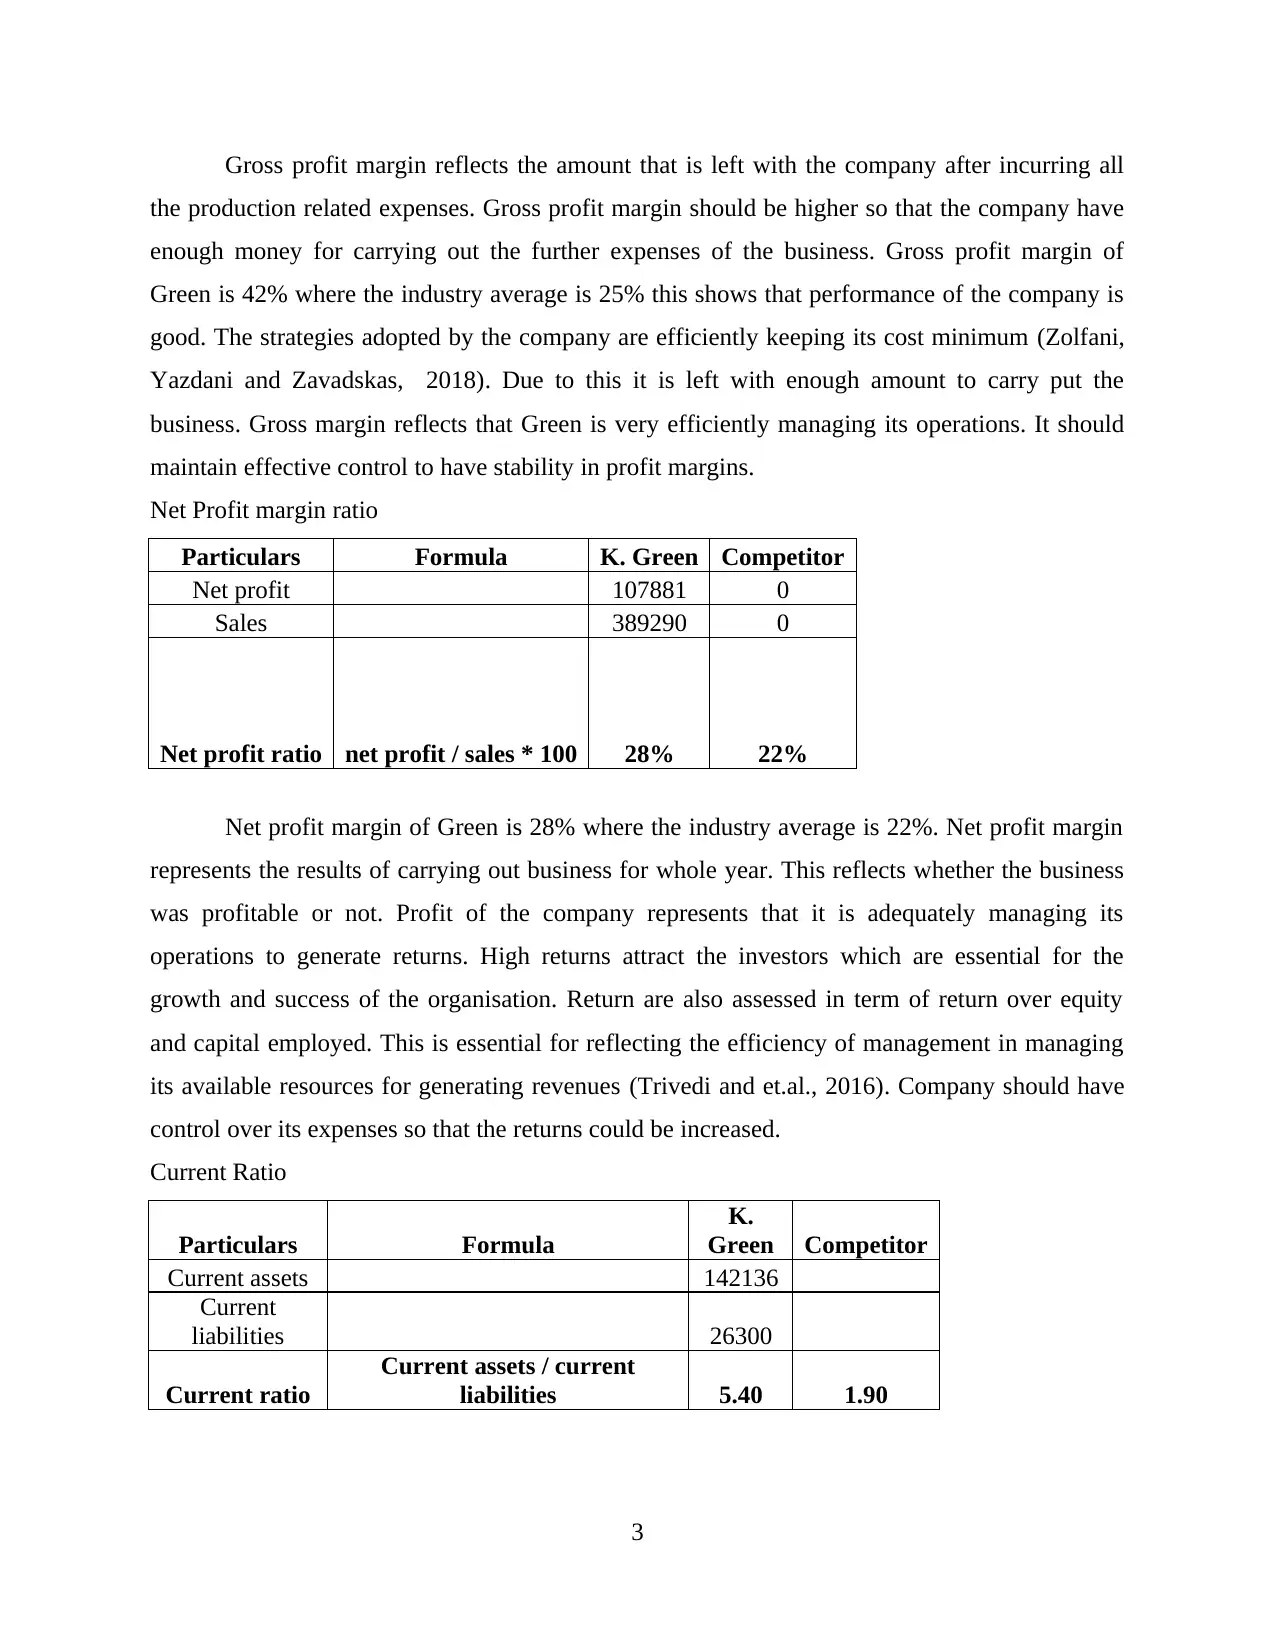
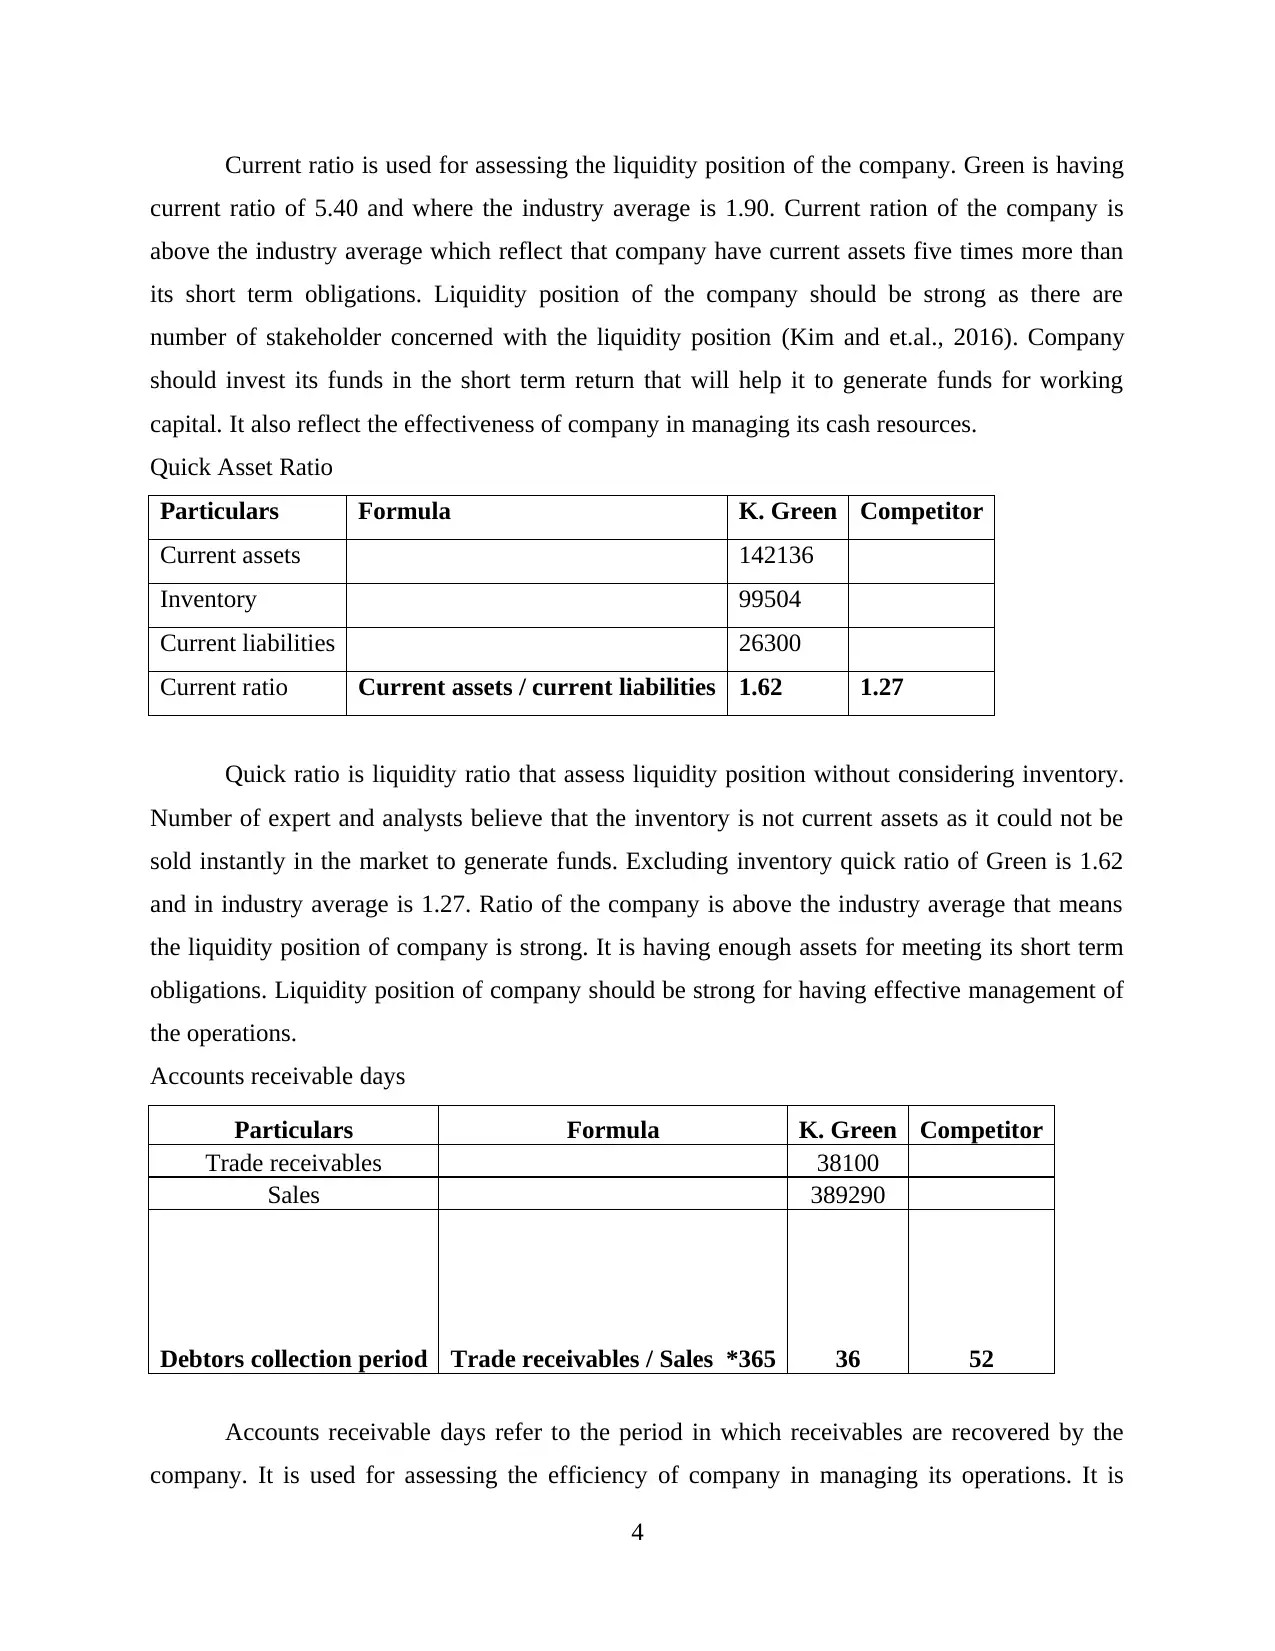
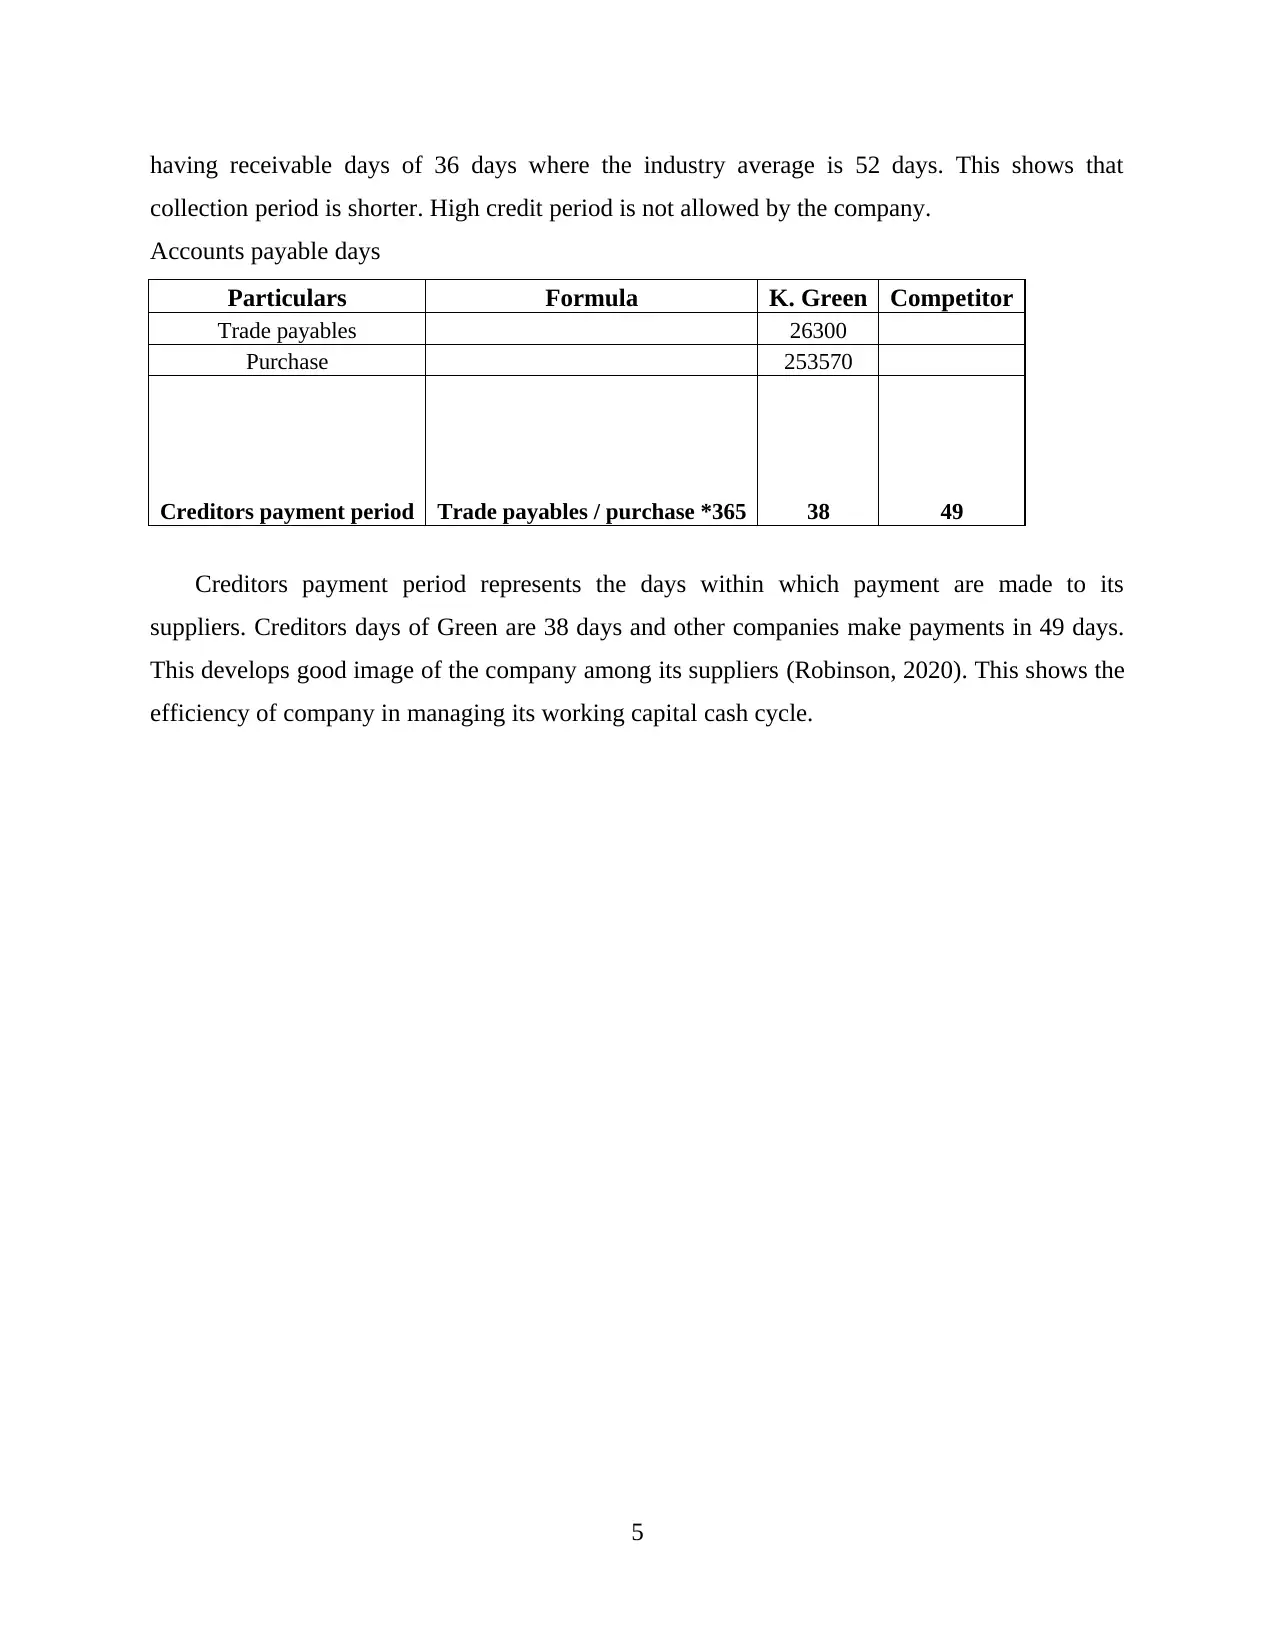
This assignment provides a detailed analysis of K. Green's financial performance based on the provided trial balance. It includes the preparation of an income statement, a statement of financial position (balance sheet), and the calculation of key financial ratios. The income statement presents revenues, cost of sales, operating expenses, and the resulting net profit. The statement of financial position outlines assets, liabilities, and equity, providing a snapshot of the company's financial position at a specific point in time. Furthermore, the assignment calculates and interprets various ratios, such as gross profit margin, net profit margin, current ratio, quick ratio, accounts receivable days, and accounts payable days, comparing them to industry averages to assess the company's liquidity, profitability, and efficiency. The analysis highlights the strengths and weaknesses of K. Green's financial management and provides insights into its operational performance.

RECORDING BUSINESS
TRANSACTIONS
TRANSACTIONS
Paraphrase This Document
Need a fresh take? Get an instant paraphrase of this document with our AI Paraphraser

TABLE OF CONTENTS
TABLE OF CONTENTS................................................................................................................2
QUESTIONS...................................................................................................................................1
a.) Income Statement of K. Green for the year ending 31st January 2020...................................1
b) Statement of Financial position...............................................................................................1
c) Calculation of ratios.................................................................................................................2
REFERENCES................................................................................................................................6

QUESTIONS
a.) Income Statement of K. Green for the year ending 31st January 2020.
Income Statement for the year ending 31st January 2020.
Particulars Amount
Revenues 389290
Cost of Sales
Opening Stock 72410
Purchases 253570
Closing Stock 99504 226476
Carriage Inwards 760
Gross Profits 162054
Operating Expenses
Carriage Outwards 2850
Motor Expenses 1490
Rent 8200
Telephone Charges 680
Wages and Salaries 39600
Insurance 745
Office expenses 392
Sundry expenses 216 54173
Net profit 107881
b) Statement of Financial position.
Statement of Financial Position for the year ending 31st January 2020.
ASSETS
Non Current Assets
Van 5650
Office Equipments 7470
13120
Current Assets
1
⊘ This is a preview!⊘
Do you want full access?
Subscribe today to unlock all pages.

Trusted by 1+ million students worldwide

Cash at Bank 4420
Cash in hand 112
Accounts Receivable 38100
Inventory 99504
142136
TOTAL 155256
EQUITY & LIABILITIES
Owners equity 49675
less: Drawing 28600
Add: Profits 107881 128956
Retained Earnings 0
Liabilities
Non Current Liabilities 0
Borrowings
Current Liabilities
Accounts Payable 26300
TOTAL 155256
c) Calculation of ratios.
For analysing the financial health and position of the enterprise experts and analysts use
ratio analysis for assessing the internal working of the company. using ration analysis they could
identify the performance and efficiency in utilising the available resources of company. There
are various ratios that could be used for assessing the performance of company such as liquidity,
profitability and efficiency ratios.
Gross profit Margin Ratio
Particulars Formula K. Green Competitor
Gross Profit 162054
Sales 389290
Gross profit ratio Gross profit / sales * 100 42% 25%
2
Paraphrase This Document
Need a fresh take? Get an instant paraphrase of this document with our AI Paraphraser

Gross profit margin reflects the amount that is left with the company after incurring all
the production related expenses. Gross profit margin should be higher so that the company have
enough money for carrying out the further expenses of the business. Gross profit margin of
Green is 42% where the industry average is 25% this shows that performance of the company is
good. The strategies adopted by the company are efficiently keeping its cost minimum (Zolfani,
Yazdani and Zavadskas, 2018). Due to this it is left with enough amount to carry put the
business. Gross margin reflects that Green is very efficiently managing its operations. It should
maintain effective control to have stability in profit margins.
Net Profit margin ratio
Particulars Formula K. Green Competitor
Net profit 107881 0
Sales 389290 0
Net profit ratio net profit / sales * 100 28% 22%
Net profit margin of Green is 28% where the industry average is 22%. Net profit margin
represents the results of carrying out business for whole year. This reflects whether the business
was profitable or not. Profit of the company represents that it is adequately managing its
operations to generate returns. High returns attract the investors which are essential for the
growth and success of the organisation. Return are also assessed in term of return over equity
and capital employed. This is essential for reflecting the efficiency of management in managing
its available resources for generating revenues (Trivedi and et.al., 2016). Company should have
control over its expenses so that the returns could be increased.
Current Ratio
Particulars Formula
K.
Green Competitor
Current assets 142136
Current
liabilities 26300
Current ratio
Current assets / current
liabilities 5.40 1.90
3

Current ratio is used for assessing the liquidity position of the company. Green is having
current ratio of 5.40 and where the industry average is 1.90. Current ration of the company is
above the industry average which reflect that company have current assets five times more than
its short term obligations. Liquidity position of the company should be strong as there are
number of stakeholder concerned with the liquidity position (Kim and et.al., 2016). Company
should invest its funds in the short term return that will help it to generate funds for working
capital. It also reflect the effectiveness of company in managing its cash resources.
Quick Asset Ratio
Particulars Formula K. Green Competitor
Current assets 142136
Inventory 99504
Current liabilities 26300
Current ratio Current assets / current liabilities 1.62 1.27
Quick ratio is liquidity ratio that assess liquidity position without considering inventory.
Number of expert and analysts believe that the inventory is not current assets as it could not be
sold instantly in the market to generate funds. Excluding inventory quick ratio of Green is 1.62
and in industry average is 1.27. Ratio of the company is above the industry average that means
the liquidity position of company is strong. It is having enough assets for meeting its short term
obligations. Liquidity position of company should be strong for having effective management of
the operations.
Accounts receivable days
Particulars Formula K. Green Competitor
Trade receivables 38100
Sales 389290
Debtors collection period Trade receivables / Sales *365 36 52
Accounts receivable days refer to the period in which receivables are recovered by the
company. It is used for assessing the efficiency of company in managing its operations. It is
4
⊘ This is a preview!⊘
Do you want full access?
Subscribe today to unlock all pages.

Trusted by 1+ million students worldwide

having receivable days of 36 days where the industry average is 52 days. This shows that
collection period is shorter. High credit period is not allowed by the company.
Accounts payable days
Particulars Formula K. Green Competitor
Trade payables 26300
Purchase 253570
Creditors payment period Trade payables / purchase *365 38 49
Creditors payment period represents the days within which payment are made to its
suppliers. Creditors days of Green are 38 days and other companies make payments in 49 days.
This develops good image of the company among its suppliers (Robinson, 2020). This shows the
efficiency of company in managing its working capital cash cycle.
5
Paraphrase This Document
Need a fresh take? Get an instant paraphrase of this document with our AI Paraphraser

REFERENCES
Books and Journals
Zolfani, S.H., Yazdani, M. and Zavadskas, E.K., 2018. An extended stepwise weight assessment
ratio analysis (SWARA) method for improving criteria prioritization process. Soft
Computing. 22(22). pp.7399-7405.
Trivedi, M.K. and et.al., 2016. Isotopic abundance ratio analysis of biofield energy treated indole
using gas chromatography-mass spectrometry.
Robinson, T.R., 2020. International financial statement analysis. John Wiley & Sons.
Kim, J.B. and et.al., 2016. Financial statement comparability and expected crash risk. Journal of
Accounting and Economics. 61(2-3). pp.294-312.
6
1 out of 8