Data analysis with IBM SPSS statistics
Added on 2022-09-18
6 Pages896 Words15 Views
Running Head: REGRESSION ANALYSIS AND ITS INTERPRETATION
REGRESSION ANALYSIS AND ITS INTERPRETATION
Name of the Student:
Name of the University:
Author Note:
REGRESSION ANALYSIS AND ITS INTERPRETATION
Name of the Student:
Name of the University:
Author Note:

REGRESSION ANALYSIS AND ITS INTERPRETATION1
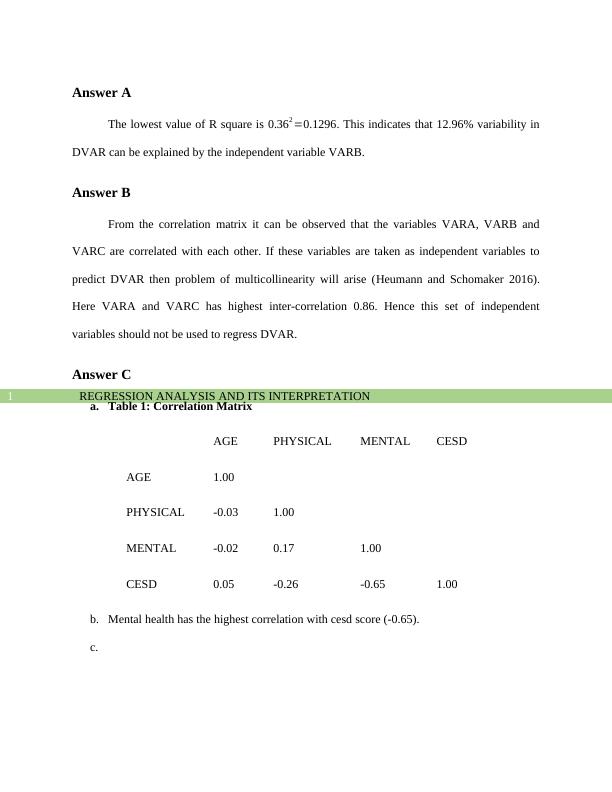
Answer A
The lowest value of R square is 0.362 =0.1296. This indicates that 12.96% variability in
DVAR can be explained by the independent variable VARB.
Answer B
From the correlation matrix it can be observed that the variables VARA, VARB and
VARC are correlated with each other. If these variables are taken as independent variables to
predict DVAR then problem of multicollinearity will arise (Heumann and Schomaker 2016).
Here VARA and VARC has highest inter-correlation 0.86. Hence this set of independent
variables should not be used to regress DVAR.
Answer C
a. Table 1: Correlation Matrix
AGE PHYSICAL MENTAL CESD
AGE 1.00
PHYSICAL -0.03 1.00
MENTAL -0.02 0.17 1.00
CESD 0.05 -0.26 -0.65 1.00
b. Mental health has the highest correlation with cesd score (-0.65).
c.
REGRESSION ANALYSIS AND ITS INTERPRETATION2
Correlations
Age at
first
birth
CES-D
Score
SF12: Physical Health
Component Score,
standardized
SF12: Mental Health
Component Score,
standardized
Age at first birth Pearson
Correlation
1 .045 -.033 -.020
Sig. (2-tailed) .182 .339 .558
N 929 897 834 834
CES-D Score Pearson
Correlation
.045 1 -.264** -.651**
Sig. (2-tailed) .182 .000 .000
N 897 962 884 884
SF12: Physical Health
Component Score,
standardized
Pearson
Correlation
-.033 -.264** 1 .168**
Sig. (2-tailed) .339 .000 .000
N 834 884 893 893
SF12: Mental Health
Component Score,
standardized
Pearson
Correlation
-.020 -.651** .168** 1
Sig. (2-tailed) .558 .000 .000
N 834 884 893 893
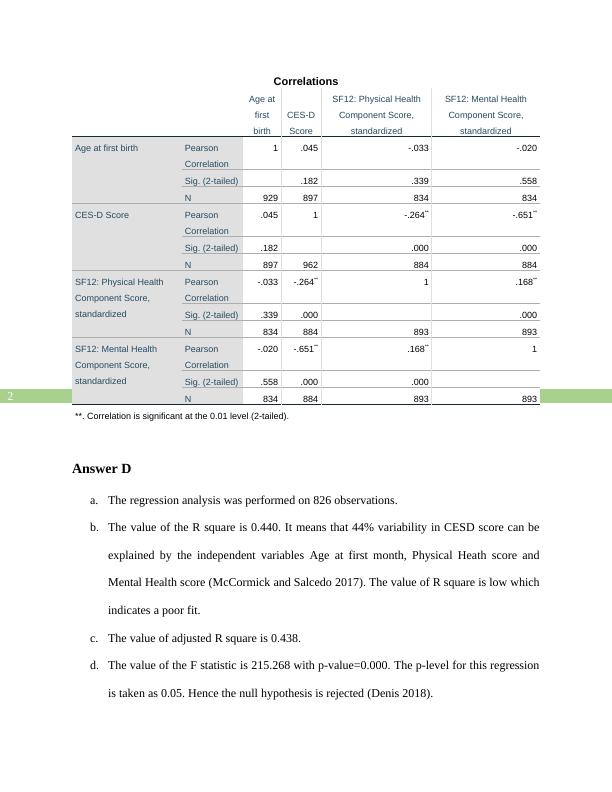
**. Correlation is significant at the 0.01 level (2-tailed).
Answer D
a. The regression analysis was performed on 826 observations.
b. The value of the R square is 0.440. It means that 44% variability in CESD score can be
explained by the independent variables Age at first month, Physical Heath score and
Mental Health score (McCormick and Salcedo 2017). The value of R square is low which
indicates a poor fit.
c. The value of adjusted R square is 0.438.
d. The value of the F statistic is 215.268 with p-value=0.000. The p-level for this regression
is taken as 0.05. Hence the null hypothesis is rejected (Denis 2018).
Correlations
Age at
first
birth
CES-D
Score
SF12: Physical Health
Component Score,
standardized
SF12: Mental Health
Component Score,
standardized
Age at first birth Pearson
Correlation
1 .045 -.033 -.020
Sig. (2-tailed) .182 .339 .558
N 929 897 834 834
CES-D Score Pearson
Correlation
.045 1 -.264** -.651**
Sig. (2-tailed) .182 .000 .000
N 897 962 884 884
SF12: Physical Health
Component Score,
standardized
Pearson
Correlation
-.033 -.264** 1 .168**
Sig. (2-tailed) .339 .000 .000
N 834 884 893 893
SF12: Mental Health
Component Score,
standardized
Pearson
Correlation
-.020 -.651** .168** 1
Sig. (2-tailed) .558 .000 .000
N 834 884 893 893
**. Correlation is significant at the 0.01 level (2-tailed).
Answer D
a. The regression analysis was performed on 826 observations.
b. The value of the R square is 0.440. It means that 44% variability in CESD score can be
explained by the independent variables Age at first month, Physical Heath score and
Mental Health score (McCormick and Salcedo 2017). The value of R square is low which
indicates a poor fit.
c. The value of adjusted R square is 0.438.
d. The value of the F statistic is 215.268 with p-value=0.000. The p-level for this regression
is taken as 0.05. Hence the null hypothesis is rejected (Denis 2018).
End of preview
Want to access all the pages? Upload your documents or become a member.
Related Documents
Statistical Analysis Using SPSSlg...
|11
|1697
|26