logo

Regression Analysis Results for Demand of Cereal Feed in US Households

To understand this data, we will outline the significance of the coefficients that we discovered by utilizing regression analysis.

5 Pages1127 Words110 Views
   

Added on  2023-06-08

About This Document

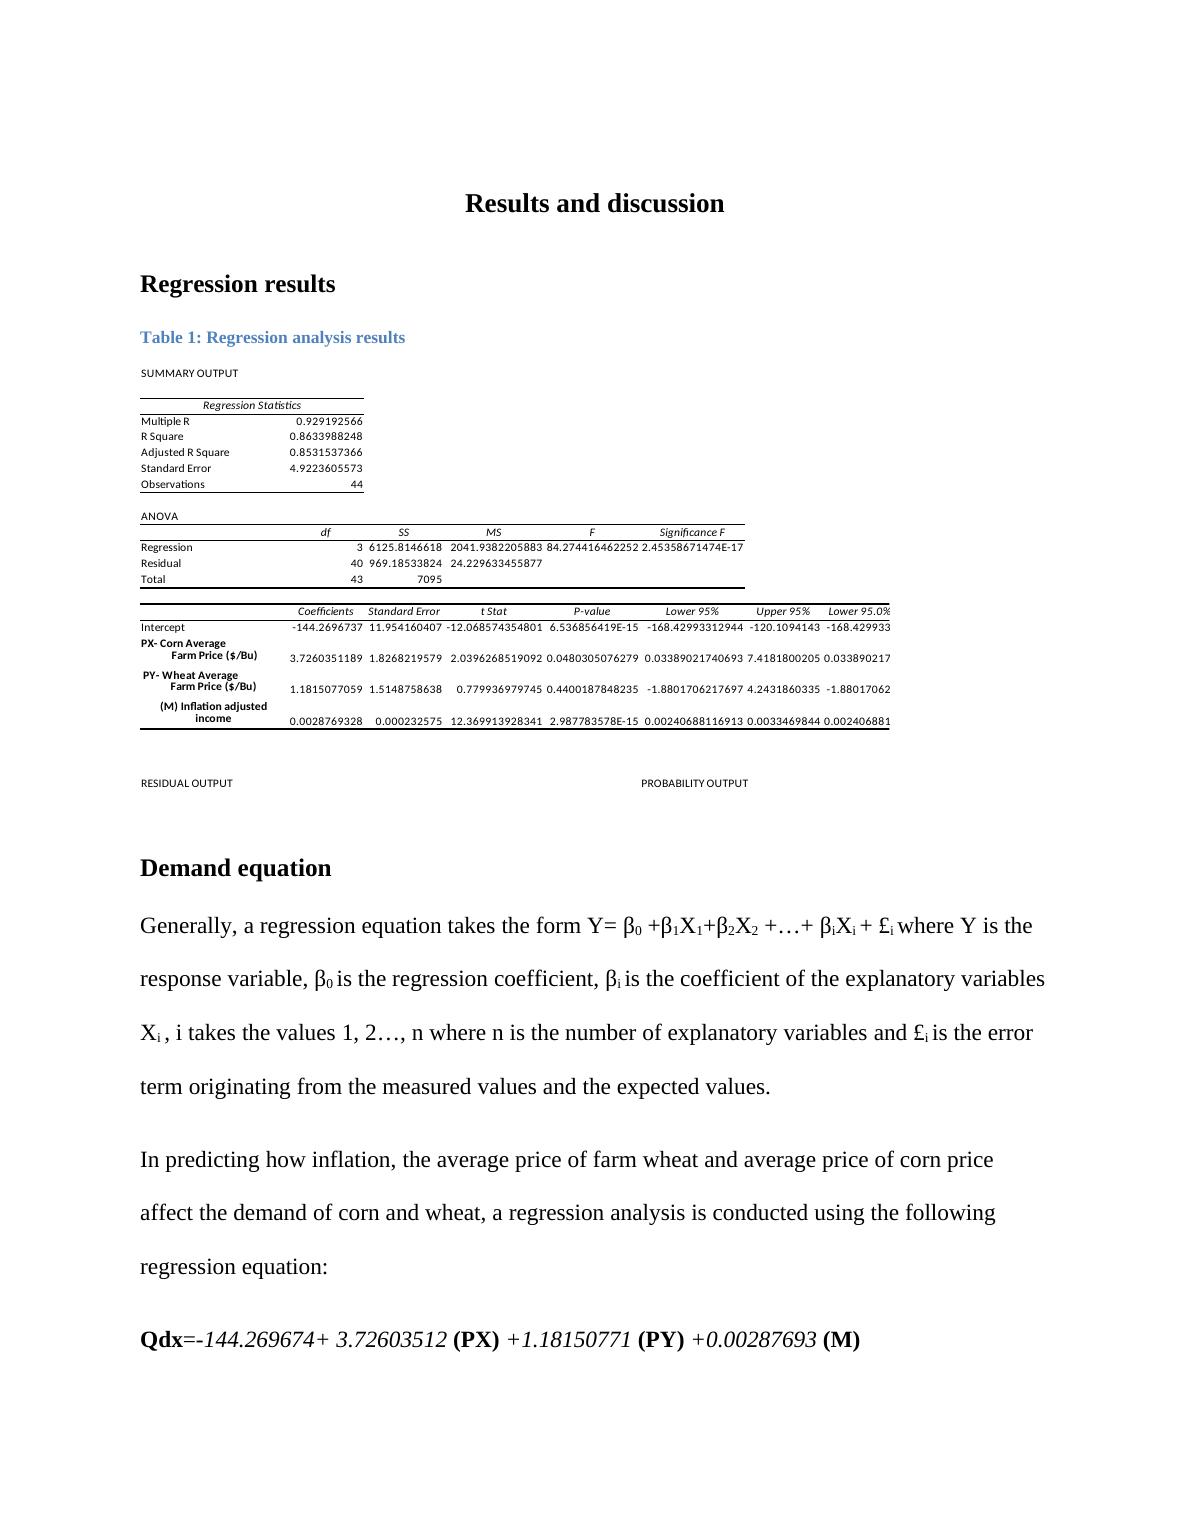
This study analyzes the regression results for the demand of cereal feed in US households. The regression equation used is Qdx=-144.269674+ 3.72603512 (PX) +1.18150771 (PY) +0.00287693 (M). The study finds that the demand of cereals is influenced by factors such as income and the average household income.

Regression Analysis Results for Demand of Cereal Feed in US Households

To understand this data, we will outline the significance of the coefficients that we discovered by utilizing regression analysis.

   Added on 2023-06-08

ShareRelated Documents
Results and discussion
Regression results
Table 1: Regression analysis results
SUMMARY OUTPUT
Regression Statistics
Multiple R 0.929192566
R Square 0.8633988248
Adjusted R Square 0.8531537366
Standard Error 4.9223605573
Observations 44
ANOVA
df SS MS F Significance F
Regression 3 6125.8146618 2041.9382205883 84.274416462252 2.45358671474E-17
Residual 40 969.18533824 24.229633455877
Total 43 7095
Coefficients Standard Error t Stat P-value Lower 95% Upper 95% Lower 95.0%
Intercept -144.2696737 11.954160407 -12.068574354801 6.536856419E-15 -168.42993312944 -120.1094143 -168.4299331
3.7260351189 1.8268219579 2.0396268519092 0.0480305076279 0.03389021740693 7.4181800205 0.0338902174
1.1815077059 1.5148758638 0.779936979745 0.4400187848235 -1.8801706217697 4.2431860335 -1.880170622
0.0028769328 0.000232575 12.369913928341 2.987783578E-15 0.00240688116913 0.0033469844 0.0024068812
RESIDUAL OUTPUT PROBABILITY OUTPUT
PX- Corn Average
Farm Price ($/Bu)
PY- Wheat Average
Farm Price ($/Bu)
(M) Inflation adjusted
income
Demand equation
Generally, a regression equation takes the form Y= β0 +β1X12X2 +...+ βiXi + £i where Y is the
response variable, β0 is the regression coefficient, βi is the coefficient of the explanatory variables
Xi , i takes the values 1, 2..., n where n is the number of explanatory variables and £i is the error
term originating from the measured values and the expected values.
In predicting how inflation, the average price of farm wheat and average price of corn price
affect the demand of corn and wheat, a regression analysis is conducted using the following
regression equation:
Qdx=-144.269674+ 3.72603512 (PX) +1.18150771 (PY) +0.00287693 (M)
Regression Analysis Results for Demand of Cereal Feed in US Households_1
Where:
Qdx is the demand i.e. wheat and corn consumption
PX is the corn average farm price feed
PY is the corn average farm price of wheat
M is the inflation adjusted income of US households
Interpretation of the Regression results
The coefficient of Corn average farm price is 3.72603512, thus there is a positive relationship
between demand and the corn average farm price. Whereby, an increase in the corn average farm
price by 1,000$ would lead to an increase in the demand of consumption by 3.72603512$, and
the consumption demand would increase by 1.18150771 in case the wheat average farm price
would increase by 1,000$. Additionally, the inflation adjusted income for US households have a
very low marginally effects on the demand of cereal feed whereby an increase in 1,000$ in the
inflation adjusted income would lead to only a 0.00287693$ increase in the demand which is
0.28769% increase, all other factors affecting demand held constant in the mentioned cases.
In comparing the joint effect of combined factors, that is corn average farm price and wheat
average farm price, a joint increase of 1,000$ on both factors would lead to a 4.90754283
increase in demand. Therefore, both wheat and corn feeds have a joint demand where an increase
in demand of one leads to an increase in demand of the other.
Regression Analysis Results for Demand of Cereal Feed in US Households_2

End of preview

Want to access all the pages? Upload your documents or become a member.

Related Documents
Management Economics Question 2022
|9
|2211
|7

Economic Analysis - Assignment Sample
|8
|1298
|111

Estimating a Regression and Linear Regression Model for Wine Consumption and Deaths
|6
|1191
|472

STAT 6003: Statistics for Financial Decisions
|9
|1214
|114

Quantitative Demand Analysis - Assignment
|8
|1409
|314

Econometric Solutions and Questions
|21
|2614
|384